

Integration of the ImageJ Ecosystem in the KNIME Analytics Platform
- PMID: 32905440
- PMCID: PMC7469687
- DOI: 10.3389/fcomp.2020.00008
Integration of the ImageJ Ecosystem in the KNIME Analytics Platform
Abstract
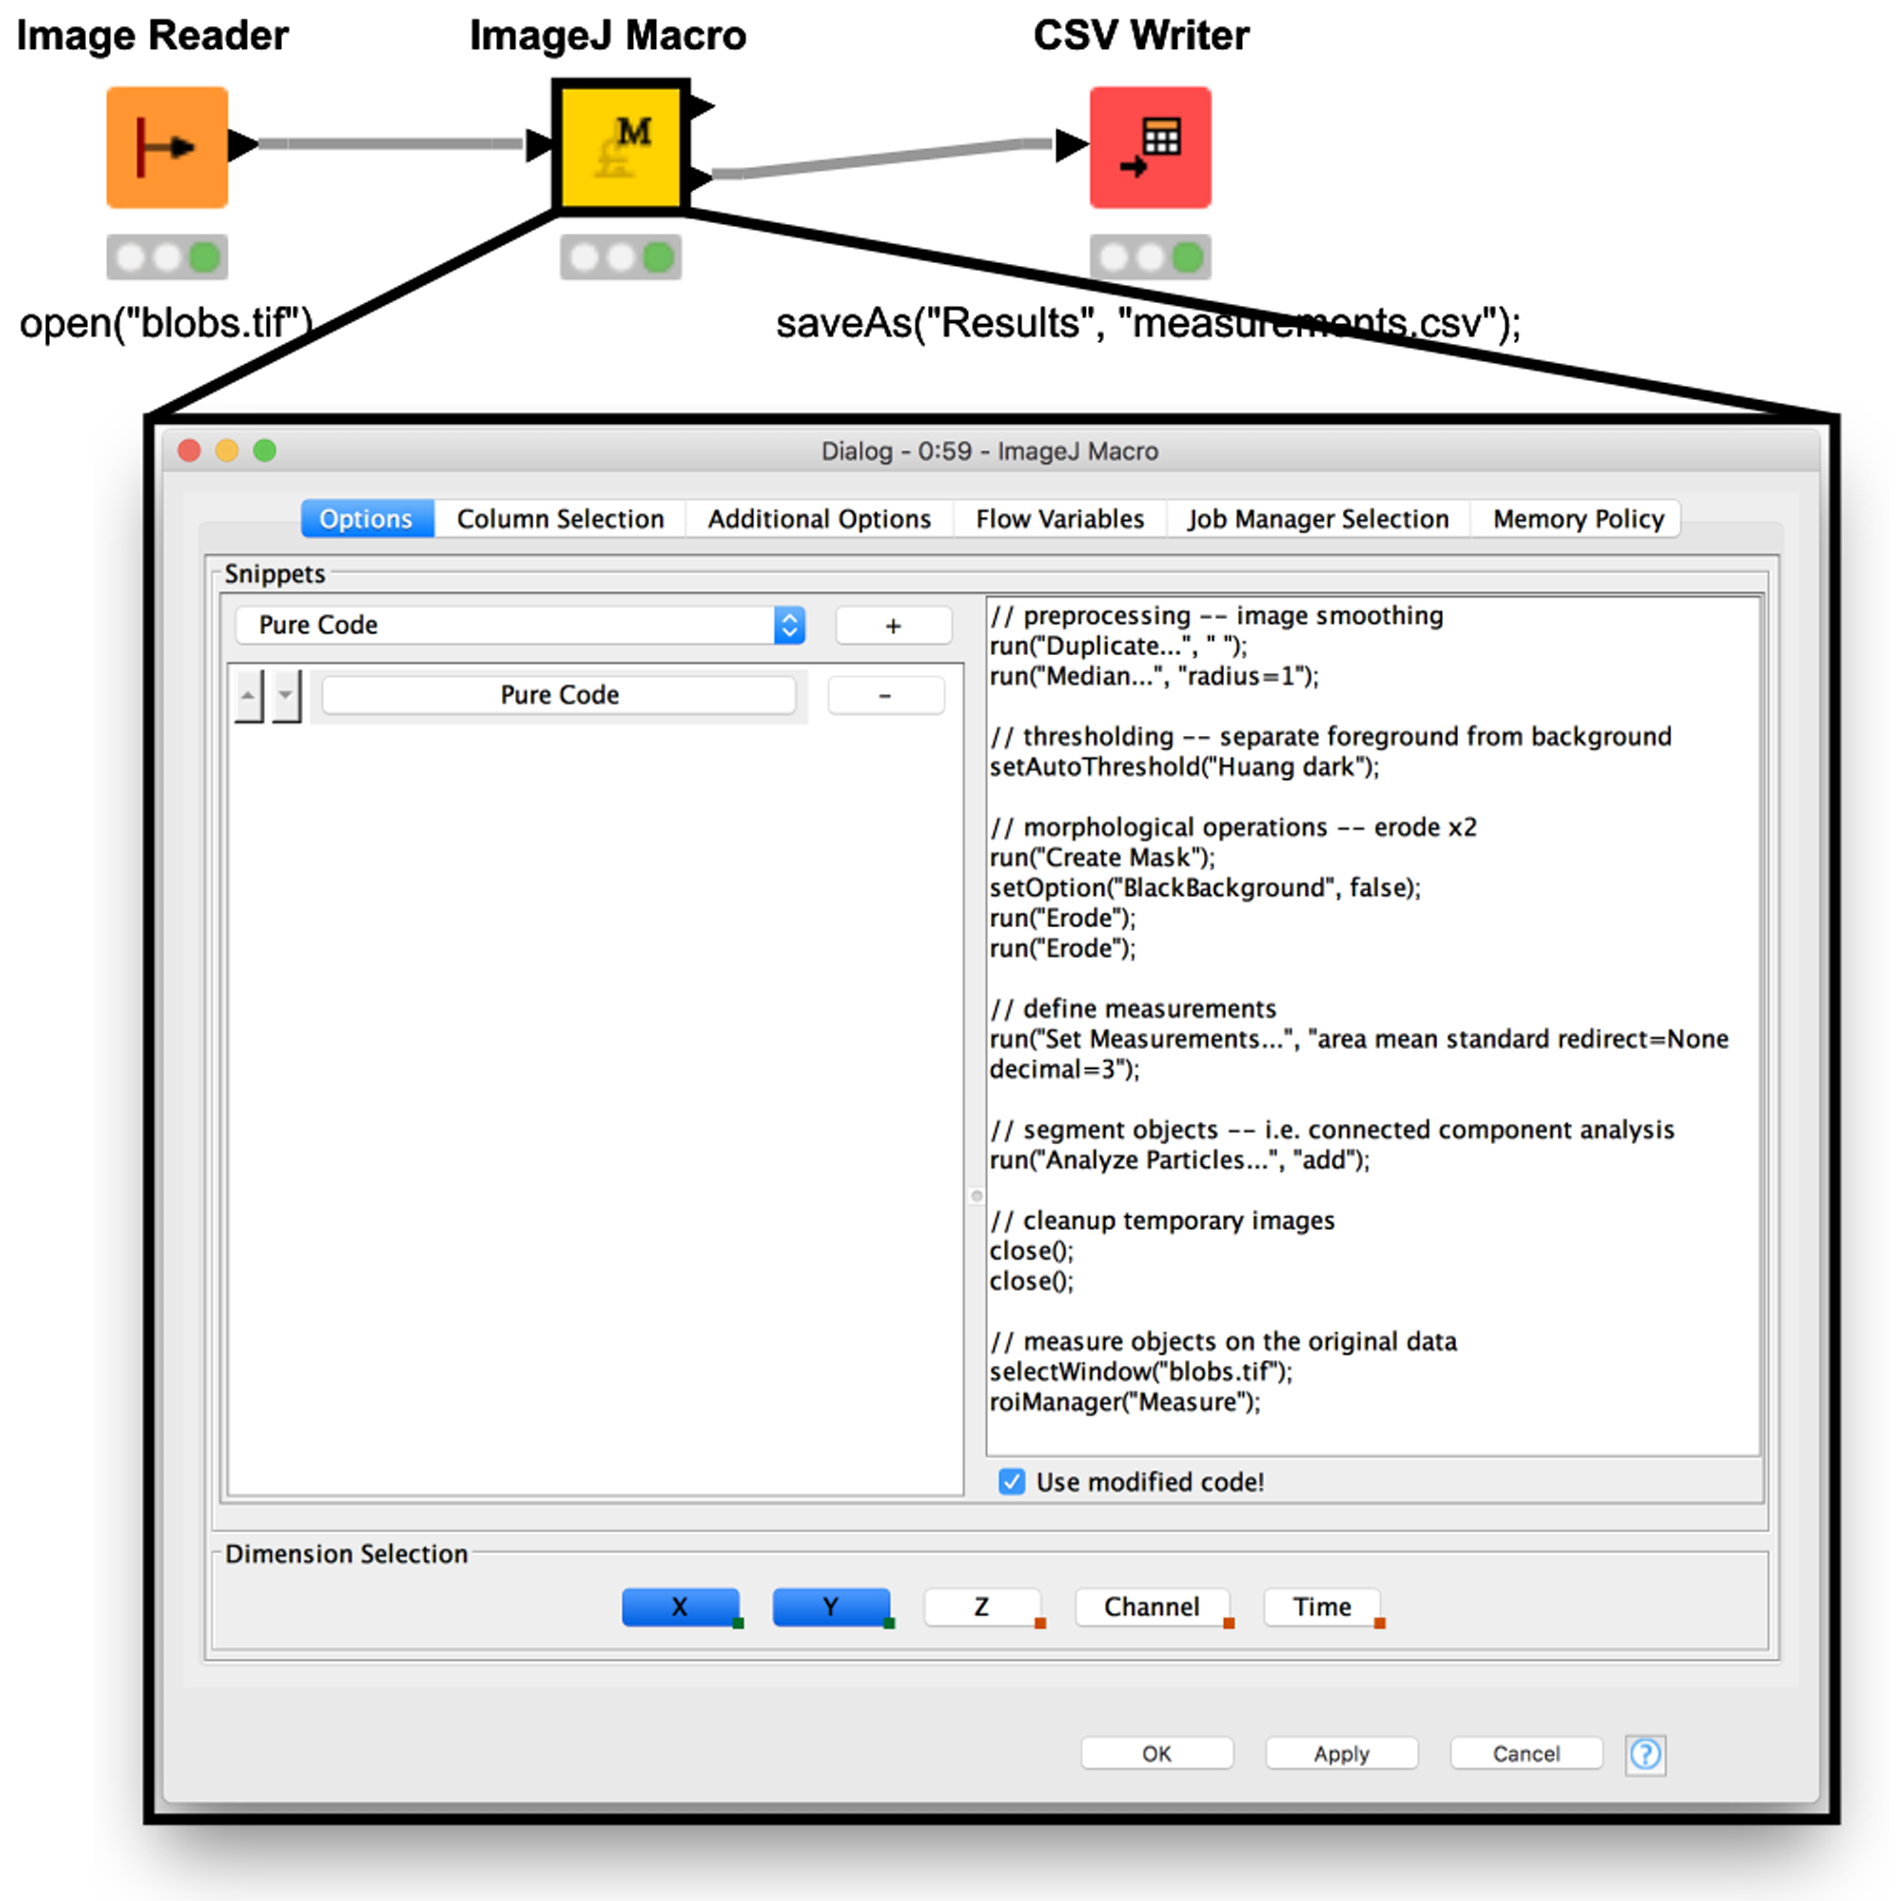
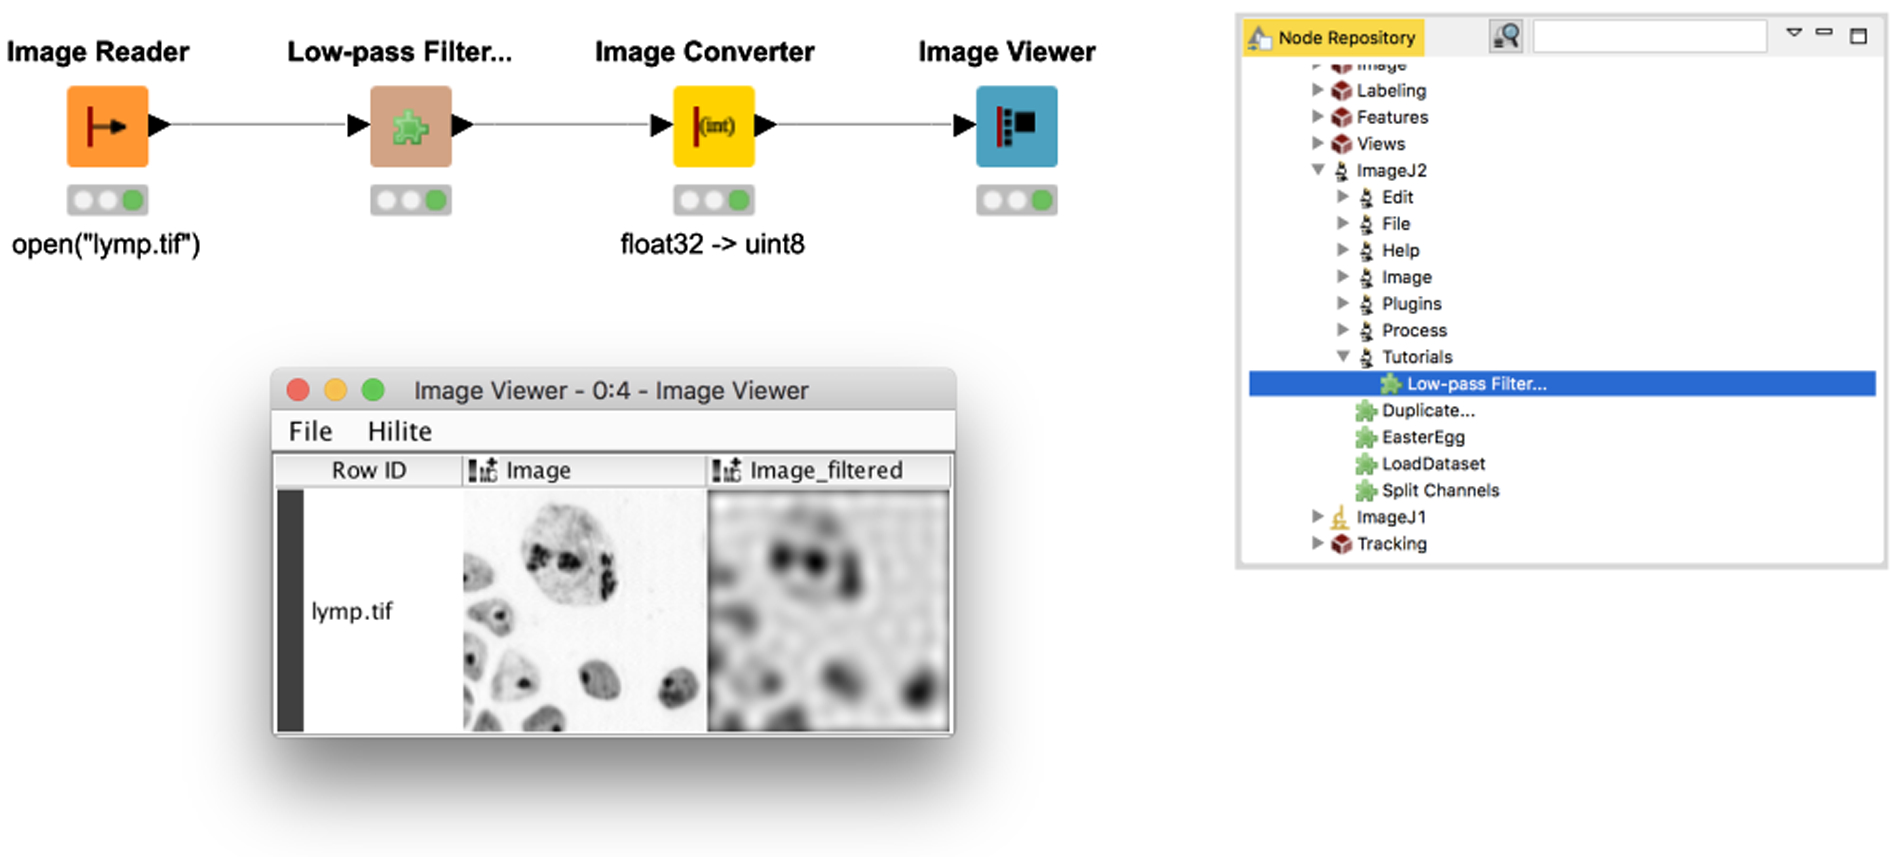
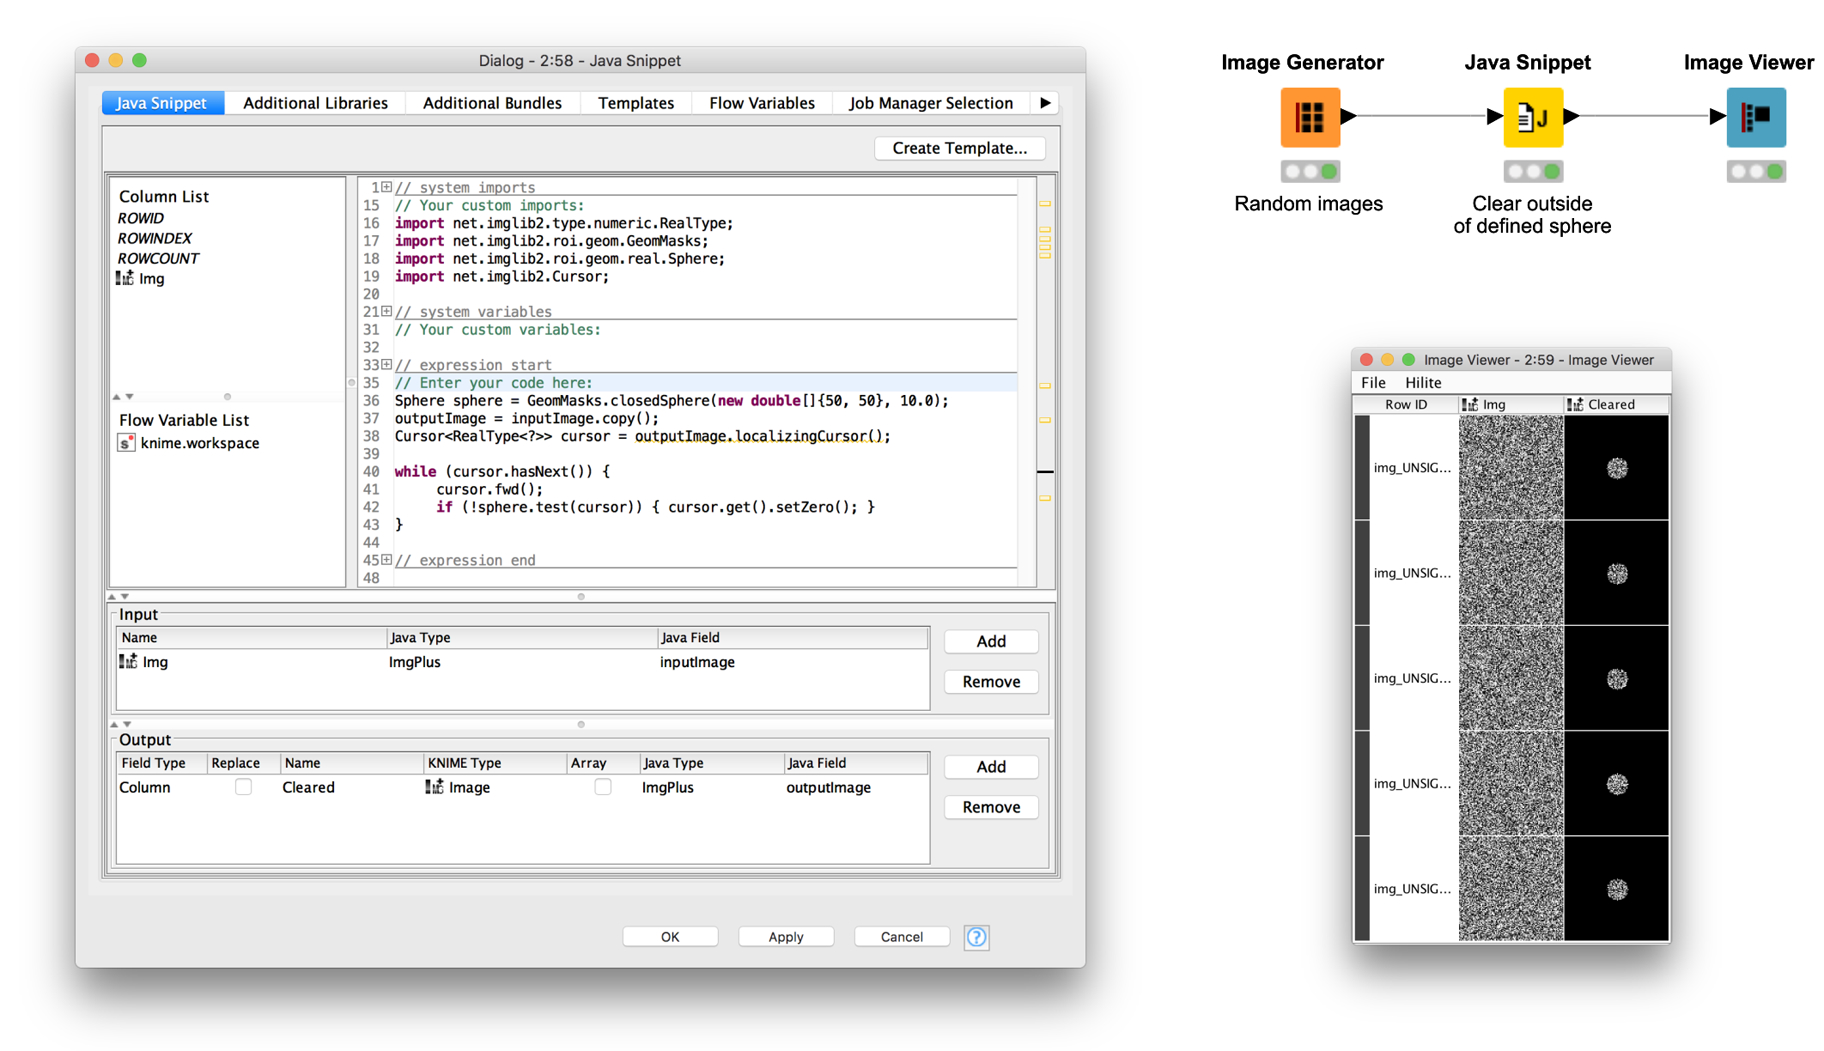
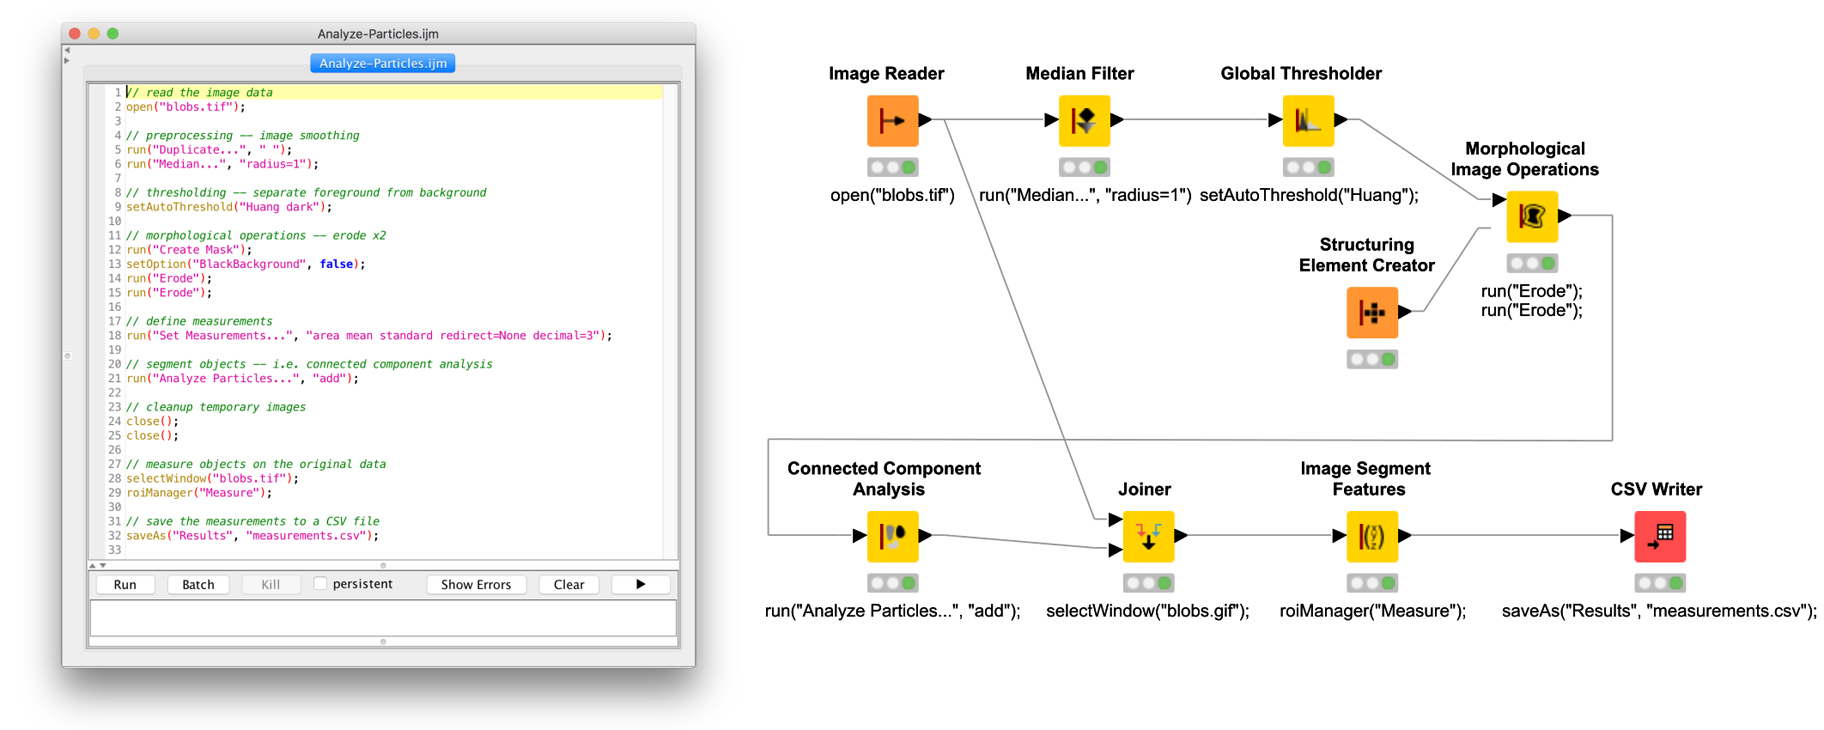
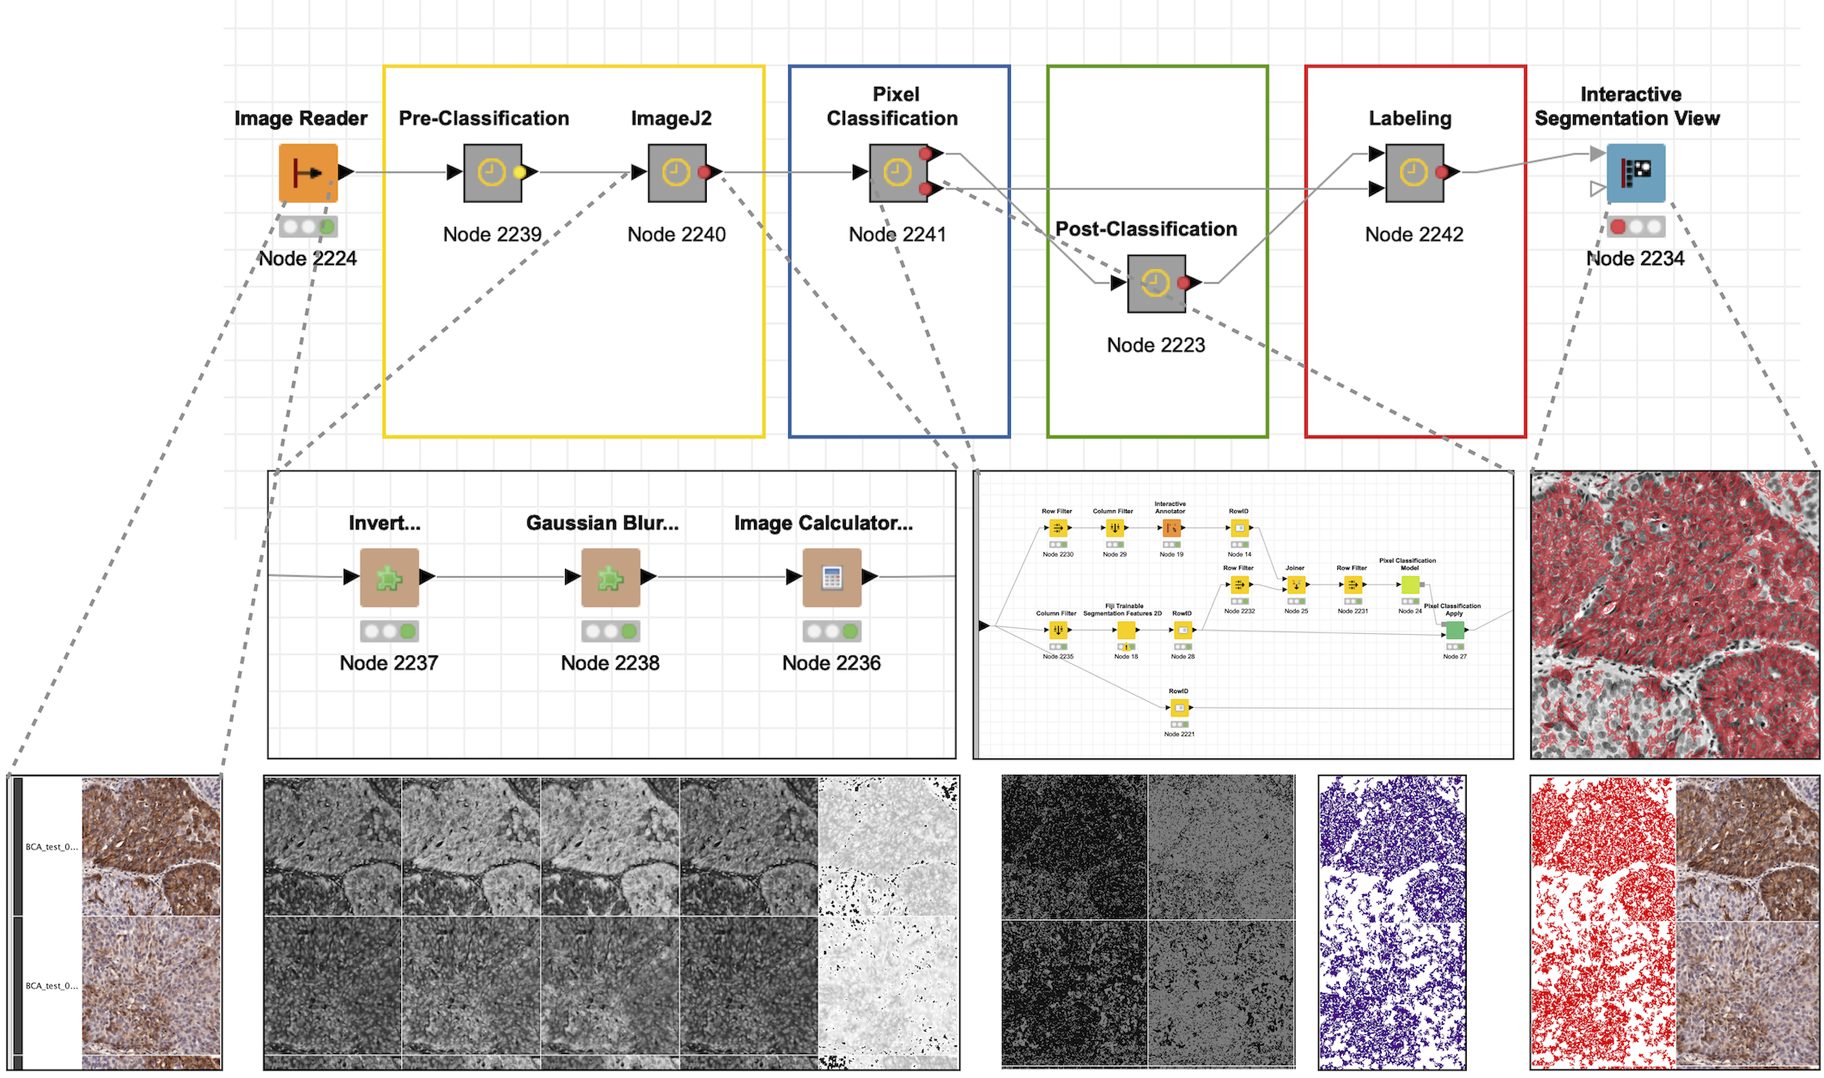
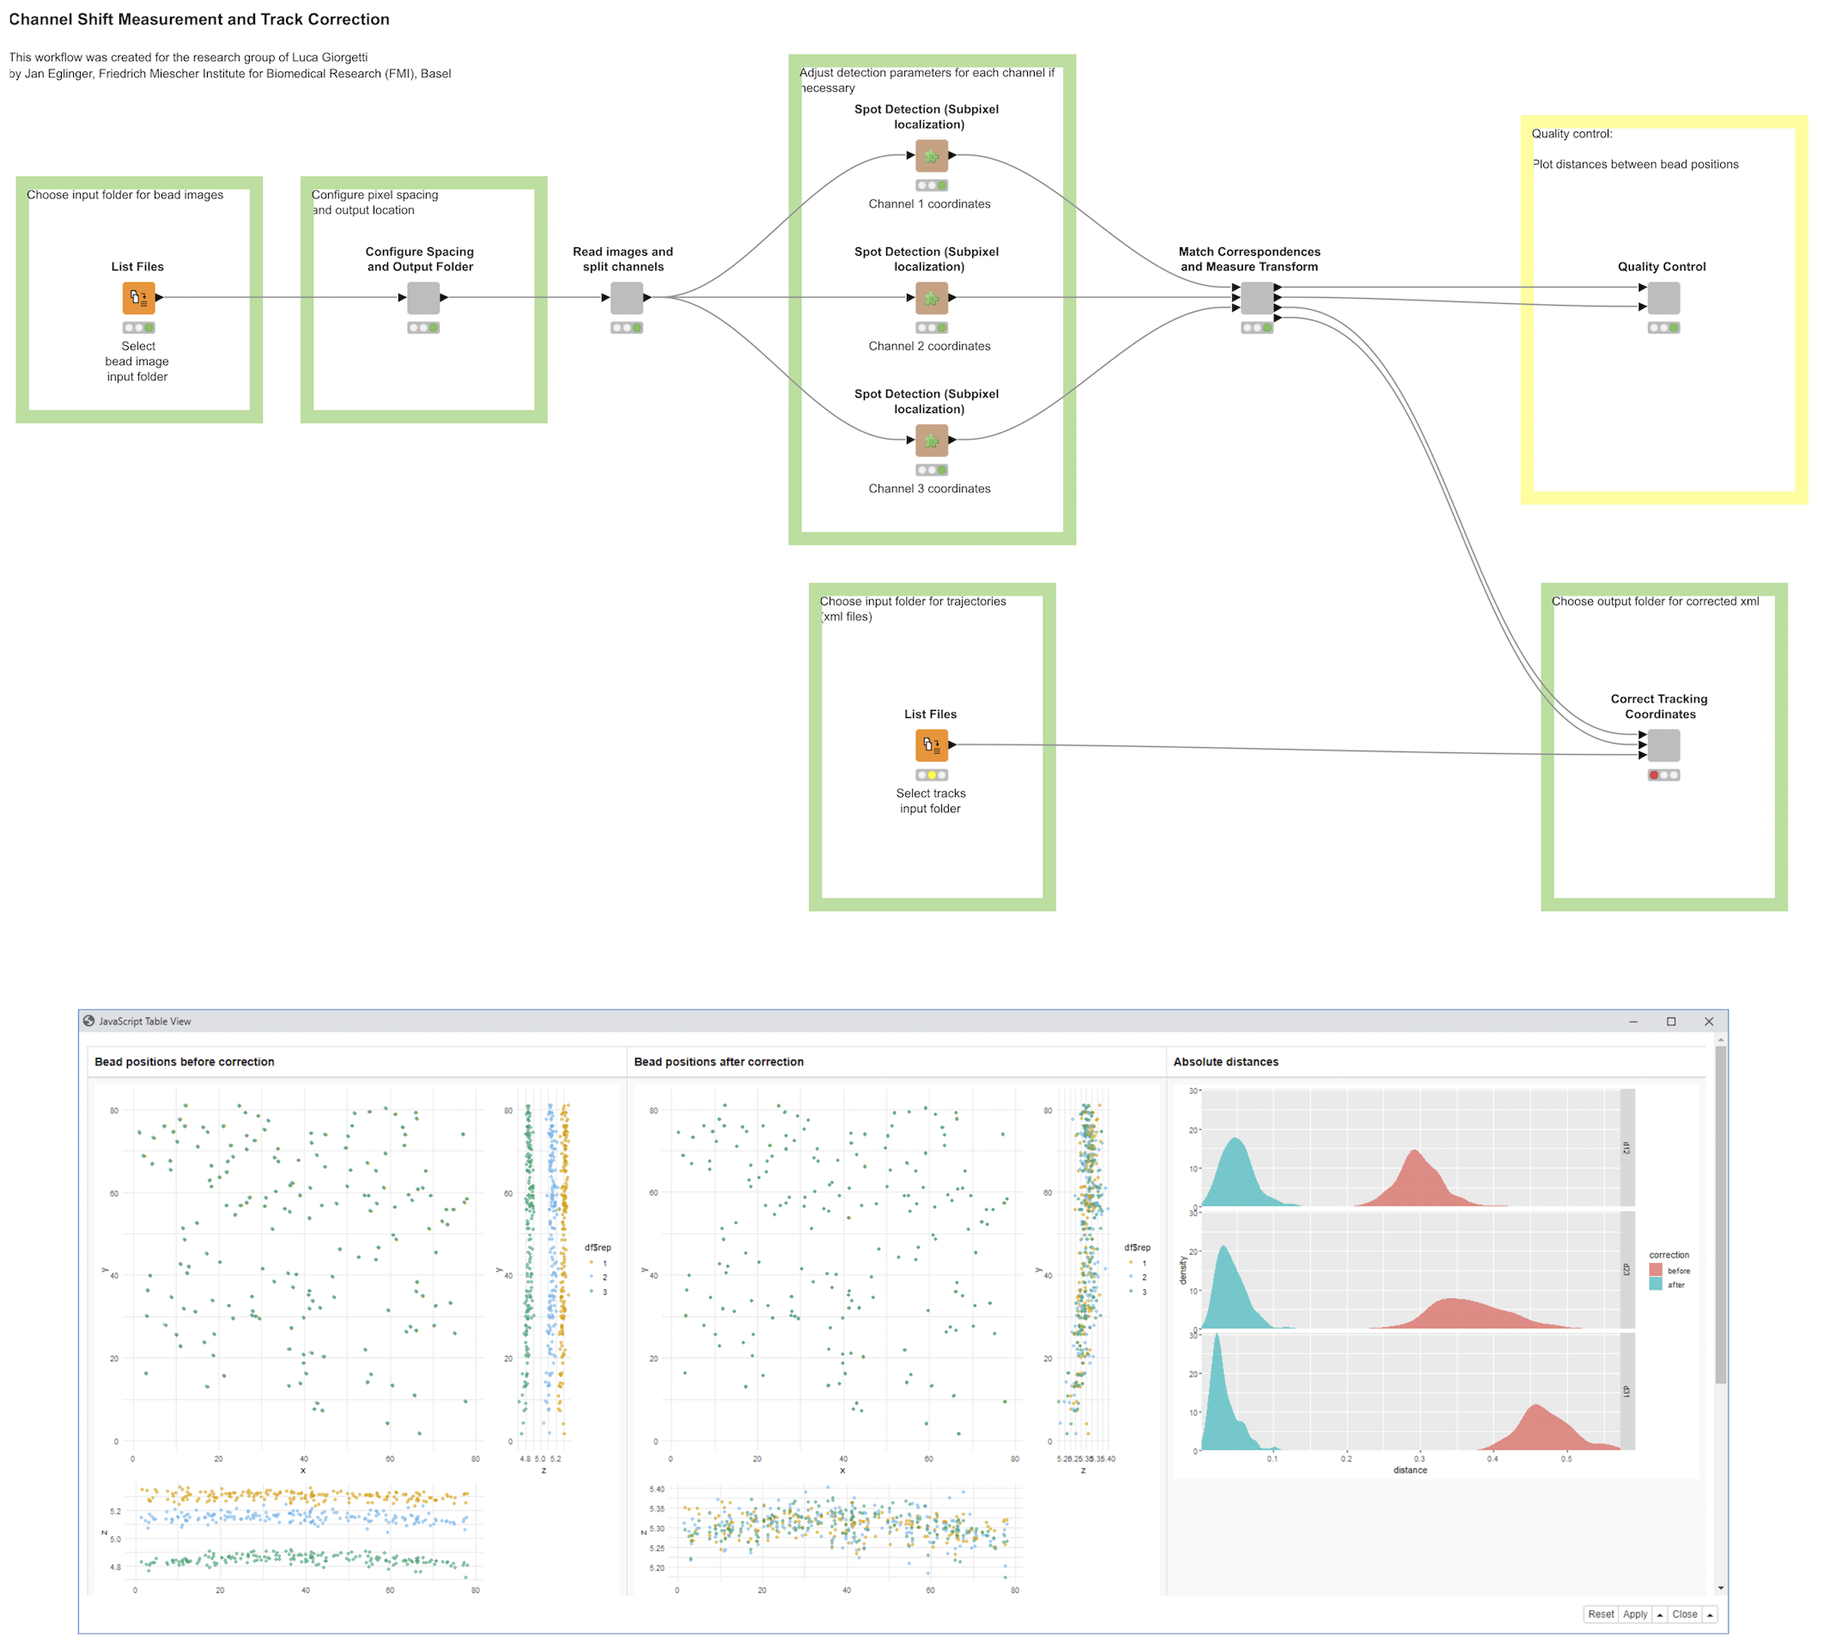
Open-source software tools are often used for analysis of scientific image data due to their flexibility and transparency in dealing with rapidly evolving imaging technologies. The complex nature of image analysis problems frequently requires many tools to be used in conjunction, including image processing and analysis, data processing, machine learning and deep learning, statistical analysis of the results, visualization, correlation to heterogeneous but related data, and more. However, the development, and therefore application, of these computational tools is impeded by a lack of integration across platforms. Integration of tools goes beyond convenience, as it is impractical for one tool to anticipate and accommodate the current and future needs of every user. This problem is emphasized in the field of bioimage analysis, where various rapidly emerging methods are quickly being adopted by researchers. ImageJ is a popular open-source image analysis platform, with contributions from a global community resulting in hundreds of specialized routines for a wide array of scientific tasks. ImageJ's strength lies in its accessibility and extensibility, allowing researchers to easily improve the software to solve their image analysis tasks. However, ImageJ is not designed for development of complex end-to-end image analysis workflows. Scientists are often forced to create highly specialized and hard-to-reproduce scripts to orchestrate individual software fragments and cover the entire life-cycle of an analysis of an image dataset. KNIME Analytics Platform, a user-friendly data integration, analysis, and exploration workflow system, was designed to handle huge amounts of heterogeneous data in a platform-agnostic, computing environment and has been successful in meeting complex end-to-end demands in several communities, such as cheminformatics and mass spectrometry. Similar needs within the bioimage analysis community led to the creation of the KNIME Image Processing extension which integrates ImageJ into KNIME Analytics Platform, enabling researchers to develop reproducible and scalable workflows, integrating a diverse range of analysis tools. Here we present how users and developers alike can leverage the ImageJ ecosystem via the KNIME Image Processing extension to provide robust and extensible image analysis within KNIME workflows. We illustrate the benefits of this integration with examples, as well as representative scientific use cases.
Keywords: Bioimaging; Fiji; ImageJ; KNIME; computational workflows; image analysis; interoperability; open-source.
Conflict of interest statement
5Conflict of Interest CD, SH and MRB have a financial interest in KNIME GmbH, the company developing and supporting KNIME Analytics Platform. All other authors declare that the research was conducted in the absence of any commercial or financial relationships that could be construed as a potential conflict of interest.
Figures

References
-
- Afgan Enis, Baker Dannon, Batut Bérénice, Marius van den Beek, Dave Bouvier, Martin Čech, John Chilton, et al. 2018. “The Galaxy Platform for Accessible, Reproducible and Collaborative Biomedical Analyses: 2018 Update.” Nucleic Acids Research 46 (W1): W537–44. 10.1093/nar/gky379. - DOI - PMC - PubMed
-
- Aiche Stephan, Sachsenberg Timo, Kenar Erhan, Walzer Mathias, Wiswedel Bernd, Kristl Theresa, Boyles Matthew, et al. 2015. “Workflows for Automated Downstream Data Analysis and Visualization in Large-Scale Computational Mass Spectrometry.” Proteomics 15 (8): 1443–47. 10.1002/pmic.201400391. - DOI - PMC - PubMed
-
- Arganda-Carreras Ignacio, Kaynig Verena, Rueden Curtis, Eliceiri Kevin W, Johannes Schindelin, Cardona Albert, and Seung H Sebastian. 2017. “Trainable Weka Segmentation: A Machine Learning Tool for Microscopy Pixel Classification.” Bioinformatics 33 (15): 2424–26. 10.1093/bioinformatics/btx180. - DOI - PubMed
-
- Egloff Arnold, Shanna A, Liping Du, Holli A Loomans Alina Starchenko, Su Pei-Fang, Ketova Tatiana, Knoll Paul B, et al. 2017. “Shed Urinary ALCAM Is an Independent Prognostic Biomarker of Three-Year Overall Survival after Cystectomy in Patients with Bladder Cancer.” Oncotarget 8 (1): 722–41. 10.18632/oncotarget.13546. - DOI - PMC - PubMed
Associated data
Grants and funding
LinkOut - more resources
Full Text Sources