Review
. 2020 Sep 8:74:39-63.
doi: 10.1146/annurev-micro-020518-115628.

Ape Origins of Human Malaria

Affiliations
Review

Ape Origins of Human Malaria

Paul M Sharp et al. Annu Rev Microbiol. .

Abstract

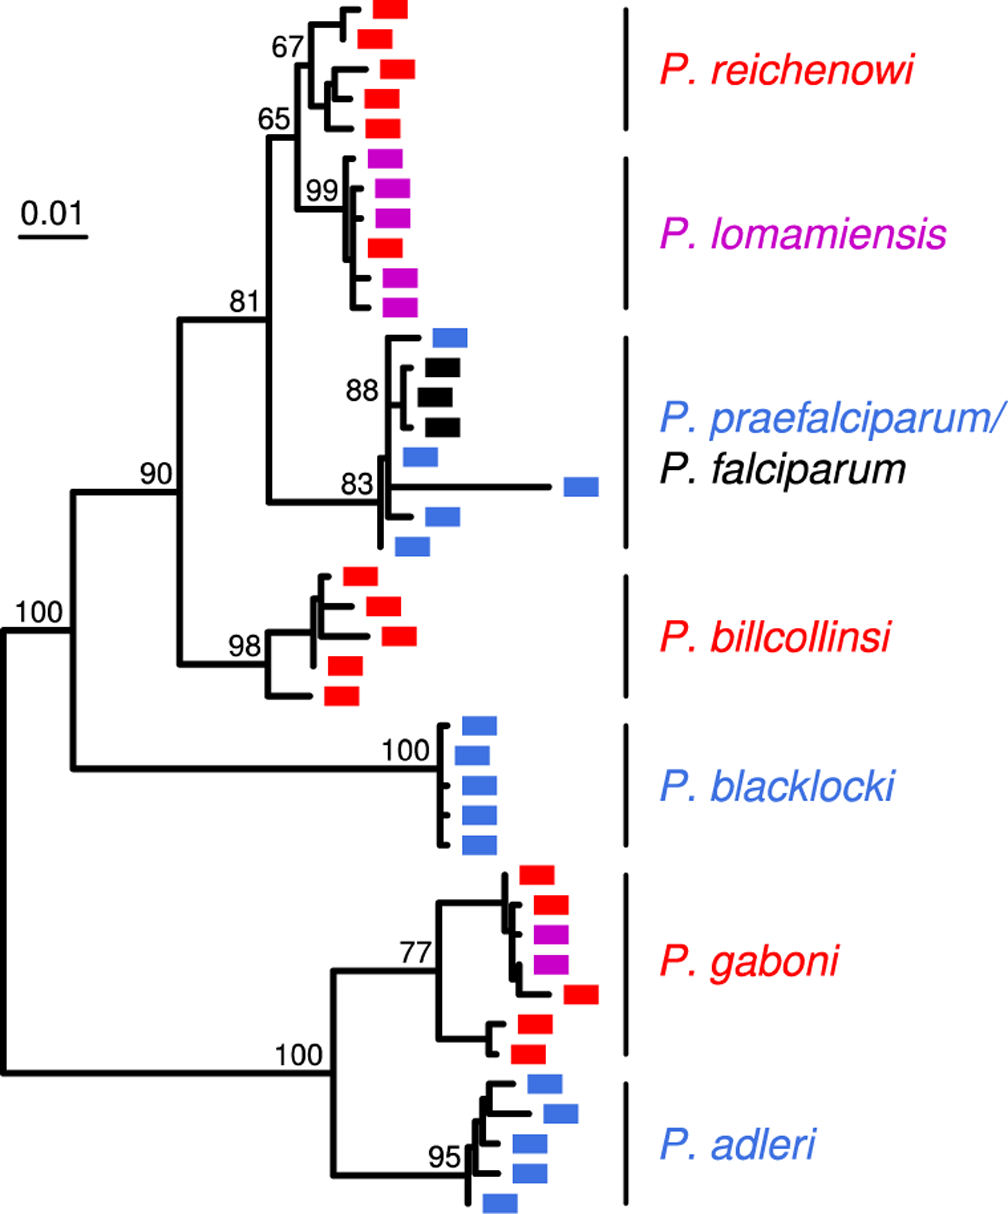
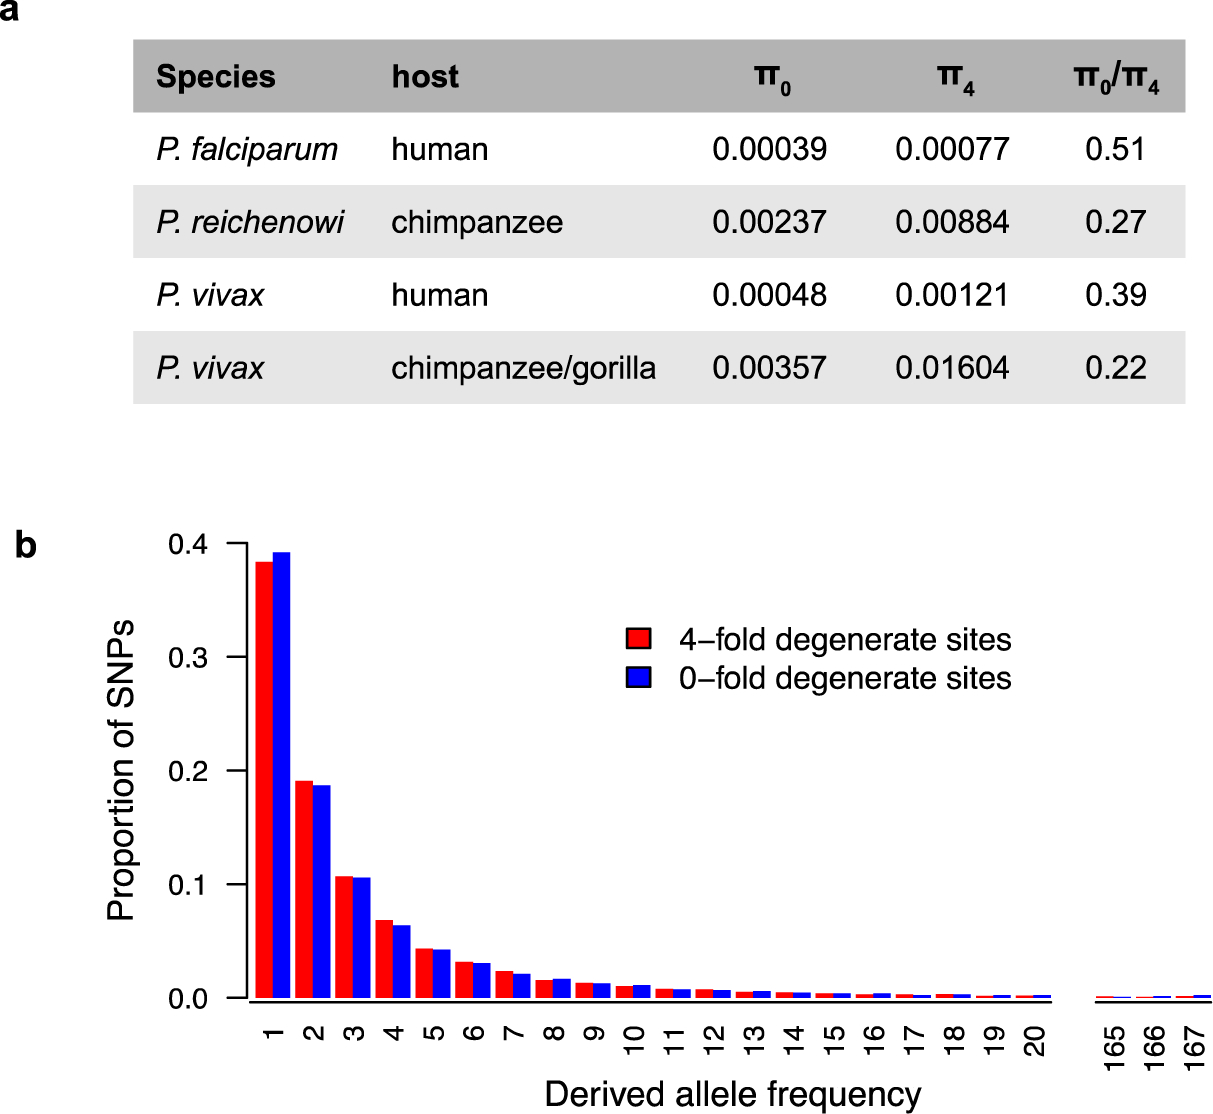
African apes harbor at least twelve Plasmodium species, some of which have been a source of human infection. It is now well established that Plasmodium falciparum emerged following the transmission of a gorilla parasite, perhaps within the last 10,000 years, while Plasmodium vivax emerged earlier from a parasite lineage that infected humans and apes in Africa before the Duffy-negative mutation eliminated the parasite from humans there. Compared to their ape relatives, both human parasites have greatly reduced genetic diversity and an excess of nonsynonymous mutations, consistent with severe genetic bottlenecks followed by rapid population expansion. A putative new Plasmodium species widespread in chimpanzees, gorillas, and bonobos places the origin of Plasmodium malariae in Africa. Here, we review what is known about the origins and evolutionary history of all human-infective Plasmodium species, the time and circumstances of their emergence, and the diversity, host specificity, and zoonotic potential of their ape counterparts.

Keywords: Plasmodium; chimpanzee; cross species transmission; evolution; gorilla; interspecies gene transfer; malaria.


Figures

Figure 1
Figure 1
Evolutionary relationships of primate and rodent Plasmodium species inferred from whole genome sequences. A maximum-likelihood tree of deduced protein sequences from 1,693 orthologous genes is shown. Two strains of P. praefalciparum are included to illustrate the position of P. falciparum within the radiation of this species. The G03 sequence was obtained by SNP calling of published reads using P. falciparum for reference (97). Human parasites are shown in red, with the zoonotic parasite P. knowlesi indicated by a red asterisk. The tree was rooted using the bird parasites P. gallinaceum and P. relictum as outgroups. Sequence data and gene annotations were derived from published genome assemblies (, , , , , –, –103, 120) and PlasmoDB. All relationships were supported by 100% of bootstrap replicates except for the position of P. cynomolgi. The scale bar indicates amino acid substitutions per site.
Figure 2
Figure 2
Geographic distribution and host association of ape Plasmodium parasites in sub-Saharan Africa. The distribution of (a) Laverania, and (b) P. vivax is shown, as determined by PCR amplification of parasite sequences from blood and fecal samples of captive and wild apes as well as mosquitoes. Field sites are shown in relation to the ranges of the four subspecies of the common chimpanzee (P. t. verus, black, upper left inset; P. t. ellioti, purple; P. t. troglodytes, magenta; P. t. schweinfurthii, blue), Cross River (G. g. diehli, white stripe), western lowland (G. g. gorilla, red stripe), and eastern lowland (G. b. graueri, yellow stripe) gorillas, and bonobos (P. paniscus, orange) (20). Sites where ape malaria was detected are highlighted in yellow, aqua and red indicating that chimpanzees, gorillas or both were infected, respectively. Circles, diamonds, and hexagons identify locations where fecal samples were collected from chimpanzees, gorillas, or both species, respectively. Squares indicate bonobo sites, with black stripes indicating one site where P. lomamiensis was detected in only one of 69 fecal samples (72). Triangles and asterisks denote ape sanctuaries and mosquito collection sites, respectively. At two sites, blood and tissue samples were obtained from injured or deceased chimpanzees habituated to human observers (39, 64). The star denotes the location where a European forester became infected with ape P. vivax (110). Data were compiled from published studies (, , , , , –74, 79, 93, 97, 104, 110).
Figure 3
Figure 3
Evolutionary relationships of Laverania species. A maximum likelihood tree (midpoint rooted) of mitochondrial (cytb) parasite sequences (956 bp) from chimpanzee (red), gorilla (blue), bonobo (purple) and human (black) samples is shown. Sequences were selected from published data (–, , , –73, 94, 124) to illustrate the diversity within each species (percent bootstrap values are shown for inter-species branches). The scale bar indicates nucleotide substitutions per site.
Figure 4
Figure 4
Evidence of gene transfer between Laverania species. (a) A maximum likelihood tree of rh5 gene sequences (827 bp) is shown, indicating a gene transfer from an ancestor of P. adleri to the ancestor of P. praefalciparum (97, 124). P. lomamiensis sequences were obtained by limiting dilution PCR as described (72) (GenBank accession numbers MN175633 – MN175635); other sequences were taken from published data (97, 106, 124). (b) A maximum likelihood tree of fikk9.6 gene sequences (800 bp) indicating an ancient introgression event that involved an ancestor of P. reichenowi and P. lomamiensis and an ancestor of P. billcollinsi (107). Parasite sequences derived from chimpanzee, gorilla, bonobo and human samples are shown in red, blue, purple and black, respectively, except for the P. praefalciparum reference sequence (indicated by asterisk), which is shown in blue for consistency but was obtained from a captive chimpanzee (97). Bootstrap values are shown for inter-species branches. The scale bars indicate nucleotide substitutions per site.
Figure 5
Figure 5
Evolutionary relationships of ape and human P. vivax strains. (a) A phylogenetic network based on pairwise distances of coding sequences from all published ape and selected human P. vivax genomes. Sequences from Gilabert and colleagues (triangles) were used as published (Pvl01) or obtained from sequencing reads following the SNP calling procedure described by the authors (52), with the dominant alleles (by read count) used at heterozygous positions. Other genome-wide ape P. vivax sequences from Loy and colleagues (circles) and human P. vivax sequences (black) from Hupalo and colleagues have been described (61, 75). The network is based on 79,492 nucleotide positions from 280 genes with data included from all samples. Ape P. vivax sequences obtained from chimpanzees in Cameroon, Gabon and Cote d’Ivoire are shown in red (52, 75) and one mosquito-derived genome sequence from Gabon is shown in orange (52). (b) A maximum likelihood tree of partial sequences (405 bp) from one nuclear gene (PVP01_1418300) illustrates an example of human P. vivax falling within the ape P. vivax radiation. The tree is rooted with P. cynomolgi. Human (black), and chimpanzee (red), gorilla (blue) and mosquito (orange) derived ape P. vivax sequences are as in (a), except for the addition of an additional chimpanzee-derived (Pvl06) parasite (52). Parasite sequences were generated from ape blood and fecal samples described (52, 75). Bootstrap values >70% are shown. The scale bars indicate nucleotide substitutions per site.
Figure 6
Figure 6
Excess of nonsynonymous polymorphisms in human versus ape Plasmodium parasites. (a) The mean pairwise diversity at zero-fold (π0) and four-fold (π4) degenerate sites is shown for P. falciparum and P. reichenowi as well as human and ape P. vivax derived from published data (2, 75, 105, 124) Both human parasites have much higher π04 ratios than their ape counterparts, indicating a relative excess of nonsynonymous polymorphisms. (b) Site frequency spectra of polymorphisms at zero-fold degenerate (blue) and four-fold degenerate (red) sites in human P. vivax show almost identical patterns, indicating relaxed selection on nonsynonymous polymorphisms. Data were derived from 197 human P. vivax strains from southeast Asia (105) and processed as described (75).
Figure 7
Figure 7
Evolutionary relationships of ape and human P. malariae parasites. A maximum likelihood tree (midpoint rooted) of published (42, 54, 64, 66, 70, 75, 93) and newly derived (asterisks; GenBank accession numbers MN175636–MN175639) mitochondrial (cytb) sequences (576 bp) from chimpanzee (red), gorilla (blue), bonobo (purple), and mosquito (orange) samples as well as P. brasilianum (grey) and representative human P. malariae (black) strains is shown. The phylogeny depicts three lineages of P. malariae and P malariae-related strains (labelled at the side), one of which (M2) is likely to represent a new species tentatively named P. africanum sp. nov. All human P. malariae sequences fall into the M1 lineage together with P. brasilianum and parasite sequences from some captive apes. In trees of longer (2 kb) mitochondrial (76) and nuclear (120) loci (not shown), parasites from wild chimpanzees and gorillas form a distinct M1-like lineage. It is currently unknown whether wild apes also harbor M1 parasites, and whether M1 and M1-like parasites form two sister clades or one falls into the radiation of the other. Bootstrap values greater than 70% are denoted. The scale bar indicates nucleotide substitutions per site.

References

    1. 2014. Severe malaria. Trop Med Int Health 19 Suppl:7–131. World Health Organ. - PubMed
    1. Malar. Genom. Epidemiol. Netw. 2016. Pf3k pilot data release 5. MalariaGEN https://www.malariagen.net/data/pf3k-5
    1. World Health Organ. 2019. World Malaria Report 2019, Geneva: World Health Organ.
    1. Adler S 1923. Malaria in chimpanzees in Sierra Leone. Annals of Tropical Medicine & Parasitology 17:13–8
    1. Arisue N, Hashimoto T, Kawai S, Honma H, Kume K, Horii T. 2019. Apicoplast phylogeny reveals the position of Plasmodium vivax basal to the Asian primate malaria parasite clade. Sci Rep 9:7274. - PMC - PubMed

Publication types