. 2020 Sep 8;32(10):108119.
doi: 10.1016/j.celrep.2020.108119.

Cholinergic Synaptic Homeostasis Is Tuned by an NFAT-Mediated α7 nAChR-Kv4/Shal Coupled Regulatory System

Affiliations

Cholinergic Synaptic Homeostasis Is Tuned by an NFAT-Mediated α7 nAChR-Kv4/Shal Coupled Regulatory System

Abdunaser Eadaim et al. Cell Rep. .

Abstract

Homeostatic synaptic plasticity (HSP) involves compensatory mechanisms employed by neurons and circuits to preserve signaling when confronted with global changes in activity that may occur during physiological and pathological conditions. Cholinergic neurons, which are especially affected in some pathologies, have recently been shown to exhibit HSP mediated by nicotinic acetylcholine receptors (nAChRs). In Drosophila central neurons, pharmacological blockade of activity induces a homeostatic response mediated by the Drosophila α7 (Dα7) nAChR, which is tuned by a subsequent increase in expression of the voltage-dependent Kv4/Shal channel. Here, we show that an in vivo reduction of cholinergic signaling induces HSP mediated by Dα7 nAChRs, and this upregulation of Dα7 itself is sufficient to trigger transcriptional activation, mediated by nuclear factor of activated T cells (NFAT), of the Kv4/Shal gene, revealing a receptor-ion channel system coupled for homeostatic tuning in cholinergic neurons.

Keywords: Drosophila; K(v)4; NACHO; NFAT; Shal; activity-dependent; cholinergic signaling; homeostatic synaptic plasticity; synaptic homeostasis; α7 nAChR.


Conflict of interest statement

Declaration of Interests The authors declare no competing interests.

Figures
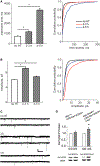
Figure 1.
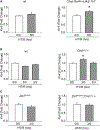
Figure 1.. Inhibition of Cholinergic Activity in Chats2/+ Neurons Induces a Homeostatic Increase in mEPSC Amplitudes and Dα7 Protein
(A–C) Chats2/+ primary cultures 8 DIV, grown at 18ºC, were heat treated (HT) at 30ºC for indicated times before mEPSCs were recorded. Comparisons are shown of mEPSC inter-event time (A) and amplitude (B) between Chats2/+ cultures without HT and Chats2/+ cultures with HT for indicated times. Note that mEPSCs from Chats2/+ neurons show progressively decreased activity with significantly enhanced inter-event times with increasing HT (no HT, 750.19 ± 57.42 ms; 2/3 h HT, 1192.85 ± 76.34 ms; 4/5 h HT, 3364.76 ± 195.26 ms; N = 7–8 cells), and consequently, homeostatically enhanced amplitudes (no HT, 6.12 ± 0.05 pA; 2/3 h HT, 9.26 ± 0.19 pA; 4/5 h HT, 6.95 ± 0.16 pA; N = 7–8 cells). (C) Representative traces showing synaptic activity from Chats2/+ control and experimental cells. Scale bars, 500 ms/5 pA. (D) Quantification and representative immunoblots of elav-Gal4>>UAS-Dα7-EGFP/+ and elav-Gal4>>UAS-Dα7-EGFP/Chats2 flies grown at 18ºC, then subjected to 0 or 3 h HT and 3 h recovery at 18ºC (0/0 or 3/3, respectively). All immunoblots were run with five heads per sample per lane. Anti-GFP band intensities were normalized to those of anti-actin, which were used as a loading control; for each condition. N = 24–46 samples per condition. All data are presented as mean ± SEM; *p < 0.05, Student’s t test.
Figure 2.
Figure 2.. Dα7 nAChRs Are Localized to Somato-Dendritic and Axonal Compartments
Representative images showing Dα7-EGFP localization when UAS-Dα7-EGFP is driven by GH146-Gal4 (A and B) or 201Y-Gal4 (C and D). DsRed and EGFP signals were enhanced with antibody labeling and are shown in magenta and green, respectively, in (B) and (D). (A) Z-projection of confocal sections of the left side of an GH146-Gal4>> UAS-DsRed adult fly brain, showing the anatomy of the projection neurons (PNs; midline is right of image). Scale bar, 20 μm. (B) Top: Z-projection of three confocal sections spanning 1 μm showing DsRed labeling of the PN cell bodies (CBs) (CB and arrows indicate an example cluster) and antennal lobe (AL) with example glomeruli indicated (arrowhead). Dα7-EGFP is clearly observed in PN CBs and in the glomeruli of the AL (center). Scale bar, 20 μm. Inset: a magnified view of the boxed region demonstrating membrane localization of Dα7-EGFP in CBs (scale bar, 5 μm). Bottom: Z-projection of three confocal sections spanning 1.5 μm showing DsRed (left) and Dα7-EGFP (center) localization on proximal axonal regions of the iACT (arrowhead) and mACT (arrow). Scale bar, 10 μm. (C) 3D rendering of GFP signal in 201Y-Gal4>>UAS-mCD8-GFP adult brains, demonstrating cellular compartments of the mushroom body. The blue plane indicates the approximate location of the cross-section shown in bottom row of (D). Image is rotated as indicated by the axes. m, medial; a, anterior; v, ventral. (D) Top: Z-projection of three confocal sections spanning 3 μm through the CBs and calyx (CX) of the mushroom body (left). Dα7-EGFP is observed on CBs and within the neuropil of the CX (center). Scale bar, 20 μm. Inset: a magnified view of the boxed region demonstrating membrane localization of Dα7-EGFP in CBs (scale bar, 5 μm). Bottom: Single confocal cross-section of the peduncle (PED) showing DsRed (left) and Dα7-EGFP (center) localization on these axonal structures of the mushroom body. Scale bar, 10 μm. The “despeckle” median noise filter in ImageJ was applied to all images shown from the GFP channel.
Figure 3.
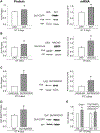
Figure 3.. Blocking Neural Activity In Vivo Results in an Upregulation of Kv4/Shal Protein
(A–D) Quantification of relative Kv4/Shal protein levels and representative immunoblots from Chats2/+ (A and C), wild type (WT; B), and Chats3/+ (D) after HT protocols, indicated as hours of HT at 37ºC/h of recovery at 18ºC (e.g., 3/3, 6/3; 0/0 indicates flies kept at 18ºC with no HT). Note that 3–6 h HT of Chats2/+ induces an increase in Kv4/Shal protein. (E) Quantification of relative Kv4/Shal protein levels and representative immunoblots from ChaT-Gal4/tub-Gal80ts>>UAS-TnT flies after indicated HT shows a similar increase in Kv4/Shal levels after 6 h HT. (F) Quantification and representative immunoblots of Dα7PΔEY6;; Chats2/+, and Dα7PΔEY6 samples after indicated HT protocols show no significant change in Kv4/Shal in the absence of Dα7. All immunoblots were run with 5 male heads per lane; for each condition, number of samples (N) = 15–46. Anti-Kv4/Shal band intensities were normalized to those of anti-syntaxin (syn), which was used as a loading control. Data are presented as mean ± SEM; *p < 0.05, Student’s t test.
Figure 4.
Figure 4.. Inhibition of Cholinergic Activity in Chats2/+ Neurons Induces an Increase in Kv4/Shal Current Density
Primary cultures from genetic background controls (Ctrl) and Chats2/+ mutants (Chats) were grown at 18ºC for 8 DIV, then either not HT (−HT) or HT for 6 h at 30ºC (+HT) followed by 2–3 h recovery at 18ºC. Kv4/Shal currents were separated from delayed rectifier currents as described in the text. Peak Kv4/Shal current densities were significantly increased in +HT Chats2/+ mutants compared to -HT Chats2/+ mutants or −HT and +HT controls (Ctrl−HT, 18.18 ± 3.15 pA/pF, N = 7; Ctrl+HT, 18.88 ± 3.93 pA/pF, N = 8; Chats−HT, 21.26 ± 3.59 pA/pF, N = 14; Chats+HT, 35.60 ± 5.99 pA/pF, N = 6). Data are presented as mean ± SEM; *p < 0.05, Student’s t test. Scale bars, 100 pA/10 ms.
Figure 5.
Figure 5.. Blocking Neural Activity In Vivo Induces an Increase in Kv4/Shal mRNA, and This Increase Is Dependent on Dα7 nAChRs
qRT-PCR analyses of Kv4/Shal mRNA levels normalized to reference gene expression, expressed as “fold-change” (see Method Details for analyses and calculation). (A) Comparison of WT and Chat-Gal4>>UAS-TnT male flies subjected to HT at 30ºC and recovery (HT/R; hours at 30ºC/h of recovery at 18ºC) protocols, as indicated. Note that 0/0 indicates no HT. (B) Comparison of WT and Chats2/+ flies subjected to HT/R protocols, as indicated. (C) Comparisons of Dα7PΔEY6 null mutants and Dα7PΔEY6;; Chats2/+ flies subjected to HT/R, as indicated. Data are presented as mean fold-change ± SEM (means are from N = 10–17 independent RNA extraction and qRT-PCR); note that fold-changes are calculated in comparison to the corresponding 0/0 condition shown. *p < 0.05, Student’s t test.
Figure 6.
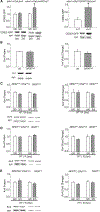
Figure 6.. Increase in Dα7-EGFP and/or NACHO Is Sufficient to Induce an Increase in Kv4/Shal Protein and mRNA
(A–D) Representative immunoblots and quantitative analyses of steady-state protein levels (left) and digital droplet PCR (ddPCR) analyses (right) of samples from (A) UAS-Dα7-EGFP/+ (UAS) and elav-Gal4;tub-Gal80ts>> UAS-Dα7-EGFP/+ (Dα7), (B) UAS-NACHO-3xHA (UAS) and elav-Gal4;tub-Gal80ts>>UAS-NACHO-3xHA (NACHO), (C) UAS-Dα7-EGFP/UAS-NACHO-3xHA (UAS/UAS) and elav-Gal4;tub-Gal80ts>>UAS-Dα7-EGFP/UAS-NACHO-3xHA (Dα7/NACHO), and (D) elav-Gal4;-tub-Gal80ts>>UAS-Dα7-EGFP/UAS-NACHO-3xHA (Dα7/NACHO) and elav-Gal4;tub-Gal80ts>>UAS-Dα7-EGFP/UAS-NACHO-3xHA (Dα7/NACHO). All fly lines were grown at 18ºC, allowing them to develop normally, then subjected to HT at 30ºC for the indicated times. All immunoblots (left) were run with five male heads per lane. Anti-Kv4/Shal or anti-GFP band intensities were normalized to those of anti-syntaxin (syn), which was used as a loading control. Experimental means were then normalized to similarly treated genetic background control (UAS) means on the same immunoblots; for each condition, N = 17–23, data are represented as mean ± SEM; *p < 0.05, Student’s t test. For ddPCR (right), data are presented as mean copy number per ng cDNA ± SEM (means are from N = 10–21 independent RNA extractions and RTs), normalized to mean copy number/ng cDNA from similarly treated genetic background control (UAS) values. (E) Representative immunoblots and quantitative analyses of steady-state Kv4/Shal protein levels from heads of Chat-Gal4/UAS-Dcr2>>UAS-NACHO-RNAi/Chats2 (right; Chat-Gal4>>UAS-NACHO-RNAi/Chats2) flies grown at 18ºC, then either not HT (0/0) or subjected to HT at 30ºC for 3 h followed by recovery at 18ºC for another 3 h (3/3). Immunoblot analyses are as described for (A)–(D); N = 15. Note that no significant increase in Kv4/Shal is observed when expression of NACHO is inhibited, in contrast to samples from similarly treated Chats2/+ flies (left; data here are the same as shown in Figure 3). *p < 0.05, Student’s t test.
Figure 7.
Figure 7.. NFAT Is Required for the Chats2-Induced Increase in Kv4/Shal Protein and mRNA
(A) Left: representative immunoblots and quantitative analyses for CD8/CD2-GFP expression in elav-Gal4>>LexAop-CD8-GFP/+;UAS-mLexA-VP16-NFAT,LexAop-CD2-GFP/+ (elav>>CaLexA) and elav-Gal4>>LexAop-CD8-GFP/+;UAS-mLexA-VP16-NFAT,LexAop-CD2-GFP/Chats2 (elav>>CaLexA/Chats2) flies subjected to 0/0 and 3/0 HT protocols (HT/R; hours at 30ºC/h of recovery at 18ºC), as indicated. Anti-GFP signals were normalized to anti-syntaxin (syn) signals as a loading control, then normalized to control (0/0) samples on the same immunoblots; N = 11–12 samples for elav>>CaLexA, N = 18 for elav>>CaLexA/Chats2. Note that the CD8/2-GFP levels responding to activation of the CaLexA reporter are elevated with HT of Chats2. Right: representative immunoblots and quantitative analyses for CD8/CD2-GFP expression in heads from elav-Gal4;tub-GAL80ts>>UAS-mLexA-VP16-NFAT,LexAop-CD2-GFP/UAS-Dα7-EGFP; LexAop-CD8-GFP/+ flies were grown at 18ºC, then either not HT (−HT) or HT at 30ºC for 24 h (+HT). Quantification of GFP, normalized to anti-syntaxin, was performed as described above; N = 12–14 samples. Data are presented as mean +/− SEM. Note that the CD8/2-GFP levels responding to activation of the CaLexA reporter are elevated with HT to induce overexpression of Dα7-EGFP. (B–E) Shown are representative immunoblots and quantitative analysis of relative Kv4/Shal protein levels (left) and qRT-PCR analyses for Kv4/Shal mRNA, expressed as fold-change (right) comparing (B) WT and NFATΔab mutants and (C) NFATΔab mutants and NFATΔab;;Chats2/+, (D) NFATΔa and NFATΔa;;Chats2/+, and (E) NFATΔb and NFATΔb;;Chats2/+ lines, subjected to HT/R (hours at 30ºC/h of recovery at 18ºC) protocols, as indicated. All immunoblots were run with five heads per lane. Anti-Kv4/Shal or anti-GFP band intensities were normalized to those of anti-syntaxin (syn), which was used as a loading control; for each condition; N = 15–25; data are represented as mean ± SEM For qRT-PCR, data are presented as mean fold-change ± SEM (means are from N = 9–14 independent RNA extraction and qRT-PCR); note that fold-changes are calculated in comparison to the corresponding 0/0 condition shown. *p < 0.05, Student’s t test.

References

    1. Albuquerque EX, Pereira EF, Alkondon M, and Rogers SW (2009). Mammalian nicotinic acetylcholine receptors: from structure to function. Physiol. Rev 89, 73–120. - PMC - PubMed
    1. Amberg GC, Rossow CF, Navedo MF, and Santana LF (2004). NFATc3 regulates Kv2.1 expression in arterial smooth muscle. J. Biol. Chem 279, 47326–47334. - PubMed
    1. Bischof J, Björklund M, Furger E, Schertel C, Taipale J, and Basler K (2013). A versatile platform for creating a comprehensive UAS-ORFeome library in Drosophila. Development 140, 2434–2442. - PubMed
    1. Chen X, Yuan LL, Zhao C, Birnbaum SG, Frick A, Jung WE, Schwarz TL, Sweatt JD, and Johnston D (2006). Deletion of Kv4.2 gene eliminates dendritic A-type K+ current and enhances induction of long-term potentiation in hippocampal CA1 pyramidal neurons. J. Neurosci 26, 12143–12151. - PMC - PubMed
    1. Daubert EA, and Condron BG (2007). A solid-phase immunostaining protocol for high-resolution imaging of delicate structures in the Drosophila larval central nervous system (CNS). CSH Protoc. 2007, pdb.prot4771. - PubMed

Publication types

MeSH terms

Substances