. 2020 Sep 8;32(10):108105.
doi: 10.1016/j.celrep.2020.108105.

Hypoxia Triggers the Intravasation of Clustered Circulating Tumor Cells

Affiliations

Hypoxia Triggers the Intravasation of Clustered Circulating Tumor Cells

Cinzia Donato et al. Cell Rep. .

Abstract

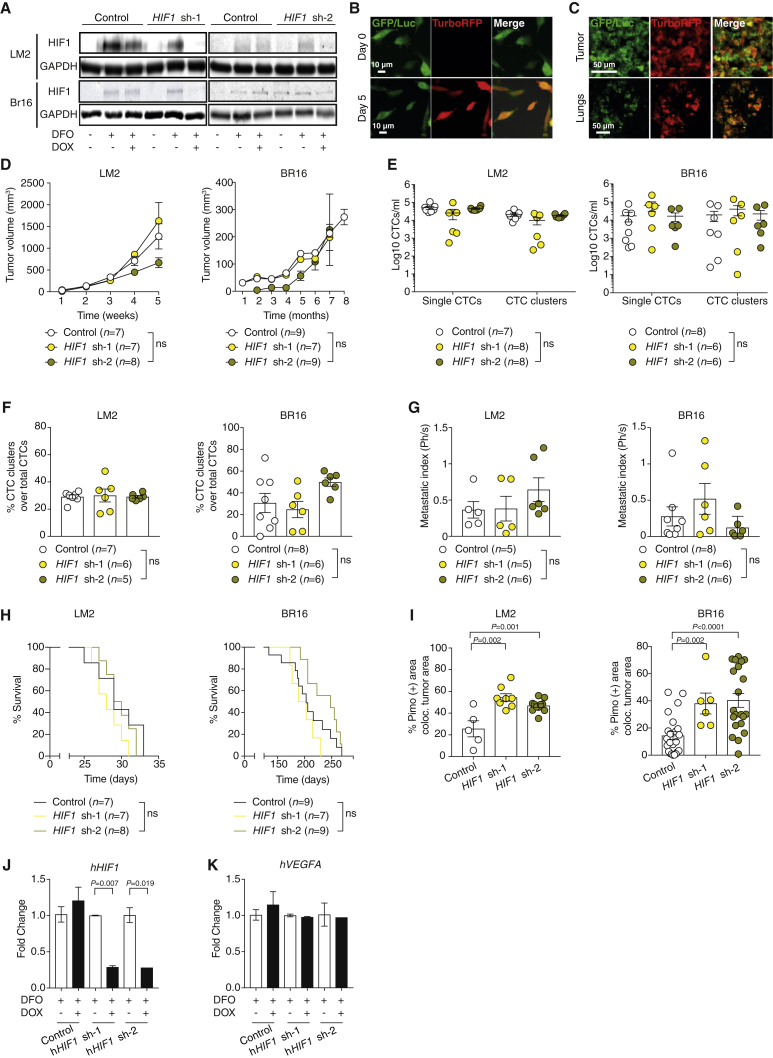
Circulating tumor cells (CTCs) are shed from solid cancers in the form of single or clustered cells, and the latter display an extraordinary ability to initiate metastasis. Yet, the biological phenomena that trigger the shedding of CTC clusters from a primary cancerous lesion are poorly understood. Here, when dynamically labeling breast cancer cells along cancer progression, we observe that the majority of CTC clusters are undergoing hypoxia, while single CTCs are largely normoxic. Strikingly, we find that vascular endothelial growth factor (VEGF) targeting leads to primary tumor shrinkage, but it increases intra-tumor hypoxia, resulting in a higher CTC cluster shedding rate and metastasis formation. Conversely, pro-angiogenic treatment increases primary tumor size, yet it dramatically suppresses the formation of CTC clusters and metastasis. Thus, intra-tumor hypoxia leads to the formation of clustered CTCs with high metastatic ability, and a pro-angiogenic therapy suppresses metastasis formation through prevention of CTC cluster generation.


Conflict of interest statement

Declaration of Interests N.A. and C.D. are listed as inventors in patent application EP 19188215.8, “Angiogenesis promoting agents for prevention of metastatic cancer.” N.A. is a paid consultant for companies with an interest in liquid biopsy.

Figures

None
Graphical abstract
Figure 1
Figure 1
Dynamic Labeling and Assessment of Intra-Tumor Hypoxia (A) Schematic representation of the HIF1α reporter. (B) Schematic of the experimental design. (C) Representative pictures of breast tumors displaying a hypoxic core (left) or scattered hypoxic areas (right). (D) The plot shows the percentage of core versus scattered hypoxic areas in LM2, BR16, and 4T1 tumor models. (E) Schematic of the experimental design. (F) The plot shows the percentage of CD31-positive (+) cells within the normoxic and the hypoxic tumor areas of NSG-BR16-HIF1α reporter mice, defined HIF1α reporter (eYFP; n = 4), pimonidazole staining (Pimo; n = 4), or the lack of both (normoxia; n = 5). (G) The plot shows the distribution in percentage of functional vessels within the hypoxic tumor areas of NSG-BR16-HIF1α reporter mice, defined by HIF1α reporter (eYFP; n = 4) or Pimo staining (n = 4). (H) Representative images of NSG-BR16-HIF1α reporter tumors stained for human cytokeratin (hCK), eYFP, CD31, and Dextran (Dex) (left) or with hCK, Pimo, CD31, and Dex (right). White triangles highlight Dex-positive vessels. (I) The plot shows the density in percentage of functional blood vessels in normoxic (n = 7), eYFP (n = 4), or Pimo-stained (n = 4) areas of NSG-BR16-HIF1α reporter tumors. (J) Representative images of NSG-BR16-HIF1α reporter tumors stained for hCK, eYFP, CD31, and Dex and showing intravasating eYFP−(+) CTC cluster (left), intravasating eYFP−(+) single CTC (middle), and intravasated eYFP−(−) single CTC (right). White triangles highlight the intravasation sites. For all panels, the error bars represent the SEM. See also Figures S1 and S2.
Figure 2
Figure 2
Dynamic Labeling of Hypoxic CTCs and Assessment of Their Metastatic Potential (A) Representative pictures of CTC clusters (top) and single CTCs (bottom) from NSG-LM2-HIF1α reporter mice, positive (+) or negative (−) for eYFP expression. (B) The plot shows the mean percentage of eYFP−(+) single CTCs (n = 3) and CTC clusters (n = 3) from NSG-LM2-HIF1α reporter mice. Error bars represent SEM; p value by two-tailed unpaired Student’s t test is shown. (C) Schematic of the experimental design. (D) Kaplan-Meier survival analysis of NSG mice injected with eYFP−(+) (n = 4) or eYFP−(−) (n = 3) CTC clusters or single CTCs. p value by log-rank test is shown. See also Figures S3 and S4.
Figure 3
Figure 3
Hypoxic CTC Clusters Express a Gene Signature That Is Associated with a Poor Prognosis in Breast Cancer Patients (A) Schematic of the experimental design. (B) Representative pictures of CTC clusters from NSG-LM2-GFP/Luc, NSG-BR16 xenografts, and BR61 patient stained with HypoxiaRed and processed for RNA sequencing. The apparent cut in the HypoxiaRed-positive CTC cluster is due to the positioning of the CTC cluster relative to the pinhole. (C) Heatmap showing differentially expressed genes between hypoxic (n = 14) and normoxic (n = 17) CTC clusters from NSG-LM2, NSG-BR16, and BR61 (FDR < 0.25). (D) Density plot showing the distribution of CTC clusters and single CTCs from the GSE109761 dataset (n = 13 breast cancer patients) according to the expression of the hypoxic cluster signature. p value by one-tailed Student t test is shown. (E) Overall survival rate of stage I breast cancer patients expressing in their primary tumor high (quantile 4, Q4) or low (quantile 1, Q1) levels of genes upregulated in hypoxic CTC clusters (top). The number of patients that progressed at each time point is shown (bottom). p value by log-rank test is shown. (F) Distant metastasis-free survival rate of breast cancer patients expressing in their primary tumor high (Q4) or low (Q1) levels of genes upregulated in hypoxic CTC clusters (top). The number of patients that progressed at each time point is shown (bottom). p value by log-rank test is shown. See also Figure S5 and Tables S1, S2, and S3.
Figure 4
Figure 4
Hypoxic Tumor Cells Upregulate Cell-Cell Adhesion Proteins In Vivo (A) Schematic of the experimental design. (B) Volcano plot showing all the proteins detected with mass spectrometry analysis (q ≤ 0.1). (C) Gene ontology (GO) analysis of molecular function pathways upregulated in hypoxic tumor cells and ranked by adjusted p value. (D) GO analysis of molecular function pathways upregulated in normoxic tumor cells and ranked by adjusted p value. (E) Heatmap showing the expression levels of the top 20 upregulated proteins belonging to the GO terms enriched in hypoxic tumor cells. Ranking is based on q value. (F) Representative pictures showing Pimo and human NDRG1 staining from LM2-HIF1α reporter tumor. (G) Representative western blot shows NDRG1 protein in LM2-mCherry/Luc cells induced with either DFO or hypoxia (0.1% O2). (H) Representative western blot shows hNDRG1 protein in LM2-mCherry/Luc cells expressing a control shRNA (control), NDRG1 shRNA-1, or NDRG1 shRNA-2 (sh-1 and sh-2). (I) The plot shows the mean tumor volume of NSG mice injected with LM2-mCherry/Luc expressing a control shRNA, NDRG1 sh-1, or sh-2. p values by two-tailed unpaired Student’s t test are shown. (J) The plot shows the mean percentage of CD31−(+) cells within the primary tumor of LM2-mCherry/Luc mice expressing a control shRNA or NDRG1 knockdown (n = 4). p values by two-tailed unpaired Student’s t test are shown. (K) The plots show the mean percentage of Pimo−(+) cells colocalizing with primary tumor cells of LM2-mCherry/Luc mice expressing a control shRNA or NDRG1 knockdown (n = 4). p values by two-tailed unpaired Student’s t test are shown. (L) Pie charts displaying the mean percentage of single CTCs and CTC clusters in LM2-mCherry/Luc mice expressing a control shRNA or NDRG1 knockdown. For all panels, the number of independent biological replicates (n) is shown, and the error bars represent SEM. See also Figure S5 and Tables S4 and S5.
Figure 5
Figure 5
Knockdown of HIF1α Does Not Affect CTC Cluster or Metastasis Formation (A) Representative western blot shows the human HIF1α protein in LM2-GFP/Luc (top) and BR16-GFP/Luc (bottom) cells expressing a control shRNA (control), hHIF1α shRNA-1, or hHIF1α shRNA-2 (sh-1 and sh-2). (B) Representative pictures showing LM2-GFP/Luc cells upon knockdown. (C) Representative pictures showing tumor (top) and metastatic lungs (bottom) of NSG-LM2-GFP/Luc mice expressing HIF1α shRNAs. (D) The plots show the mean tumor volume of NSG mice injected with LM2-GFP/Luc (left) or BR16-GFP/Luc (right) and expressing a control shRNA or HIF1α knockdown. p values by two-tailed unpaired Student’s t test are shown. (E) Plots showing the log10 of total CTC counts per ml of blood obtained from NSG-LM2-GFP/Luc (left) or NSG-BR16-GFP/Luc (right) mice expressing a control shRNA or HIF1α knockdown. p values by two-way ANOVA are shown. (F) The plots show the percentage of CTC clusters from NSG-LM2-GFP/Luc (left) or NSG-BR16-GFP/Luc (right) mice expressing a control shRNA or HIF1α knockdown. p values by two-tailed unpaired Student’s t test are shown. (G) The plot shows the metastatic index of NSG-LM2-GFP/Luc (left) or NSG-BR16-GFP/Luc (right) mice expressing a control shRNA or HIF1α knockdown. p values by two-tailed unpaired Student’s t test are shown. (H) Overall survival rates of NSG-LM2-GFP/Luc (left) or NSG-BR16-GFP/Luc (right) mice expressing a control shRNA or HIF1α knockdown. p value by two-sided log-rank test is shown. (I) The plot shows the mean percentage of Pimo−(+) cells colocalizing with the primary tumor cells of NSG-LM2-GFP/Luc (left) or NSG-BR16-GFP/Luc (right) mice expressing a control shRNA control (n = 5 and n = 23) or HIF1α knockdown (sh-1, n = 8 and n = 6; sh-2, n = 11 and n = 21). p values by two-tailed unpaired Student’s t test are shown. (J) Plot showing HIF1α mRNA expression levels upon HIF1α knockdown (n = 2). p values by two-tailed unpaired Student’s t test are shown. (K) Plot showing hVEGFA mRNA expression levels upon HIF1α knockdown (n = 2). For all panels, the number of independent biological replicates (n) is shown, and the error bars represent SEM.
Figure 6
Figure 6
VEGFA Targeting Increases CTC Cluster Shedding and Metastasis Formation (A) The plot shows the mean tumor volume of NSG mice injected with LM2-mCherry/Luc cells and expressing a control shRNA (control) or hVEGFA shRNAs (hVEGFA sh-1 and sh-2) (n = 7). p values by two-tailed paired Student’s t test are shown. (B) The plot shows the mean percentage of CD31-positive (+) cells within the primary tumor of NSG-LM2 mice expressing a control or VEGFA knockdown (n = 6 in control and sh-2; n = 4 in sh-1). p values by two-tailed unpaired Student’s t test are shown. (C) The plot shows the mean percentage of Pimo−(+) cells colocalizing with primary tumor cells of NSG-LM2 mice expressing a control or VEGFA knockdown (n = 3). p values by two-tailed unpaired Student’s t test are shown. (D) Plot showing the log10 of total CTC counts per ml of blood in NSG-LM2 mice expressing a control or VEGFA knockdown. p values by two-way ANOVA are shown. (E) Pie charts displaying the mean percentage of single CTCs and CTC clusters in NSG-LM2 mice expressing a control or VEGFA knockdown. (F) The plot shows the mean fold change of CTC ratios in NSG-LM2 mice expressing a control or VEGFA knockdown. p values by two-way ANOVA are shown. (G) The plot shows the metastatic index of NSG-LM2 control (n = 7), NSG-LM2-hVEGFA sh-1 (n = 9), and sh-2 (n = 8) mice. p values by two-tailed unpaired Student’s t test are shown. (H) Representative bioluminescence images of lungs from NSG-LM2 mice expressing a control or VEGFA knockdown. (I) The plot shows the mean tumor volume of NSG mice injected with LM2-mCherry/Luc cells and treated with isotype control (n = 4) or bevacizumab 25 mg/Kg (n = 5). p values by two-tailed unpaired Student’s t test are shown. (J) The plot shows the mean percentage of CD31−(+) cells within the primary tumor of NSG-LM2 mice treated with control or bevacizumab (n = 4). p values by two-tailed unpaired Student’s t test are shown. (K) The plot shows the mean percentage of Pimo−(+) cells colocalizing with primary tumor cells of NSG-LM2-mCherry/Luc mice treated with control or bevacizumab (n = 5). p values by two-tailed unpaired Student’s t test are shown. (L) Plot showing the log10 of total CTC counts per ml of blood in NSG-LM2-mCherry/Luc treated with control or bevacizumab. p values by two-way ANOVA are shown. (M) Pie charts displaying the mean percentage of single CTCs and CTC clusters in NSG-LM2-mCherry/Luc treated with control or bevacizumab. (N) The plot shows the mean fold change of CTC ratios in NSG-LM2 treated with control or bevacizumab. p values by two-way ANOVA are shown. (O) The plot shows the metastatic index of NSG-LM2 treated with control (n = 4) or bevacizumab (n = 2). p values by two-tailed unpaired Student’s t test are shown. (P) Representative bioluminescence images of lungs from NSG-LM2 mice treated with control or bevacizumab. For all panels, the number of independent biological replicates (n) is shown, and the error bars represent SEM. See also Figure S6.
Figure 7
Figure 7
Pro-Angiogenic Therapy Reduces Intra-Tumor Hypoxia and Suppresses the Formation of CTC Clusters and Metastasis (A) Schematic of the experimental design. (B) The plot shows the mean tumor volume of NSG mice injected with LM2-mCherry/Luc cells expressing mVIC (mVIC) or control CD8aTr (mC), treated with either control FC fragments (FC) or EphrinB2 (EpB2). p values by two-tailed unpaired Student’s t test are shown. (C) Pie charts displaying the mean percentage of single CTCs and CTC clusters in NSG -LM2-mVIC or NSG-LM2-mC, treated with either FC or EpB2. (D) The plot shows the mean fold change of CTC ratios in NSG-LM2-mVIC and NSG-LM2-mC, treated with FC or EpB2. p values by two-way ANOVA are shown. (E) The plot shows the metastatic index of NSG-LM2-mVIC or NSG-LM2-mC mice, treated with FC or EpB2. p values by two-tailed unpaired Student’s t test are shown. (F) Representative bioluminescence images of metastatic lungs from NSG-LM2-mVIC or NSG-LM2-mC mice, treated with FC (top) or EpB2 (bottom). (G) The plot shows the mean tumor volume of NSG-BR16-mCherry/Luc mice treated with FC (n = 5) or EpB2 (n = 5). p values by two-tailed unpaired Student’s t test are shown. (H) Pie charts displaying the mean percentage of single CTCs and CTC clusters in NSG-BR16-mCherry/Luc mice treated with FC or EpB2. (I) The plot shows mean fold change of CTC ratios in NSG-BR16-mCherry/Luc treated with FC (n = 5) or EpB2 (n = 5). p values by two-tailed unpaired Student’s t test are shown. (J) The plot shows the metastatic index of NSG-BR16-mCherry/Luc mice treated with FC (n = 3) or EpB2 (n = 6). p values by two-tailed unpaired Student’s t test are shown. (K) Representative bioluminescence images of metastatic lungs from NSG-BR16-mCherry/Luc treated with FC (left) or EpB2 (right). (L) Schematic of the experimental design. (M) Overall survival rates of NSG-LM2-mVIC mice treated with paclitaxel, EpB2, or both. p value by two-sided log-rank test is shown. For all panels, the number of independent biological replicates (n) is shown, and the error bars represent SEM. See also Figure S7.

References

    1. Aceto N., Bardia A., Miyamoto D.T., Donaldson M.C., Wittner B.S., Spencer J.A., Yu M., Pely A., Engstrom A., Zhu H. Circulating tumor cell clusters are oligoclonal precursors of breast cancer metastasis. Cell. 2014;158:1110–1122. - PMC - PubMed
    1. Aceto N., Toner M., Maheswaran S., Haber D.A. En Route to Metastasis: Circulating Tumor Cell Clusters and Epithelial-to-Mesenchymal Transition. Trends Cancer. 2015;1:44–52. - PubMed
    1. Alix-Panabières C., Pantel K. Challenges in circulating tumour cell research. Nat. Rev. Cancer. 2014;14:623–631. - PubMed
    1. Baba Y., Nosho K., Shima K., Irahara N., Chan A.T., Meyerhardt J.A., Chung D.C., Giovannucci E.L., Fuchs C.S., Ogino S. HIF1A overexpression is associated with poor prognosis in a cohort of 731 colorectal cancers. Am. J. Pathol. 2010;176:2292–2301. - PMC - PubMed
    1. Bos P.D., Zhang X.H., Nadal C., Shu W., Gomis R.R., Nguyen D.X., Minn A.J., van de Vijver M.J., Gerald W.L., Foekens J.A., Massagué J. Genes that mediate breast cancer metastasis to the brain. Nature. 2009;459:1005–1009. - PMC - PubMed

Publication types