

Secondary Sclerosing Cholangitis in Critically Ill Patients Alters the Gut-Liver Axis: A Case Control Study
- PMID: 32906634
- PMCID: PMC7551864
- DOI: 10.3390/nu12092728
Secondary Sclerosing Cholangitis in Critically Ill Patients Alters the Gut-Liver Axis: A Case Control Study
Abstract
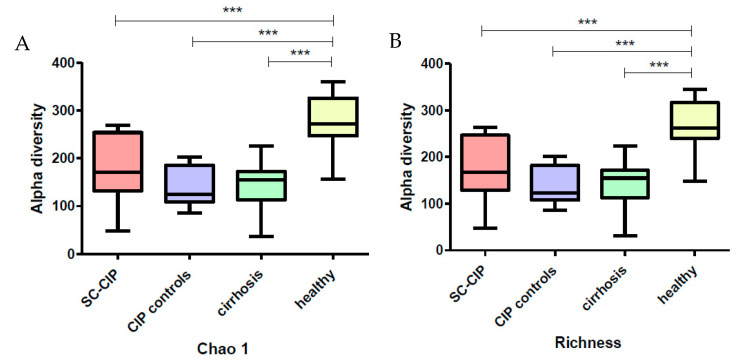
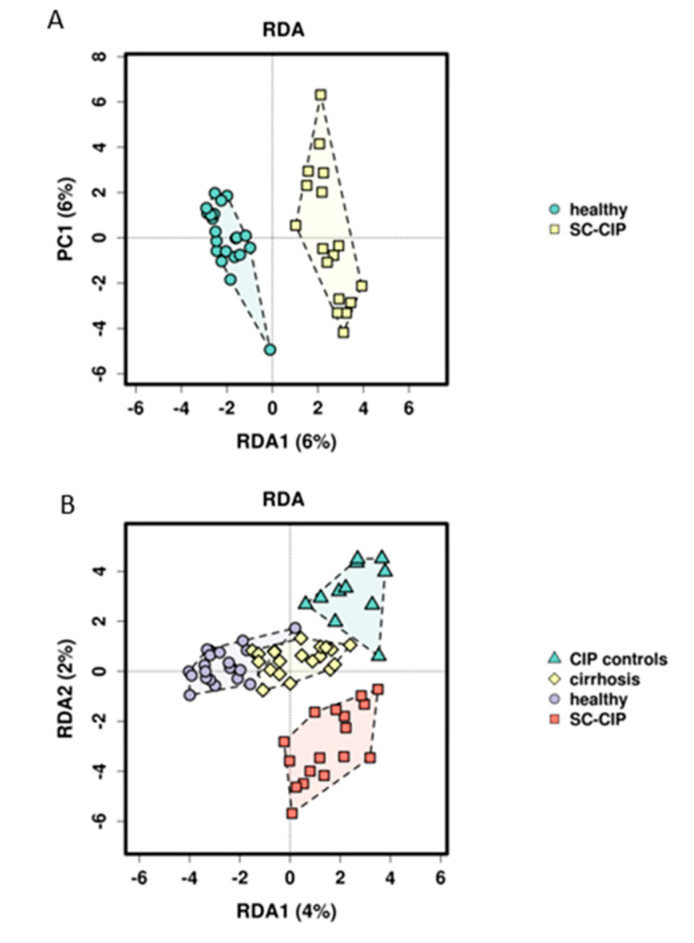
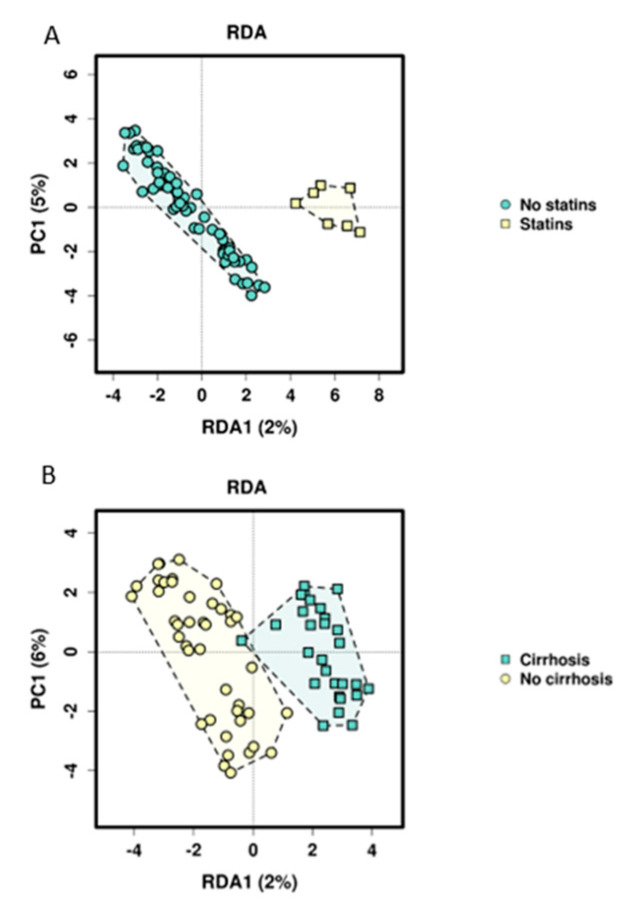
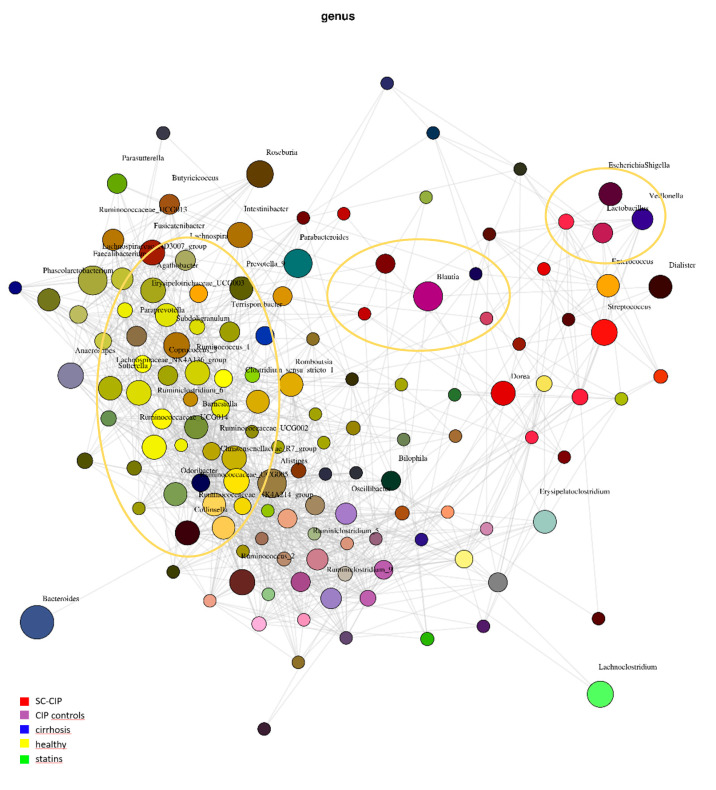
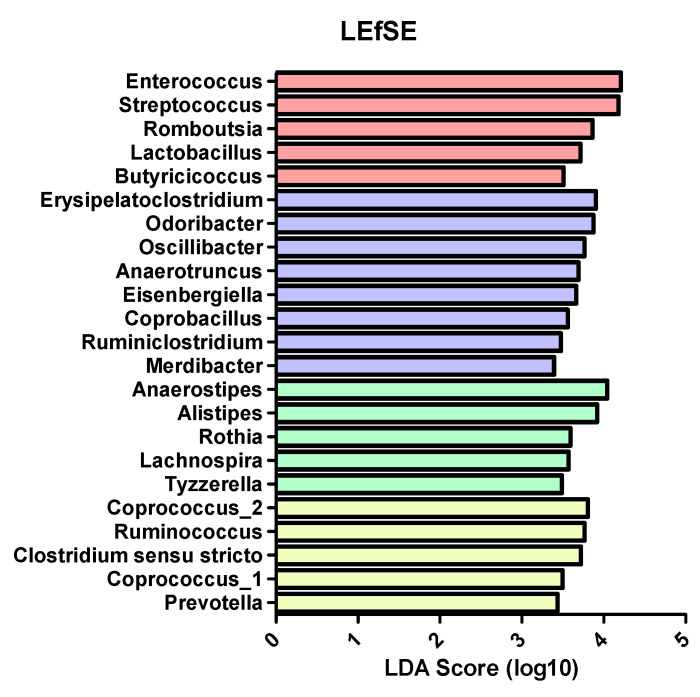
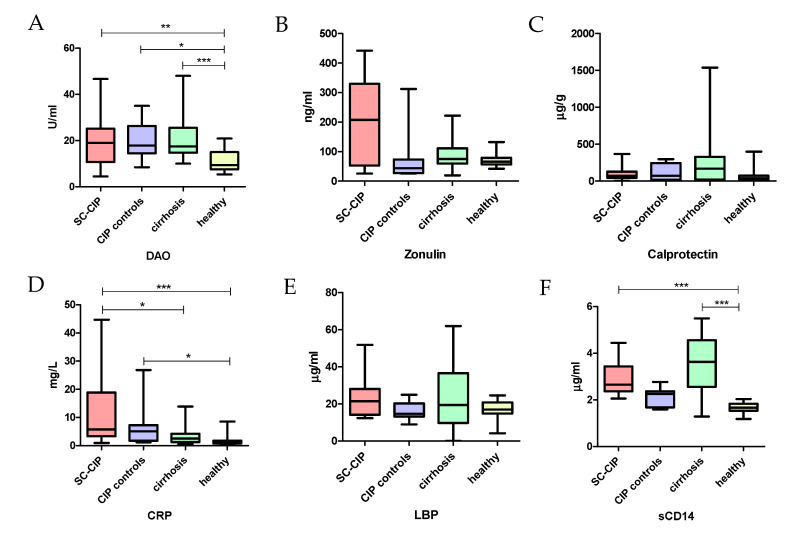
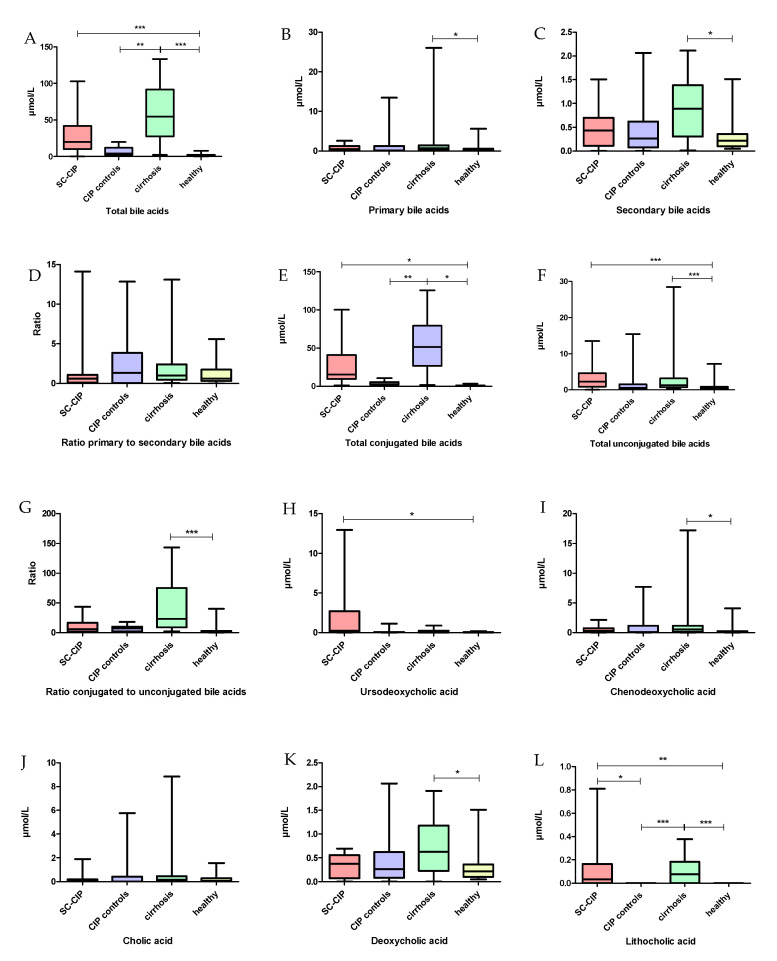
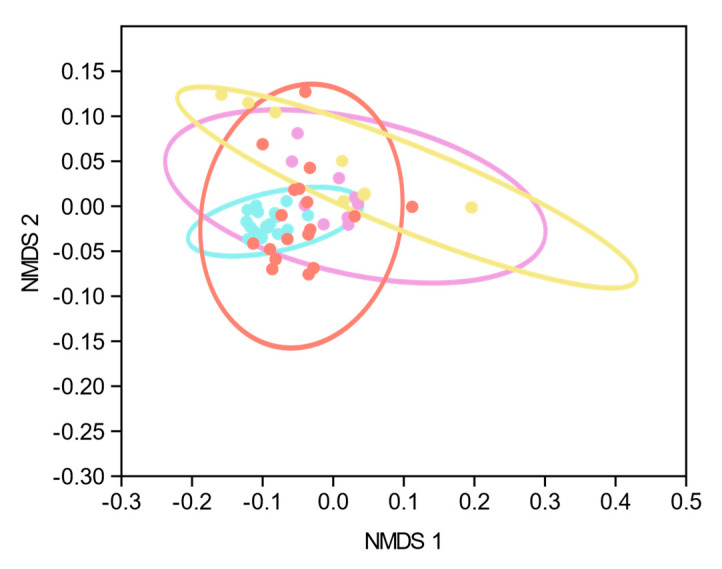
Secondary sclerosing cholangitis in critically ill patients (SC-CIP) occurs after long-term intensive care treatment. This study aimed to assess the gut-liver axis in SC-CIP. Stool microbiome composition, gut permeability, bacterial translocation and serum bile acid profiles of 18 SC-CIP patients compared to 11 patients after critical illness without liver disease (CIP controls), 21 patients with cirrhosis and 21 healthy controls were studied. 16S rDNA was isolated from stool and sequenced using the Illumina technique. Diamine oxidase, zonulin, soluble CD14 (sCD14) and lipopolysaccharide binding protein were measured in serum and calprotectin in stool. Serum bile acids were analyzed by high-performance liquid chromatography-mass spectrometry (HPLC-MS). Reduced microbiome alpha diversity and altered beta diversity were seen in SC-CIP, CIP controls and cirrhosis compared to healthy controls. SC-CIP patients showed a shift towards pathogenic taxa and an oralization. SC-CIP, CIP controls and cirrhotic patients presented with impaired gut permeability, and biomarkers of bacterial translocation were increased in SC-CIP and cirrhosis. Total serum bile acids were elevated in SC-CIP and cirrhosis and the bile acid profile was altered in SC-CIP, CIP controls and cirrhosis. In conclusions, observed alterations of the gut-liver axis in SC-CIP cannot solely be attributed to liver disease, but may also be secondary to long-term intensive care treatment.
Keywords: SC-CIP; bile acids; critical illness; gut permeability; microbiome; secondary sclerosing cholangitis.
Conflict of interest statement
The authors declare no conflict of interest.
Figures
Similar articles
-
High Rate of Gastrointestinal Bleeding in Patients with Secondary Sclerosing Cholangitis in Critically Ill Patients (SC-CIP).J Clin Med. 2021 Apr 29;10(9):1925. doi: 10.3390/jcm10091925. J Clin Med. 2021. PMID: 33946877 Free PMC article.
-
The Gut-Liver Axis in Cholestatic Liver Diseases.Nutrients. 2021 Mar 21;13(3):1018. doi: 10.3390/nu13031018. Nutrients. 2021. PMID: 33801133 Free PMC article. Review.
-
Circulating markers of gut barrier function associated with disease severity in primary sclerosing cholangitis.Liver Int. 2019 Feb;39(2):371-381. doi: 10.1111/liv.13979. Epub 2018 Oct 24. Liver Int. 2019. PMID: 30269440
-
Outcome of patients with ischemic-like cholangiopathy with secondary sclerosing cholangitis after liver transplantation.Scand J Gastroenterol. 2011 Apr;46(4):471-8. doi: 10.3109/00365521.2010.537683. Epub 2010 Nov 30. Scand J Gastroenterol. 2011. PMID: 21114429
-
Update on Sclerosing Cholangitis in Critically Ill Patients.Viszeralmedizin. 2015 Jun;31(3):178-84. doi: 10.1159/000431031. Epub 2015 Jun 9. Viszeralmedizin. 2015. PMID: 26468312 Free PMC article. Review.
Cited by
-
High Rate of Gastrointestinal Bleeding in Patients with Secondary Sclerosing Cholangitis in Critically Ill Patients (SC-CIP).J Clin Med. 2021 Apr 29;10(9):1925. doi: 10.3390/jcm10091925. J Clin Med. 2021. PMID: 33946877 Free PMC article.
-
Biliary fibrosis is an important but neglected pathological feature in hepatobiliary disorders: from molecular mechanisms to clinical implications.Med Rev (2021). 2024 Jul 1;4(4):326-365. doi: 10.1515/mr-2024-0029. eCollection 2024 Aug. Med Rev (2021). 2024. PMID: 39135601 Free PMC article. Review.
-
Predictive value of serum bile acids as metabolite biomarkers for liver cirrhosis: a systematic review and meta-analysis.Metabolomics. 2022 Jun 27;18(7):43. doi: 10.1007/s11306-022-01890-y. Metabolomics. 2022. PMID: 35759044
-
The Gut-Liver Axis in Cholestatic Liver Diseases.Nutrients. 2021 Mar 21;13(3):1018. doi: 10.3390/nu13031018. Nutrients. 2021. PMID: 33801133 Free PMC article. Review.
-
Gardenia Iridoid Glucosides Protect Against α-Naphthalene Isothiocya-Nate-Induced Cholestatic Rats Through Activation of the FXR-SHP Signaling Pathway.Clin Exp Gastroenterol. 2023 Dec 8;16:225-236. doi: 10.2147/CEG.S438234. eCollection 2023. Clin Exp Gastroenterol. 2023. PMID: 38090678 Free PMC article.
References
-
- Weig T., Schubert M.I., Gruener N., Dolch M.E., Frey L., Miller J., Johnson T., Irlbeck M. Abdominal obesity and prolonged prone positioning increase risk of developing sclerosing cholangitis in critically ill patients with influenza A-associated ARDS. Eur. J. Med. Res. 2012;17:30. doi: 10.1186/2047-783X-17-30. - DOI - PMC - PubMed
-
- Jüngst C., Stadlbauer V., Reichert M.C., Zimmer V., Weber S.N., Ofner-Ziegenfuß L., Voigtländer T., Spindelböck W., Fickert P., Kirchner G.I., et al. NOD2 gene variants confer risk for secondary sclerosing cholangitis in critically ill patients. Sci. Rep. 2017;7:7026. doi: 10.1038/s41598-017-06268-y. - DOI - PMC - PubMed
MeSH terms
Substances
Grants and funding
LinkOut - more resources
Full Text Sources
Research Materials
