. 2020 Sep 7;9(9):2041.
doi: 10.3390/cells9092041.

Eosinophils and Neutrophils-Molecular Differences Revealed by Spontaneous Raman, CARS and Fluorescence Microscopy

Affiliations

Eosinophils and Neutrophils-Molecular Differences Revealed by Spontaneous Raman, CARS and Fluorescence Microscopy

Aleksandra Dorosz et al. Cells. .

Abstract

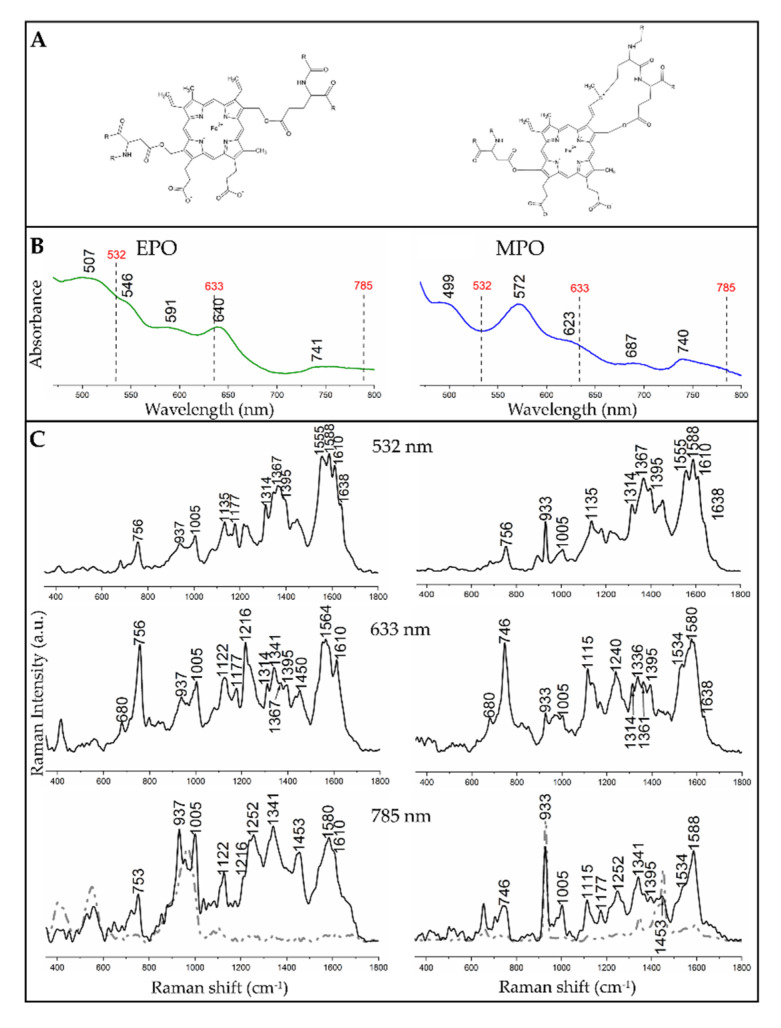
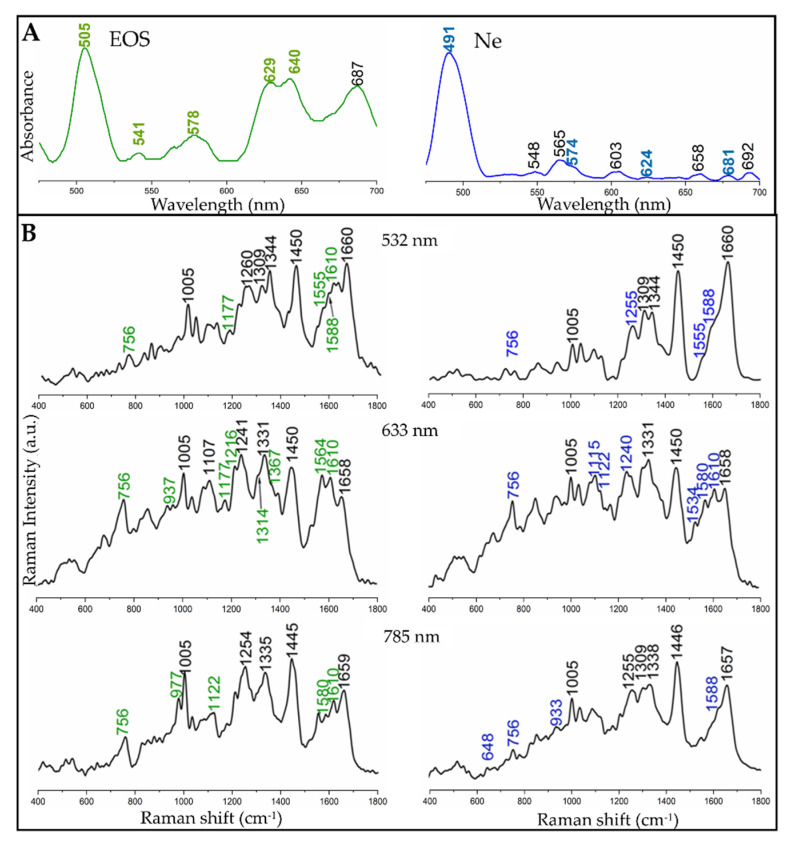
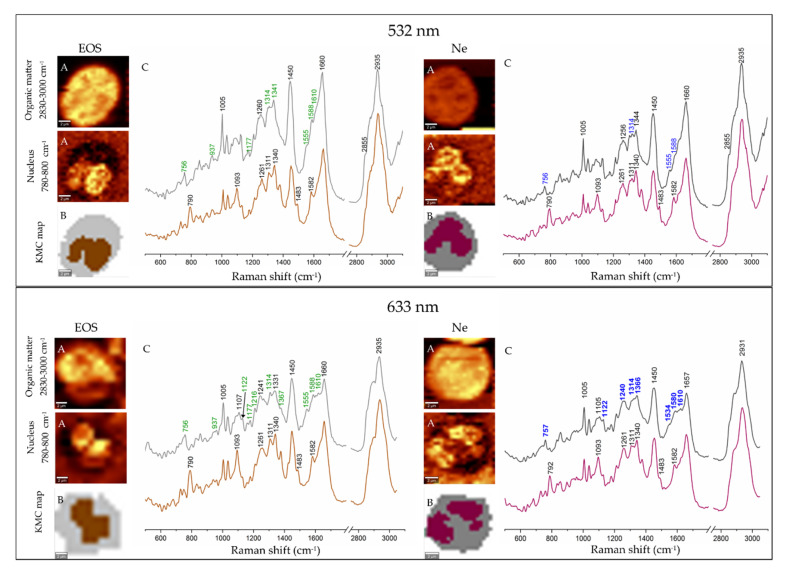
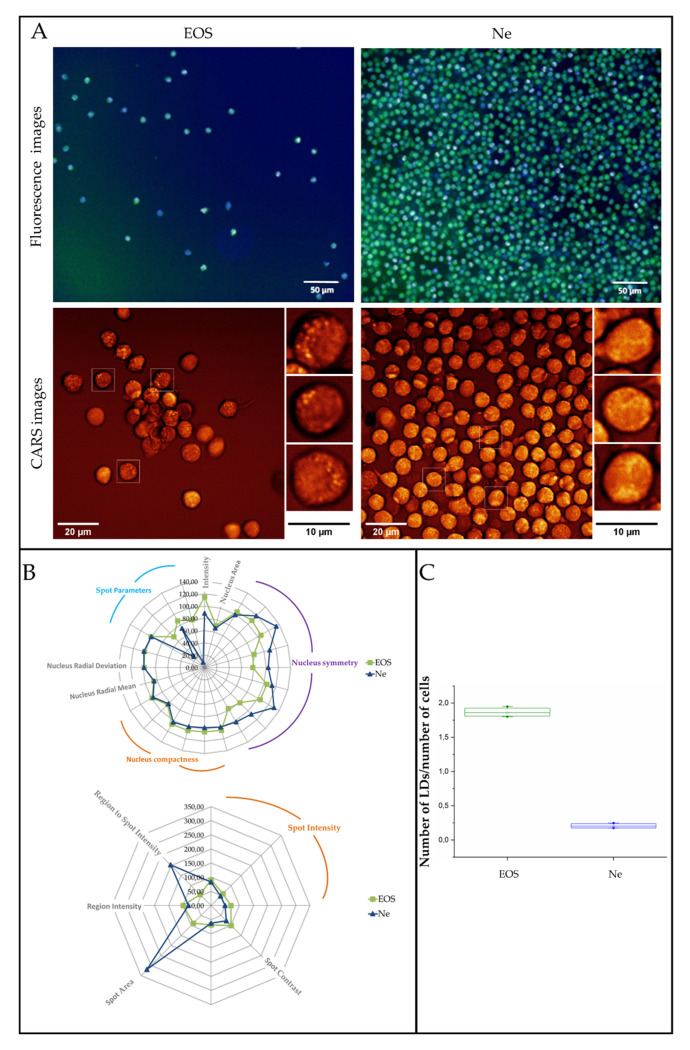
Leukocytes are a part of the immune system that plays an important role in the host's defense against viral, bacterial, and fungal infections. Among the human leukocytes, two granulocytes, neutrophils (Ne) and eosinophils (EOS) play an important role in the innate immune system. For that purpose, eosinophils and neutrophils contain specific granules containing protoporphyrin-type proteins such as eosinophil peroxidase (EPO) and myeloperoxidase (MPO), respectively, which contribute directly to their anti-infection activity. Since both proteins are structurally and functionally different, they could potentially be a marker of both cells' types. To prove this hypothesis, UV-Vis absorption spectroscopy and Raman imaging were applied to analyze EPO and MPO and their content in leukocytes isolated from the whole blood. Moreover, leukocytes can contain lipidic structures, called lipid bodies (LBs), which are linked to the regulation of immune responses and are considered to be a marker of cell inflammation. In this work, we showed how to determine the number of LBs in two types of granulocytes, EOS and Ne, using fluorescence and coherent anti-Stokes Raman scattering (CARS) microscopy. Spectroscopic differences of EPO and MPO can be used to identify these cells in blood samples, while the detection of LBs can indicate the cell inflammation process.

Keywords: Raman microscopy; coherent anti-Stokes Raman scattering (CARS), fluorescence microscopy; eosinophil peroxidase; eosinophils; lipid bodies; myeloperoxidase; neutrophils.


Conflict of interest statement

The authors declare no conflict of interest. The funders had no role in the design of the study; in the collection, analyses, or interpretation of data; in the writing of the manuscript, or in the decision to publish the results.

Figures

Figure 1
Figure 1
Spectral characteristics of neat eosinophil peroxidase (EPO, left) and myeloperoxidase (MPO, right) with their molecular structures. (A) Structures of the proteins. (B) UV−Vis absorption spectra of EPO and MPO (strong Soret bands at ca. 410–420 nm were not displayed to improve visibility of absorption bands in the region of the used excitation lines). (C) Raman spectra of EPO and MPO solutions collected with different excitation wavelengths. For the 785 nm laser excitation, the black trace represents the spectra of the solids, while the grey dashed lines are the spectra of the solutions.
Figure 2
Figure 2
Spectral characteristics of eosinophil (EOS, left) and neutrophil (Ne, right) cells. (A) UV−Vis electronic spectra of suspended EOS and Ne cells (strong Soret bands at ca. 410–440 nm are not shown to improve visibility of absorption bands in the region of the used excitation lines). (B) Averaged single point Raman spectra of EOS and Ne cells (n = 10), acquired with excitation wavelengths at 532, 633, and 785 nm. Bands labelled in green and blue correspond to the bands observed in the spectra of EPO and MPO, respectively, (Figure 1). In grey there is presented the spectra of PBS.
Figure 3
Figure 3
Raman imaging of eosinophil (EOS, left panel) and neutrophil (Ne, right panel) with laser excitations at 532 and 633 nm. (A) Raman distribution images of organic matter and nuclei. (B) False-color k-means cluster analysis (KMC) maps with the distribution of cytoplasm (grey) and nuclei (brown and purple); (C) Mean Raman spectra extracted from KMC analysis (colors of spectra correspond to the colors of KMC classes). Bands labelled in green and blue are assigned to EPO and MPO, respectively. Scale bar: 2 μm.
Figure 4
Figure 4
(A) Fluorescence (Hoechst 33,342—blue, nuclei and BODIPY 493/503—green, LBs) and coherent anti-Stokes Raman scattering images (CARS) of human eosinophils and neutrophils. (B) Multi-parametric morphological analysis of nuclei (upper) and LBs (lower) in fluorescence images. (C) A graph showing the number of LBs per cell, calculated from fluorescence images. Values are given as mean ± standard deviation and are shown in box plots: mean (horizontal line), SE (box), minimal and maximal values (whiskers).

References

    1. Maton A., Lahart D., Hopkins J., Warner M.Q., Johnson S., Wright J.D. Cells: Building Blocks of Life. 3rd ed. Prentice Hall science; Pearson Prentice Hall; Upper Saddle River, NJ, USA: 1997.
    1. Kita H. Eosinophils: Multifaceted biological properties and roles in health and disease. Immunol. Rev. 2011;242:161–177. doi: 10.1111/j.1600-065X.2011.01026.x. - DOI - PMC - PubMed
    1. Rothenberg M.E., Hogan S.P. The Eosinophil. Annu. Rev. Immunol. 2006;24:147–174. doi: 10.1146/annurev.immunol.24.021605.090720. - DOI - PubMed
    1. Rosenberg H.F., Dyer K.D., Foster P.S. Eosinophils: Changing perspectives in health and disease. Nat. Rev. Immunol. 2012;13:9. doi: 10.1038/nri3341. - DOI - PMC - PubMed
    1. Giembycz M.A., Lindsay M.A. Pharmacology of the Eosinophil. Pharmacol. Rev. 1999;51:213–340. - PubMed

Publication types

MeSH terms