. 2020 Sep 7;10(9):1289.
doi: 10.3390/biom10091289.

Nucleotide Loading Modes of Human RNA Polymerase II as Deciphered by Molecular Simulations

Affiliations

Nucleotide Loading Modes of Human RNA Polymerase II as Deciphered by Molecular Simulations

Nicolas E J Génin et al. Biomolecules. .

Abstract

Mapping the route of nucleoside triphosphate (NTP) entry into the sequestered active site of RNA polymerase (RNAP) has major implications for elucidating the complete nucleotide addition cycle. Constituting a dichotomy that remains to be resolved, two alternatives, direct NTP delivery via the secondary channel (CH2) or selection to downstream sites in the main channel (CH1) prior to catalysis, have been proposed. In this study, accelerated molecular dynamics simulations of freely diffusing NTPs about RNAPII were applied to refine the CH2 model and uncover atomic details on the CH1 model that previously lacked a persuasive structural framework to illustrate its mechanism of action. Diffusion and binding of NTPs to downstream DNA, and the transfer of a preselected NTP to the active site, are simulated for the first time. All-atom simulations further support that CH1 loading is transcription factor IIF (TFIIF) dependent and impacts catalytic isomerization. Altogether, the alternative nucleotide loading systems may allow distinct transcriptional landscapes to be expressed.

Keywords: RNA polymerase; TFIIF; diffusion; downstream bubble; entry; loading; main channel; nucleoside triphosphate; secondary channel; tertiary channel.


Conflict of interest statement

The authors declare no conflict of interest.

Figures

Figure 1
Figure 1
Nucleoside triphosphate (NTP) pathways in RNAPII. The cutaway view through the enzymatic complex is rendered via two cutoff planes (light and dark grey solid fills). The displayed conformation is from simulation aMD_A1 (simulation indexes are listed in Table 1). The protein walls are represented as white surfaces. The template and non-template DNA strands are fully shown, in fade blue and cyan stick representation, respectively. The pathway axes verifying maximal distance from protein interlining atoms for secondary channel (CH2) (orange), CH3A (red), CH3B (magenta), CH3C (pink), and CH3D (green) subchannels are shown as a series of balls. The latter trajectories are generated with a custom-built pathway-exploration algorithm. The CH2 trajectory leads to the i + 1 register, whereas the CH3A/B/C/D paths lead to the i + 2 position.
Figure 2
Figure 2
TFIIF-induced trapping of the i + 2 downstream register. (A) Configuration before (simulation aMD_A1, 15 ns); (B) After (aMD_A1, 220 ns) the relaxation of TFIIF. The folding of non-template DNA (B) frees up a cavity inside the protein represented as white surface, which in turn allows the template i + 2 register (colored by atomic type) to insert inside the cavity. The amino acids (RPB1 852, 853, 855, 856, and 859; RPB2 493–496 and 499) locking the i + 2 position are represented as grey surfaces.
Figure 3
Figure 3
NTP pathways conformational fit. Right to left columns represent minimal radius along the pathway axis of CH2, CH3A/B/C/D, generated by the pathway-exploration algorithm. The displayed processed trajectory is the last 100 ns of simulation aMD_A1. The prime symbol indicates the conformational analysis spanning 100 ns in an alternative trajectory, i.e., CH2′ (aMD_A5), CH3A’ (aMD_B’1), CH3B’ (aMD_B4), CH3C’ (aMD_B4) and CH3D’ (aMD_B4). The arrow (left) indicates the direction from the exterior of to the enzyme to the buried i + 1 and i + 2 registers for the CH2 and CH3A/B/C/D pathways, respectively. The first displayed minimal radius value (top row) is from a distance of about 6 Å along the starting of the pathway (so as to discount the initial convergence of the exploration towards the optimal pathway center).
Figure 4
Figure 4
NTP diffusion map. Amino acids lying about the path of substrate diffusion are divided into twenty macro-regions (MR). Entry MR1 to 13 are shown as color-contoured discs, where the disc contour codes propensity to NTP binding. MR13, located externally (indicated by “EXT”) to solvent pathways, connects MR3 and MR12. Infiltration MR14 to 20, defined as not accessible directly from bulk solvent, are shown as grey discs. “A site” designates the active site region encompassed by MR20. MR19′ denotes necessary downstream NTP isomerization against the bridge helix before transfer to MR20. Solid and empty star symbols represent connections that are not fully drawn. White arrows indicate initial diffusion from the bulk solvent to the entry sites. The binding propensities are defined as the average number of bound NTPs during aggregate simulation time and are indicated for the entry macro-regions. Propensities are also listed for CH2, CH3A/B/C/D overall, and are defined as the cumulative average amount of NTPs bound to MR1/2/3/4/14 for CH2, MR5/15 for CH3A, MR6/7/16 for CH3B, MR8/9/17 for CH3C, and MR10/11/12/18 for CH3D. MR1/4/5/6/7/8 are interconnected through a common junction area (solid star symbol connection). The CH3A and CH2 pathways (MR5 and MR1/4) overlap about the funnel region (represented by the imbrication of the grey shaded areas).
Figure 5
Figure 5
NTP loading through CH2. The successful diffusion trajectory across CH2 consists of the consecutive simulations aMD_A5, aMD_K2 (restart of aMD_A5), and aMD_L2 (restart of aMD_K2). The incoming NTP initiates diffusion into the funnel in aMD_A5 at 66.5 ns. The displayed trajectory is shown further along the funnel at the time point 102 ns. The center of mass of the NTP-MgB molecule, every 1 ns along the diffusion trajectory, is shown as a series of discs, color coded from light red to red, chronologically. The NTP substrate (MgB not shown) at the end of the displayed trajectory (red), and the i + 1 dNMP DNA register (colored by atomic type), are represented as sticks. The hydrogen bonds completing the CH2 diffusion process are represented as translucent red tubes. Key amino acids interacting with NTP-MgB are shown as grey sticks. Partial loadings along CH2 are represented as follows: most far-reaching alternative NTP diffusion from aMD_A4 (33.5 ns), aMD_E5 (119 ns), aMD_F4 (187 ns), aMD_L5 (93 and 118.5 ns), and aMD_L6 (101 ns) are aligned into the main trajectory and the center of mass of the NTPs are represented as gold discs. Entry macro-regions MR1 to 4, and infiltrations regions MR14 and MR20, are indicated.
Figure 6
Figure 6
NTP loading through CH1. The center of mass of the NTP-MgB molecule along the diffusion trajectories is shown as a series of discs, color coded from light red to red, chronologically. The NTP substrate (MgB not shown) at the end (AE, red) of the displayed trajectory, and the i + 1 dNMP DNA register ((E) colored by atomic type), are shown in stick representation. The hydrogen bonds completing the CH1 diffusion process (E) are represented as translucent red tubes. Key amino acids interacting with NTP-MgB are indicated. Trigger loop carboxy-terminal RPB1 1129–1137 is represented as a grey tube, with the 1K1133/1K1135 NTP contacting residues indicated as sticks. Partial loadings along CH3A/B/C/D are represented. Most far-reaching NTP diffusions from alternative simulations are aligned into the main trajectory and the center of mass of the NTPs are represented as gold discs. Entry macro-regions MR5 to 10, and infiltrations regions MR15 to 19 are indicated. (A) Diffusion through CH3A from sMD/aMD simulation aMD_N1 (0−7.9 ns), with superimposed partial loadings from simulation aMD_A4 (52 and 190 ns); (B) Diffusion through CH3B from simulation aMD_I1 (0−69.8 ns), with a superimposed partial loading from aMD_A6 (258 ns); (C) Diffusion through CH3C, the trajectory is from simulation aMD_B2 (60.25−89.75 ns), followed up by simulation aMD_C1 (0−5 ns, restarted from aMD_B2), and the superimposed partial loadings are from aMD_A6 (338.5 ns), aMD_E4 (74.5 ns), and aMD_M3 (60 ns); (D) Diffusion through CH3D from simulation aMD_I2 (25.2−127.2 ns), with superimposed partial loadings from aMD_A6 (197 and 343 ns), A3 (121.5 ns), D8 (97 ns), D12 (51.5 ns), E2 (57.5 ns), E3 (73.5 ns), F2 (52 ns), H5 (141.8 ns), and J2 (26 ns); (E) Diffusion through CH3P. The trajectory is from simulation aMD_C1 (2−6.5 ns), followed up by simulation aMD_D12 (0−9 ns, restarted from aMD_C1).
Figure 7
Figure 7
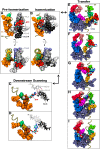
On-pathway fate of CH3P NTP. The bridge helix is represented as a tan green tube. The following amino/nucleic acids are shown in van der Waals spherical representation as follows: RNA i + 1 to i − 1 (medium blue); template DNA i + 2 to i − 1 (fade blue); bridge helix residues 1E845 (fluo green), 1D849 (green), 1K853 (dark yellow); trigger loop residues 1K1115, 1P1122, 1K1125, 1E1126, 1N1129 (orange); fork loop 2 residues 2K494, 2A496, 2K497, 2R499, 2Q500 (grey); and key active site coordinating residues 2R721 (pink), 2R975 (red), 1K775 (magenta). NTP bound magnesium ion, MgB, is shown as a silver sphere. Carboxy-terminal trigger base helix (TLc) 1K1133/1K1135 are displayed as transparent surfaces. The NTP molecule (colored by atomic type), i + 3 (white) and i + 4 (black) registers, are shown in stick (C,D) and van der Waals representation (A,B,EI). (A) Front and top view of the pre-isomerization coordination of an NTP in CH3P (aMD_E4, 5.5 ns); (B) Front and top view of the isomerization coordination (aMD_E4, 58.5 ns), following pre-isomerization; (C) First stage of the downstream scanning state. Partial bindings to i + 3/i + 4 occur (aMD_F3, 26.5 ns), with the hydrogen bonds highlighted in red; (D) Second stage of the downstream scanning state. The NTP molecule advances downstream and the phosphate group detaches from the isomerization contacts (aMD_F3, 46.5 ns); (EI) The transfer of i + 2 NTP to the active site occurs on one side of the bridge helix, while the next template register translocates on the other side. The first state (E) is an isomerization frame (sampled in aMD_E4) before the bridge helix bending. The next states (FI), are sampled from the isomerized NTP state, aligned in a protein structure with a bent bridge helix.
Figure 8
Figure 8
Mechanistic reorganizations associated with downstream binding. Left (A,D), middle (B,E), and right (C,F) columns: respective simulated configuration after 100 ns with i + 2 (aMD_M1); i + 2/+ 3 (aMD_M2); and i + 2/+ 3/+ 4 (aMD_M3) NTPs paired to template DNA. Template DNA (fade blue van der Waals spheres) is represented from i + 4 to i + 1 (AC) or sole i + 1 (DF) positions. Active site i + 1 NTP is colored by atomic type. i + 2, i + 3, and i + 4 NTPs (AC) are in white, black, and grey van der Waals spherical representation, respectively. (AC) Coupling of downstream binding to βD loop reorganization. βD loop, RPB2 483–527 (beige tube), lies in between template DNA, non-template DNA (cyan surface, represented from i−1 to i + 6), and RNA (medium blue surface, represented from i to i−2). Fork loop 2 N-TER segment RPB2 491–494 (red surface) is represented. C-TER portion of the lobe domain RPB2 384–392 is shown as an orange tube. Lobe βD loop interacting residue 2D384 is shown in van der Waals representation. βD loop junction residues are shown as follows: 2H502 (top), 2R499 (right), and 2E516/2G517/2H518 (left); (DF) The distortion of template DNA is propagated to i + 1 bound NTP (MgA and MgB ions are represented in silver), which flips towards link RPB2 713–737 (green), F claw RPB2 928–992 (black), and sleeve RPB2 772–807 (white) domains. Highlighted in van der Waals representation are the following NTP surrounding residues: link (2R721, 2Y724, and 2T723), F claw (2R975 and 2K942), sleeve (2E791 and 2D792); (F inset) The NTP triphosphate group is tightly coordinated by the sleeve, F claw, and link domains. The hydrogen bonds between the NTP and F claw 2K942 (atoms HZ2, HZ1, HZ3, and NZ, shown top left); F claw 2R975 (atoms CZ, NH2, HH22, NH1, HH11, HH12, and HH21, shown bottom left); and link 2R721 (atoms HH12, NH1, and HH11, shown bottom right) are represented as red translucent tubes. Sleeve 2D792 (atoms CG, OD1, and OD2, shown top left corner) hydrogen bond with 2R975 is represented.

Similar articles

Cited by

References

    1. Fu J., Gnatt A.L., Bushnell D.A., Jensen G.J., Thompson N.E., Burgess R.R., David P.R., Kornberg R.D. Yeast RNA polymerase II at 5 Å resolution. Cell. 1999;98:799–810. doi: 10.1016/S0092-8674(00)81514-7. - DOI - PubMed
    1. Zhang G., Campbell E.A., Minakhin L., Richter C., Severinov K., Darst S.A. Crystal structure of Thermus aquaticus core RNA polymerase at 3.3 Å resolution. Cell. 1999;98:811–824. doi: 10.1016/S0092-8674(00)81515-9. - DOI - PubMed
    1. Sosunov V., Sosunova E., Mustaev A., Bass I., Nikiforov V., Goldfarb A. Unified two-metal mechanism of RNA synthesis and degradation by RNA polymerase. EMBO J. 2003;22:2234–2244. doi: 10.1093/emboj/cdg193. - DOI - PMC - PubMed
    1. Westover K.D., Bushnell D.A., Kornberg R.D. Structural basis of transcription: Nucleotide selection by rotation in the RNA polymerase II active center. Cell. 2004;119:481–489. doi: 10.1016/j.cell.2004.10.016. - DOI - PubMed
    1. Wang D., Bushnell D.A., Westover K.D., Kaplan C.D., Kornberg R.D. Structural Basis of Transcription: Role of the Trigger Loop in Substrate Specificity and Catalysis. Cell. 2006;127:941–954. doi: 10.1016/j.cell.2006.11.023. - DOI - PMC - PubMed

Publication types

LinkOut - more resources