. 2020 Sep 7;21(18):6534.
doi: 10.3390/ijms21186534.

Cholestasis Differentially Affects Liver Connexins

Affiliations

Cholestasis Differentially Affects Liver Connexins

Axelle Cooreman et al. Int J Mol Sci. .

Abstract

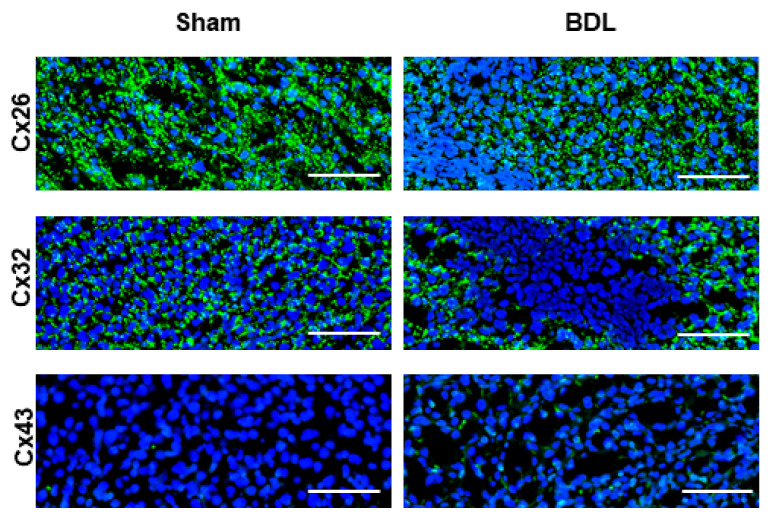
Connexins are goal keepers of tissue homeostasis, including in the liver. As a result, they are frequently involved in disease. The current study was set up to investigate the effects of cholestatic disease on the production of connexin26, connexin32 and connexin43 in the liver. For this purpose, bile duct ligation, a well-known trigger of cholestatic liver injury, was applied to mice. In parallel, human hepatoma HepaRG cell cultures were exposed to cholestatic drugs and bile acids. Samples from both the in vivo and in vitro settings were subsequently subjected to assessment of mRNA and protein quantities as well as to in situ immunostaining. While the outcome of cholestasis on connexin26 and connexin43 varied among experimental settings, a more generalized repressing effect was seen for connexin32. This has also been observed in many other liver pathologies and could suggest a role for connexin32 as a robust biomarker of liver disease and toxicity.

Keywords: cholestasis; connexin; liver.


Conflict of interest statement

The authors declare no conflict of interest. The funders had no role in the design of the study, in the collection, analyses, or interpretation of data; in the writing of the manuscript, or in the decision to publish the results.

Figures

Figure 1
Figure 1
Connexin mRNA expression in cholestasis. Hepatic mRNA levels of Cx26, Cx32 and Cx43 were studied in the liver of cholestatic mice (A) and in human hepatoma HepaRG cells cultured in cholestatic conditions (B) by RT-qPCR analysis. Relative alterations in mRNA levels were calculated according to the 2(−ΔΔCq) algorithm. (A) Liver sections were obtained from male mice following bile duct ligation (BDL) for 20 days. Data were processed by a parametric student t-test with Welch’s correction or a non-parametric Mann–Whitney test. Data are expressed as means +/− SD with * p ≤ 0.05 ** p ≤ 0.01 compared to sham-operated animals (Sham n = 12; BDL n = 18) (N = 2). (B) Human hepatoma HepaRG cells were exposed to cholestatic drugs either in the absence or presence of a 50× concentrated mixture of bile acids (BA) for 72 h and compared to untreated human hepatoma HepaRG cells, indicated in the figure as control. Data were processed by a parametric one-way ANOVA followed by post hoc tests with Dunnett’s corrections. Data are expressed as means +/− SD with * p ≤ 0.05 ** p ≤ 0.01 *** p ≤ 0.001 and **** p ≤ 0.0001 compared to control samples (control n = 3; control BA n = 3; atazanavir (ATV) n = 3; ATV BA n = 3; cyclosporine A (CsA) n = 3; CsA BA n = 3; nefazodone (NEF) n = 3; NEF BA n = 3) (N = 2).
Figure 2
Figure 2
Connexin protein expression in cholestasis. Semi-quantitative immunoblot analysis of Cx26, Cx32 and Cx43 species in livers of cholestatic mice (A) and in human hepatoma HepaRG cells cultured in cholestatic conditions (B) was performed. For Cx43, both the phosphorylated (P) and non-phosphorylated (NP) variant could be detected. Signals of the three connexins were normalized against total protein loading and expressed as relative alterations compared to sham-operated animals or to control samples, respectively. (A) Liver sections were obtained from male mice following bile duct ligation (BDL) for 20 days. Data were processed by a parametric student t-test with Welch’s correction or a non-parametric Mann–Whitney test. Data are expressed as means +/− SD with * p ≤ 0.05 and **** p ≤ 0.0001 compared to sham-operated animals (Sham n = 12; BDL n = 18) (N = 1). (B) Human hepatoma HepaRG cells were exposed to cholestatic drugs either in the absence or presence of a 50× concentrated mixture of bile acids (BA) for 72 h and compared to untreated human hepatoma HepaRG cells, indicated in the figure as control. The different experimental conditions are presented in the figure as: 1 = control; 2 = control BA; 3 = atazanavir (ATV); 4 = ATV BA; 5 = cyclosporine A (CsA); 6 = CsA BA; 7 = nefazodone (NEF); 8 = NEF BA. Data were processed by a parametric one-way ANOVA followed by post hoc tests with Dunnett’s correction. Data are expressed as means +/− SD with * p ≤ 0.05 ** p ≤ 0.01 *** p ≤ 0.001 and **** p ≤ 0.0001 compared to control samples (control n = 3; control BA n = 3; ATV n = 3; ATV BA n = 3; CsA n = 3; CsA BA n = 3; NEF n = 3; NEF BA n = 3) (N = 1).
Figure 3
Figure 3
Ratio of protein expression of non-phosphorylated Cx43 to phosphorylated Cx43. Human hepatoma HepaRG cells were exposed to cholestatic drugs either in the absence or presence of a 50× concentrated mixture of bile acids (BA) for 72 h and compared to untreated cells, indicated in the figure as control. Following immunoblot analysis of total Cx43, a second analysis of the expression level of the phosphorylated (P1/P2) and non-phosphorylated (NP) isoforms was performed. The ratio of NP-Cx43 to P1/P2-Cx43 in all different experimental conditions (i.e., 1 = control; 2 = control BA; 3 = atazanavir (ATV); 4 = ATV BA; 5 = cyclosporine A (CsA); 6 = CsA BA; 7 = nefazodone (NEF); 8 = NEF BA) was normalized against total protein loading and expressed as relative alterations compared to control samples. Data were processed by a parametric one-way ANOVA followed by post hoc tests with Dunnett’s correction. Data are expressed as means +/− SD with * p ≤ 0.05 ** p ≤ 0.01 and **** p ≤ 0.0001 compared to control samples (control n = 3; control BA n = 3; ATV n = 3; ATV BA n = 3; CsA n = 3; CsA BA n = 3; NEF n = 3; NEF BA n = 3) (N = 1).
Figure 4
Figure 4
Nrf2 protein expression in cholestasis. Semi-quantitative immunoblot analysis of Nrf2 protein in livers of cholestatic mice (A) and in human hepatoma HepaRG cells cultured in cholestatic conditions (B) was performed. Signals of Nrf2 were normalized against total protein loading and expressed as relative alterations compared to sham-operated animals or to control samples, respectively. (A) Liver sections were obtained from male mice following bile duct ligation (BDL) for 20 days. Data were processed by a parametric student t-test with Welch’s correction. Data are expressed as means +/− SD compared to sham-operated animals (Sham n = 12; BDL n = 18) (N = 1). (B) Human hepatoma HepaRG cells were exposed to cholestatic drugs either in the absence or presence of a 50× concentrated mixture of bile acids (BA) for 72 h and compared to untreated human hepatoma HepaRG cells, indicated in the figure as control. The different experimental conditions are presented in the figure as: 1 = control; 2 = control BA; 3 = atazanavir (ATV); 4 = ATV BA; 5 = cyclosporine A (CsA); 6 = CsA BA; 7 = nefazodone (NEF); 8 = NEF BA. Data were processed by a parametric one-way ANOVA followed by post hoc tests with Dunnett’s correction. Data are expressed as means +/− SD with ** p ≤ 0.01 and **** p ≤ 0.0001 compared to control samples (control n = 3; control BA n = 3; ATV n = 3; ATV BA n = 3; CsA n = 3; CsA BA n = 3; NEF n = 3; NEF BA n = 3) (N = 1).
Figure 5
Figure 5
Connexin protein localization in livers of cholestatic mice. Liver sections were obtained from male mice following bile duct ligation (BDL) for 20 days. Cellular localization of Cx26, Cx32 and Cx43 (green) was revealed by immunohistochemistry analysis with nuclear counterstaining using DAPI (blue). Scale bar, 100 µm (Sham n = 3; BDL n = 3) (N = 1).
Figure 6
Figure 6
Connexin protein localization in human hepatoma HepaRG cells cultured in cholestatic conditions. Human hepatoma HepaRG cells were exposed to cholestatic drugs either in the absence or presence of a 50× concentrated mixture of bile acids (BA) for 72 h and compared to untreated human hepatoma HepaRG cells, indicated in the figure as control. Cellular localization of the three connexin species, namely Cx26, Cx32 and Cx43 (red), was revealed by immunocytochemistry analysis with nuclear counterstaining using DAPI (blue). Scale bar, 50 µm; samples (control n = 3; control BA n = 3; ATV n = 3; ATV BA n = 3; CsA n = 3; CsA BA n = 3; NEF n = 3; NEF BA n = 3) (N = 1).
Figure 7
Figure 7
Quantification of immunohistochemistry and immunocytochemistry analysis results. Cellular localization of Cx26, Cx32 and Cx43 was revealed by immunohistochemistry (Figure 5) or immunocytochemistry (Figure 6) analysis with nuclear counterstaining using DAPI, followed by quantification of the obtained images via ImageJ software. The ratio of the area of occurrence of the particular connexin to the number of nuclei was measured and expressed as relative alterations compared to the control. (A) Liver sections were obtained from male mice following bile duct ligation (BDL) for 20 days. Data were processed by a parametric student t-test with Welch’s correction. Data are expressed as means +/− SD compared to sham-operated animals (Sham n = 3; BDL n = 3) (N = 1). (B) Human hepatoma HepaRG cells were exposed to cholestatic drugs either in the absence or presence of a 50× concentrated mixture of bile acids (BA) for 72 h and compared to untreated human hepatoma HepaRG cells, indicated in the figure as control. Data were processed by a parametric one-way ANOVA followed by post hoc tests with Dunnett’s correction. Data are expressed as means +/− SD compared to control samples (control n = 3; control BA n = 3; ATV n = 3; ATV BA n = 3; CsA n = 3; CsA BA n = 3; NEF n = 3; NEF BA n = 3) (N = 1).
Figure 8
Figure 8
Total protein loading of samples used in immunoblot analysis. Semi-quantitative immunoblot analysis of Cx26, Cx32 and Cx43 in liver of cholestatic mice (A) and in human hepatoma HepaRG cells cultured in cholestatic conditions (B) was performed. For Cx43, both the phosphorylated (P) and non-phosphorylated (NP) variant could be detected. Signals of the three connexins were normalized against total protein loading, which are shown for two representative samples. (A) Liver sections were obtained from male mice following bile duct ligation (BDL) for 20 days (Sham n = 12; BDL n = 18) (N = 1). (B) Human hepatoma HepaRG cells were exposed to cholestatic drugs either in the absence or presence of a 50× concentrated mixture of bile acids (BA) for 72 h and compared to untreated human hepatoma HepaRG cells, indicated in the figure as control. The different experimental conditions are presented in the figure as: 1 = control (n = 3); 2 = control BA (n = 3); 3 = atazanavir (ATV) (n = 3); 4 = ATV BA (n = 3); 5 = cyclosporine A (CsA) (n = 3); 6 = CsA BA (n = 3); 7 = nefazodone (NEF) (n = 3); 8 = NEF BA) (n = 3) (N = 1).

Similar articles

Cited by

References

    1. Alexander D., Goldberg G. Transfer of Biologically Important Molecules Between Cells Through Gap Junction Channels. Curr. Med. Chem. 2005;10:2045–2058. doi: 10.2174/0929867033456927. - DOI - PubMed
    1. Goodenough D.A., Goliger J.A., Paul D.L. Connexins, Connexons, and Intercellular Communication. Annu. Rev. Biochem. 1996;65:475–502. doi: 10.1146/annurev.bi.65.070196.002355. - DOI - PubMed
    1. Neveu M.J., Babcock K.L., Hertzberg E.L., Paul D.L., Nicholson B.J., Pitot H.C. Colocalized Alterations in connexin32 and Cytochrome P450IIB1/2 by Phenobarbital and Related Liver Tumor Promoters. Cancer Res. 1994;54:3145–3152. - PubMed
    1. Shoda T., Mitsumori K., Onodera H., Toyoda K., Uneyama C., Imazawa T., Hirose M. The relationship between decrease in Cx32 and induction of P450 isozymes in the early phase of clofibrate hepatocarcinogenesis in the rat. Arch. Toxicol. 1999;73:373–380. doi: 10.1007/s002040050676. - DOI - PubMed
    1. Shoda T., Mitsumori K., Onodera H., Toyoda K., Uneyama C., Takada K., Hirose M. Live Tumor-Promoting Effect of β-Naphthoflavone, a Strong CYP 1A1/2 Inducer, and the Relationship between CYP 1A1/2 Induction and Cx32 Decrease in Its Hepatocarcinogenesis in the Rat. Toxicol. Pathol. 2000;28:540–547. doi: 10.1177/019262330002800406. - DOI - PubMed