. 2020 Sep 9;15(1):50.
doi: 10.1186/s13024-020-00401-8.

Peroxiredoxin 6 mediates protective function of astrocytes in Aβ proteostasis

Affiliations

Peroxiredoxin 6 mediates protective function of astrocytes in Aβ proteostasis

Joanna E Pankiewicz et al. Mol Neurodegener. .

Abstract

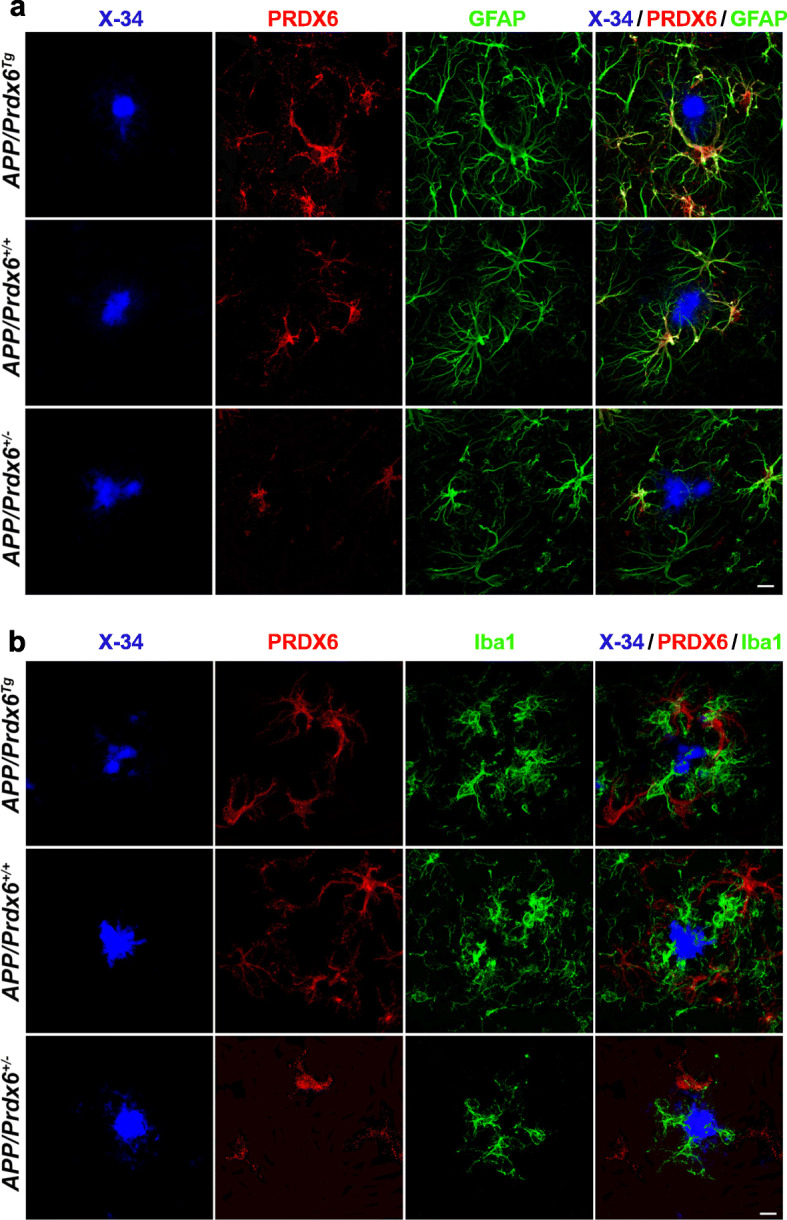
Background: Disruption of β-amyloid (Aβ) homeostasis is the initial culprit in Alzheimer's disease (AD) pathogenesis. Astrocytes respond to emerging Aβ plaques by altering their phenotype and function, yet molecular mechanisms governing astrocytic response and their precise role in countering Aβ deposition remain ill-defined. Peroxiredoxin (PRDX) 6 is an enzymatic protein with independent glutathione peroxidase (Gpx) and phospholipase A2 (PLA2) activities involved in repair of oxidatively damaged cell membrane lipids and cellular signaling. In the CNS, PRDX6 is uniquely expressed by astrocytes and its exact function remains unexplored.

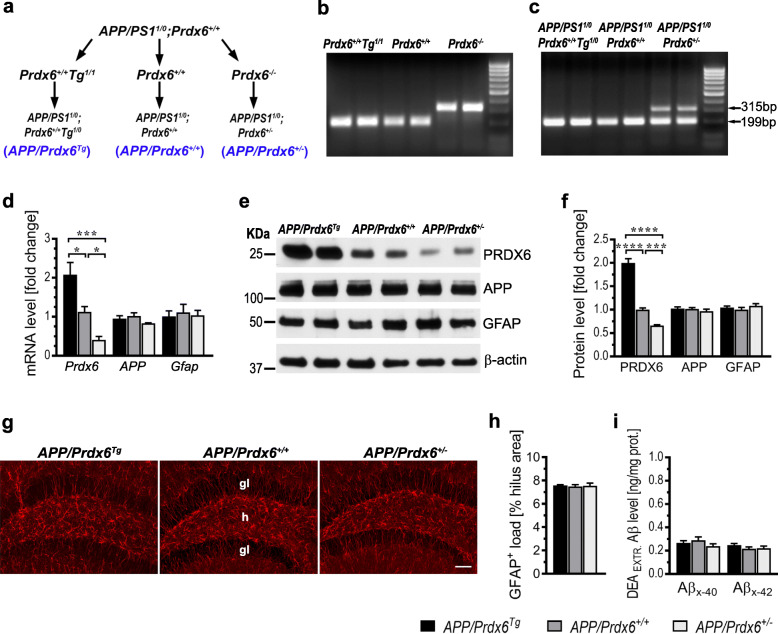
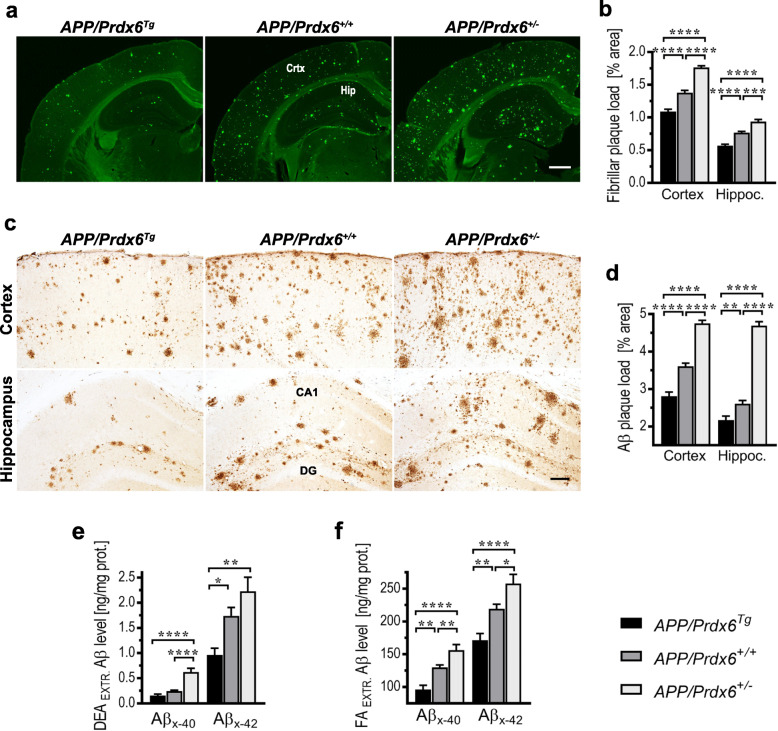
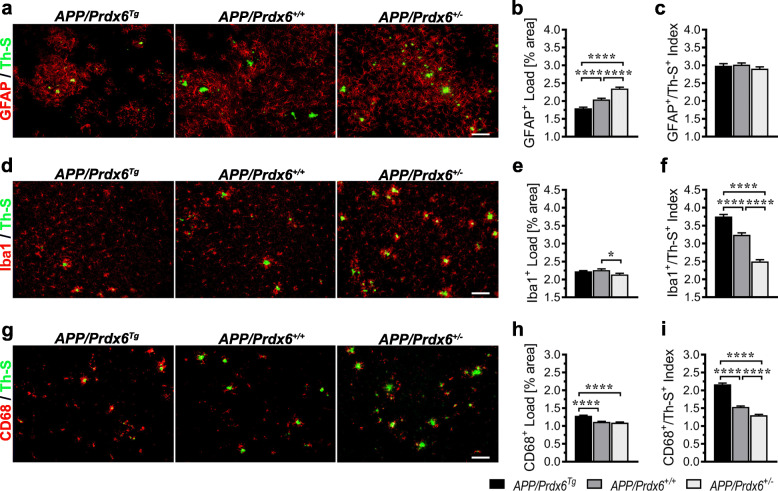
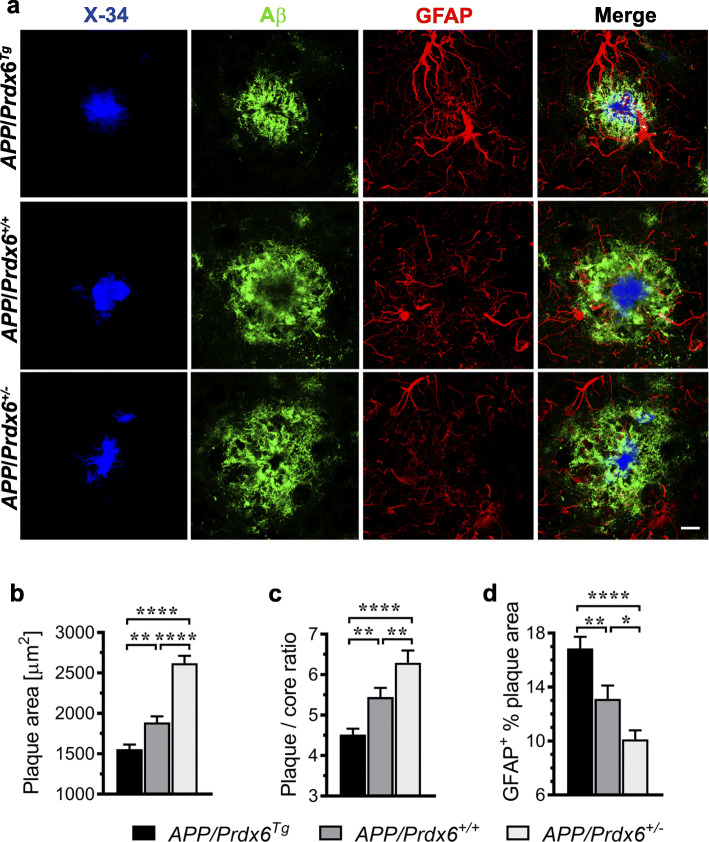
Methods: APPswe/PS1dE9 AD transgenic mice were once crossed to mice overexpressing wild-type Prdx6 allele or to Prdx6 knock out mice. Aβ pathology and associated neuritic degeneration were assessed in mice aged 10 months. Laser scanning confocal microscopy was used to characterize Aβ plaque morphology and activation of plaque-associated astrocytes and microglia. Effect of Prdx6 gene dose on plaque seeding was assessed in mice aged six months.

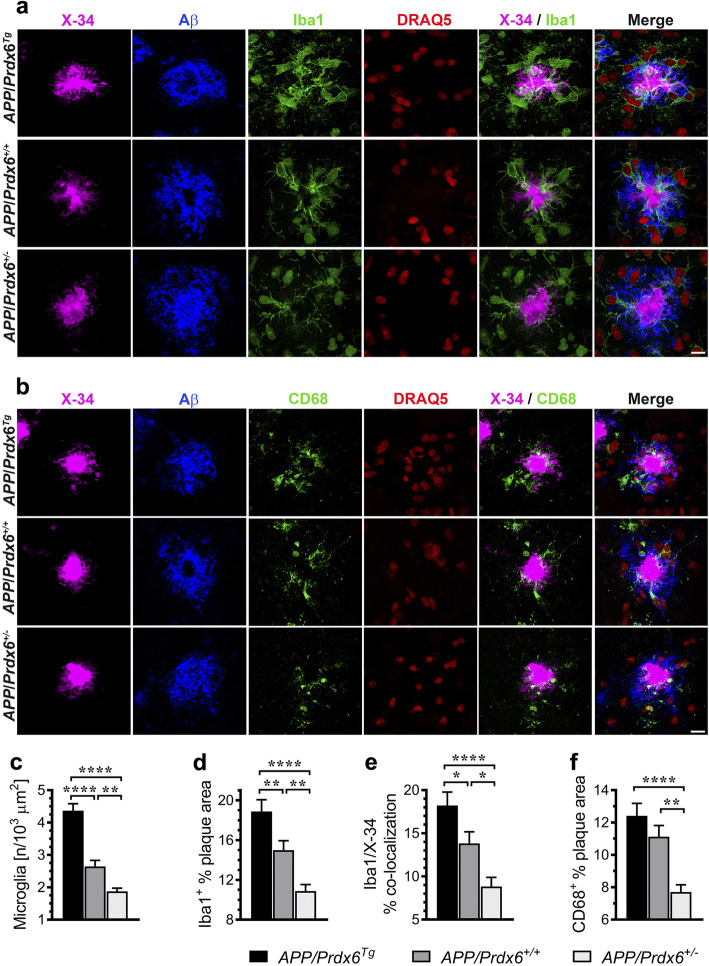
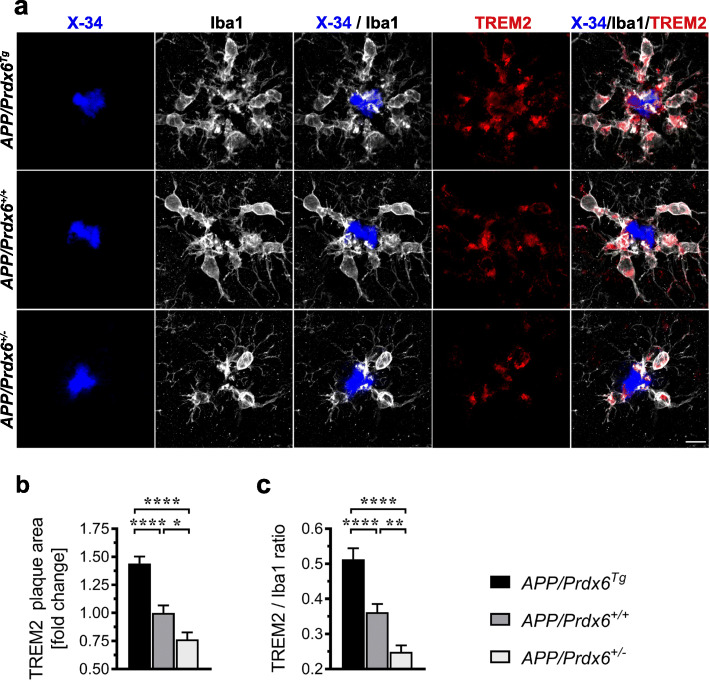
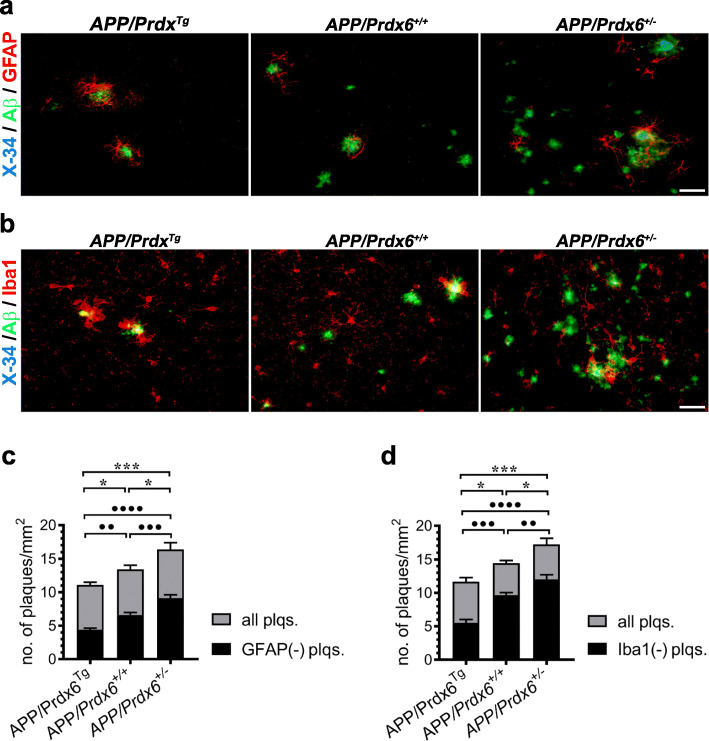
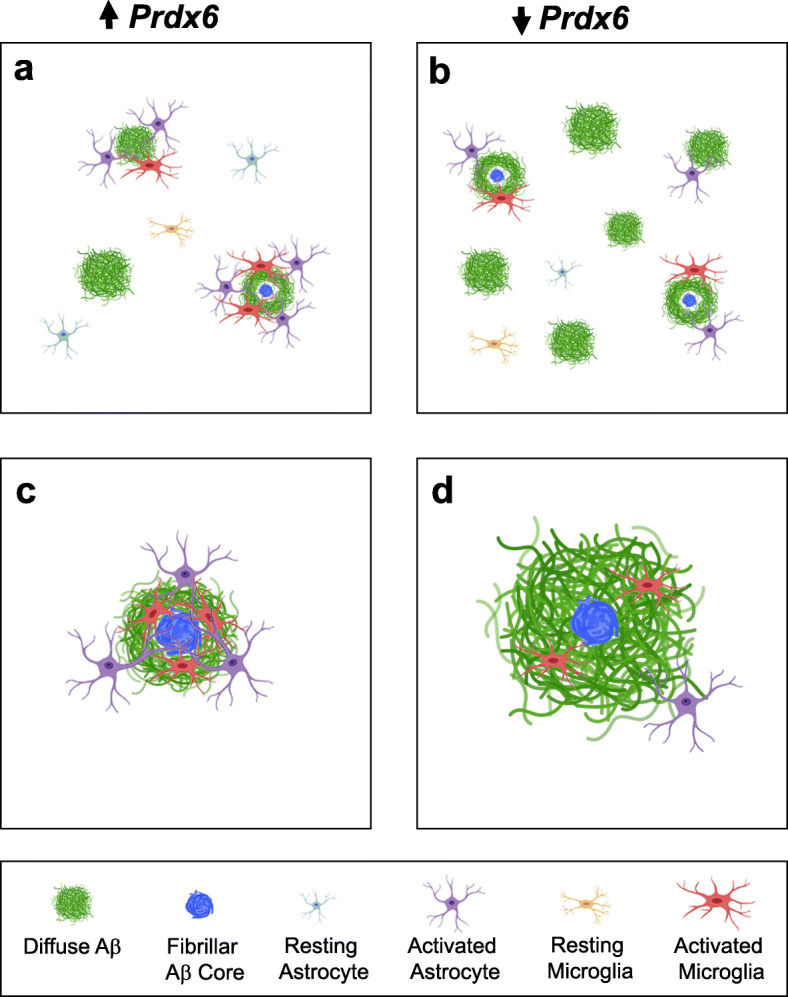
Results: We show that hemizygous knock in of the overexpressing Prdx6 transgene in APPswe/PS1dE9 AD transgenic mice promotes selective enticement of astrocytes to Aβ plaques and penetration of plaques by astrocytic processes along with increased number and phagocytic activation of periplaque microglia. This effects suppression of nascent plaque seeding and remodeling of mature plaques consequently curtailing brain Aβ load and Aβ-associated neuritic degeneration. Conversely, Prdx6 haplodeficiency attenuates astro- and microglia activation around Aβ plaques promoting Aβ deposition and neuritic degeneration.

Conclusions: We identify here PRDX6 as an important factor regulating response of astrocytes toward Aβ plaques. Demonstration that phagocytic activation of periplaque microglia vary directly with astrocytic PRDX6 expression level implies previously unappreciated astrocyte-guided microglia effect in Aβ proteostasis. Our showing that upregulation of PRDX6 attenuates Aβ pathology may be of therapeutic relevance for AD.

Keywords: Alzheimer’s disease; Astrocytes; Microglia; Neurodegeneration; Peroxiredoxin 6; Plaque seeding; Proteostasis; β-Amyloid plaques.


Conflict of interest statement

The authors declare no competing interests.

Figures

Fig. 1
Fig. 1
Development and characterization of APP/Prdx6Tg and APP/Prdx6+/− lines. a Breeding scheme: hemizygous APPSWE/PS1dE9 AD Tg mice (APP/PS11/0;Prdx6+/+) were mated to mice, which on the background of endogenous Prdx6 transgenically over-express wild type Prdx6129X1/SvJ allele (Prdx6+/+/Tg1/1), wild type C57BL/6 J mice (Prdx6+/+) or Prdx6 knock out mice (Prdx6−/−). Female F1 progeny of the following genotypes APP/PS11/0;Prdx6+/+Tg1/0 (APP/Prdx6Tg), APP/PS11/0;Prdx6+/+ (APP/Prdx6+/+), and APP/PS11/0;Prdx6+/− (APP/Prdx6+/−) were analyzed in this study. b, c Shown is Prdx6 genotyping in parental and F1 generations, respectively. Wild type Prdx6 PCR yields a single 199 bp band, whose variable intensity can side-to-side distinguish endogenous allele from transgenic overexpression, while 315 bp PCR product indicates transgenically disrupted Prdx6 allele. Altered Prdx6 expression does not affect mRNA and protein level for APP and GFAP as evidenced by qRT-PCR analysis in d and quantitative Western blotting in e and f in mice aged 4–6 weeks, respectively. Values in d and e express a fold change relative to APP/Prdx6+/+ line and represent mean (+SEM) from n = 6–8 mice per genotype in d and n = 5–7 mice per genotype in f. Altered Prdx6 expression does not affect load of astrocytes before the onset of Aβ deposition. g Representative microphotographs of coronal cross-sections through the dorsal hippocampus from 3-month-old female mice of indicated genotypes immunolabeled against GFAP. h Quantification of GFAP+ astrocyte load in the dentate hilus. Values represent mean (+SEM) from n = 5 mice per genotype. i ELISA analysis of soluble (DEA-extractable) Aβx-40 and Aβx-42 levels in the brain cortex of mice aged 2 months. Values represent mean (+SEM) from n = 7–10 animals per genotype. p = 0.0008 for Prdx6 mRNA in d and p < 0.0001 for PRDX6 protein in f (ANOVA); *p < 0.05, ***p < 0.001, and ****p < 0.0001 (Holm-Sidak’s post-hoc test). ANOVA for APP and Gfap mRNA in d, APP and GFAP protein in f, GFAP+ astrocyte load in h, and Aβx-40 and Aβx-42 levels in i is not significant. Abbreviations: gl - granular layer, h - hilus. Scale bar: 150 μm in g
Fig. 2
Fig. 2
Aβ load in APPSWE/PS1dE9 mice varies inversely with Prdx6 gene expression level. a and c Representative microphotographs of coronal cross-sections through the somatosensory cortex and the dorsal hippocampus from 10-month-old female mice of indicated genotypes, which were stained for fibrillar Aβ plaques with Thioflavin-S or immunolabeled with HJ3.4 clone directed against the N-terminus of Aβ peptide, respectively. Quantitative analysis of fibrillar b and immunopositive d Aβ plaque load in the brain cortex and in the hippocampus evidencing suppression of Aβ deposition in Prdx6 overexpressing mice and increased Aβ deposition in Prdx6 haplodeficient mice. Values represent mean (+SEM) from n = 9–12 female mice per genotype. e and f ELISA analysis of soluble (DEA-extractable) and total (FA-extractable) Aβx-40 and Aβx-42 levels in the brain cortex of female 10-month-old mice, respectively. Values represent mean (+SEM) from n = 7–13 animals per genotype. p < 0.0001 in b, d, e, and f (ANOVA); *p < 0.05, **p < 0.01, ***p < 0.001, and ****p < 0.0001 (Holm-Sidak’s post-hoc test). Abbreviations: CA1 – cornu Ammonis sector 1, Crtx – cortex, DG – dentate gyrus, Hip – hippocampus. Scale bars: 750 μm in a and 50 μm in c
Fig. 3
Fig. 3
Prdx6 gene dose does not affect global response of astrocytes to Aβ deposition but shows a direct relationship with that of microglia. a, d, g Representative microphotographs of anti-GFAP, −Iba1, or -CD68 immunolabeled coronal sections through the somatosensory cortex from 10-month-old female mice of indicated genotypes, respectively. Counterstaining with Thioflavin-S (Th-S) reveals fibrillar plaques to which the load of glial cells was indexed. b, e, and h Quantitative analysis of GFAP+, Iba1+, and CD68+ cell load, in the brain cortex, respectively. c, f, and i Show loads of GFAP+, Iba1+, and CD68+ cells indexed to these of Th-S+ fibrillar plaques, respectively. While Th-S+-indexed GFAP+ cell load demonstrates no statistically significant differences across the genotypes, those for Iba+ and CD68+ cells have significant direct relationship with Prdx6 gene dosage. All values represent mean (+SEM) from n = 12 mice per genotype. p < 0.0001 in b, f, h, and i, p = 0.27 in c and p = 0.0142 in e (ANOVA); *p < 0.05, and ****p < 0.0001 (Holm-Sidak’s post-hoc test). Scale bar: 50 μm in a, d, and g
Fig. 4
Fig. 4
Prdx6 expression alters plaque morphology and their penetrance by astrocytes. a Representative LSCM images of mature plaques triple labeled with X-34 (fibrillar core), anti-Aβ (HJ3.4 clone), and anti-GFAP antibodies from female mice of indicated genotypes demonstrating inverse relationship between Prdx6 gene dose and size of Aβ plaques and degree of plaque compactness expressed as a ratio between cross-sectional areas of Aβ plaque label and X-34 labeled fibrillar core. Prdx6 overexpression also is associated with increased penetrance of Aβ plaques by astrocytes, while in Prdx6 haplodeficient mice the number and caliber of plaque penetrating GFAP positive processes are diminished. Shown are quantitative analyses of: average Aβ plaque cross-sectional area b, plaque/core ratio c, and GFAP plaque index (GFAP+ % plaque area) d. Values in b and c represent mean (+SEM) from n = 70–90 randomly selected plaques per genotype, while those in d from n = 30 randomly selected plaques per genotype. p < 0.0001 in b, c, and d (ANOVA); *p < 0.05, **p < 0.01, and ****p < 0.0001 (Holm-Sidak’s post-hoc test). Scale bar: 10 μm in a
Fig. 5
Fig. 5
Phagocytic activation of plaque-associated microglia is enhanced in mice overexpressing Prdx6 and attenuated in Prdx6 haplodeficient mice. Representative LSCM images of mature plaques co-labeled with X-34 (fibrillar core), anti-Aβ (HJ3.4 clone), anti-Iba1, and DRAQ5 (nuclear stain) in a, and with X-34, anti-Aβ, anti-CD68, and DRAQ5 in b evidencing direct relationship between Prdx6 gene dose and the number of periplaque microglia cells and expression of Iba1 and CD68 microglial activation markers. Shown are morphometric analyses of plaque-associated microglia number c, Iba1 plaque index (Iba1+ % plaque area) d, microglia barrier robustness (Iba1/X-34% co-localization) e, and CD68 phagosome plaque index (CD68+ % plaque area) f. Values in c through f represent mean (+SEM) from n = 26–35 randomly selected plaques per staining and per genotype. p < 0.0001 in c through f (ANOVA); *p < 0.05, **p < 0.01, and ****p < 0.0001 (Holm-Sidak’s post-hoc test). Scale bar: 10 μm in a and b
Fig. 6
Fig. 6
Expression of TREM2 in plaque-associated microglia shows direct relationship with Prdx6 gene dose. a Representative LSCM images of mature plaques co-labeled with X-34 (fibrillar core), anti-Iba1, and anti-TREM2 antibodies from female animals of indicated genotypes evidence increased periplaque expression of TREM2 in APP/Prdx6Tg line and conversely reduced expression in APP/Prdx6+/− line compared to APP/Prdx6+/+ controls. Quantification of TREM2 immunoreactivity within surrounding of the X-34+ fibrillar core (TREM2 plaque area) b and TREM2 to Iba1 ratio in plaque-associated microglia c. Values represent mean (+SEM) from n = 45 randomly selected plaques per genotype. p < 0.0001 in b and c (ANOVA); *p < 0.05, **p < 0.01, and ****p < 0.0001 (Holm-Sidak’s post-hoc test). Scale bar: 10 μm in a
Fig. 7
Fig. 7
PRDX6 protein is exclusively expressed by astrocytes and absent in plaque-associated microglia. Representative LSCM images of mature plaques co-labeled with X-34 (fibrillar core), anti-PRDX6, and anti-GFAP antibodies in a, and with X-34, and anti-PRDX6, and anti-Iba1 antibodies in b evidencing colocalization of PRDX6 immunostaining with that of GFAP but not with Iba1. Co-labeling with anti-PRDX6, and anti-Iba1 antibodies in b reveals in fact two distinct cell populations localized further apart and closer to the fibrillar core, respectively. There is apparent APP/Prdx6Tg > APP/Prdx6+/+ > APP/Prdx6+/− gradient of PRDX6 immunostaining intensity across the genotypes. PRDX6 immunostaining does not co-localize with the X-34 labeled fibrillar plaque core. Scale bar: 10 μm in a and b
Fig. 8
Fig. 8
Prdx6 expression modulates plaque seeding. Shown are representative images of nascent plaques in female mice aged 6 months of indicated genotypes, which were co-labeled with X-34 (fibrillar core), and anti-Aβ (HJ3.4 clone) and anti-GFAP antibodies in a and with X-34, anti-Aβ (HJ3.4 clone), and anti-Iba1 antibodies in b evidencing an inverse relationship between Prdx6 expression level and the numerical density of nascent plaques and the numerical density of nascent plaques devoid of GFAP+ and Iba1+ cells. Quantitative analysis of nascent plaque numerical density in the brain cortex performed on X-34/Aβ/GFAP co-labeled sections in c, and on X-34/Aβ/Iba1 co-labeled sections in d. In this analysis nascent plaques were arbitrary defined as having no X-34+ core or having X-34+ core < 40 μm2. Black bars represent number of plaques devoid of GFAP+ or Iba1+ cells /mm2 and are superimposed on grey bars representing the total number of plaques /mm2 for a given genotype. Values in c and d represent mean (+SEM) from n = 6 female mice per genotype. p < 0.0001 in c and d (ANOVA); ●●p < 0.01, ●●●p < 0.001, and ●●●●p < 0.0001 denote significance for the density of GFAP and Iba1 devoid plaques across genotypes; *p < 0.05, and ***p < 0.001, denote significance for the density of all plaques (Holm-Sidak’s post-hoc test). Scale bar: 20 μm in a and b
Fig. 9
Fig. 9
Neuritic degeneration is attenuated in APPSWE/PS1dE9 mice overexpressing Prdx6 and exacerbated in Prdx6 haplodeficient mice. a Shown are representative microphotographs of coronal cross-sections through the somatosensory cortex (upper panel) and the dorsal hippocampus (lower panel) from 10-month-old female mice of indicated genotypes, which were stained with Gallyas silver stain. Both the numerical density of neuritic plaques and the number and size of spheroid bodies forming the plaques increase in the rank order of APP/Prd6Tg < APP/Prd6+/+ < APP/Prd6+/−. Arrows indicate mature plaques while arrowheads indicate early stage of neuritic degeneration associated with emerging plaques, which are abundant in the APP/Prd6−/− mice. b Quantitative analysis of numerical density of Gallyas+ neuritic plaques in the brain cortex and in the hippocampus depicted as mean value (+SEM) from n = 6 female mice per genotype. c Shown are high magnification microphotographs of neuritic plaques produced by superimposing bright field picture of silver impregnated spheroids on fluorescent image of X-34 labeled fibrillar plaque core highlighting the differences in plaque composition across the genotypes, which include both the number and the distance spheroid spread away from the fibrillar core. d Representative LCMS images of plaques co-labeled with antibodies against the N-terminus of Aβ peptide (Aβ1–16) and neurofilaments (NF) from female mice of indicated genotypes demonstrating distorted trajectories of axons passing in the vicinity of the plaques and presence of axonal swellings (spheroids) in the area occupied by anti-Aβ immunolabeling (white encirclement indicated by Aβ plaque mask). Quantification of the number of NF+ axonal swellings per Aβ plaque in e and NF+ plaque index (NF+ % plaque area) in f. Values represent mean (+SEM) from n = 40 randomly selected plaques per genotype. p < 0.001 for the hippocampus in b, and p < 0.0001 for the brain cortex in b, e, and f (ANOVA); *p < 0.05, **p < 0.01, and ****p < 0.0001 (Holm-Sidak’s post-hoc test). Scale bars: 50 μm – the cortex and 200 μm the hippocampus in a, and 10 μm in c and d
Fig. 10
Fig. 10
Schematic depiction of PRDX6 dependent mechanisms in Aβ homeostasis: a and b preventive effect on nascent plaque seeding and c and d remodeling of mature plaques. a Overexpression of Prdx6 is associated with reduced number of nascent plaques and specifically those, which are devoid of activated astrocytes and/or microglia cells. b In contrast, Prdx6 haplodeficiency increases number of nascent plaques including those, which are not associated with astro- and micro- glial cells. c Mature plaques in Prdx6 overexpressing mice show increased plaque compactness and diminished deposition of diffuse Aβ peptide around the plaque fibrillar core. d Conversely, Prdx6 haplodeficiency is associated with reduced plaque compactness and increased amount of diffuse Aβ in the plaque periphery. There is a direct association between the Prdx6 gene dose and periplaque activation of astrocytes and microglia. Since PRDX6 is an astrocytic protein these observations imply phagocytic function of microglia in Aβ proteostasis is regulated by astrocytes

Similar articles

Cited by

References

    1. Hanseeuw BJ, Betensky RA, Jacobs HIL, Schultz AP, Sepulcre J, Becker JA, Cosio DMO, Farrell M, Quiroz YT, Mormino EC, et al. Association of Amyloid and tau with Cognition in preclinical Alzheimer disease: a longitudinal study. JAMA Neurol. 2019. - PMC - PubMed
    1. Shi Y, Holtzman DM. Interplay between innate immunity and Alzheimer disease: APOE and TREM2 in the spotlight. Nat Rev Immunol. 2018;18:759–772. - PMC - PubMed
    1. Yuan P, Condello C, Keene CD, Wang Y, Bird TD, Paul SM, Luo W, Colonna M, Baddeley D, Grutzendler J. TREM2 Haplodeficiency in mice and humans impairs the microglia barrier function leading to decreased amyloid compaction and severe axonal dystrophy. Neuron. 2016;90:724–739. - PMC - PubMed
    1. Ulland TK, Colonna M. TREM2 - a key player in microglial biology and Alzheimer disease. Nat Rev Neurol. 2018;14:667–675. - PubMed
    1. Fisher AB. Peroxiredoxin 6 in the repair of peroxidized cell membranes and cell signaling. Arch Biochem Biophys. 2017;617:68–83. - PMC - PubMed

Publication types

LinkOut - more resources