. 2020 Sep 10;21(1):225.
doi: 10.1186/s13059-020-02145-6.

Natural display of nuclear-encoded RNA on the cell surface and its impact on cell interaction

Affiliations

Natural display of nuclear-encoded RNA on the cell surface and its impact on cell interaction

Norman Huang et al. Genome Biol. .

Abstract

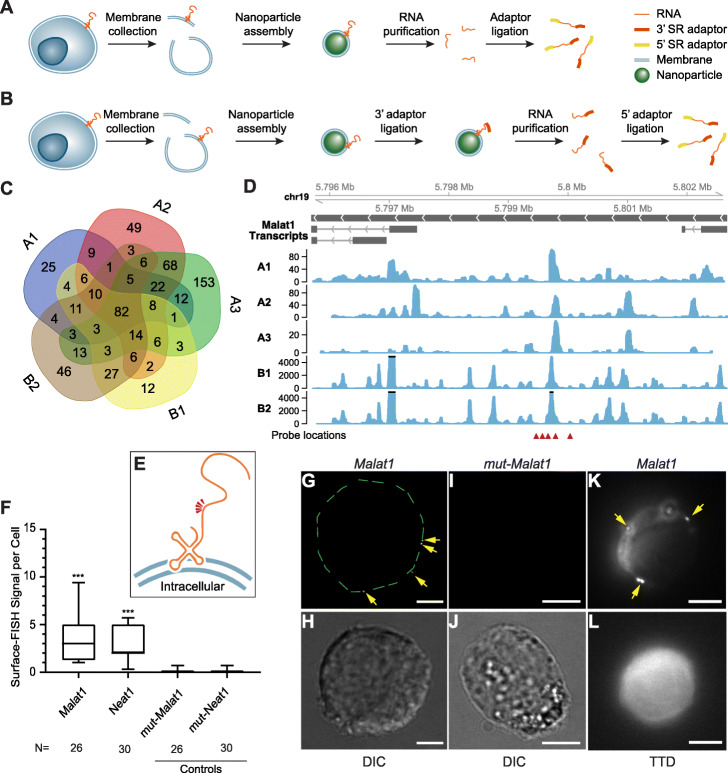
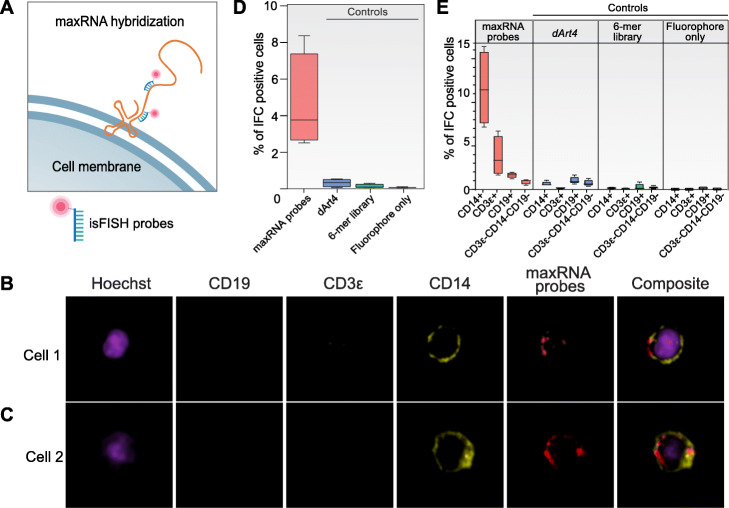
Background: Compared to proteins, glycans, and lipids, much less is known about RNAs on the cell surface. We develop a series of technologies to test for any nuclear-encoded RNAs that are stably attached to the cell surface and exposed to the extracellular space, hereafter called membrane-associated extracellular RNAs (maxRNAs).

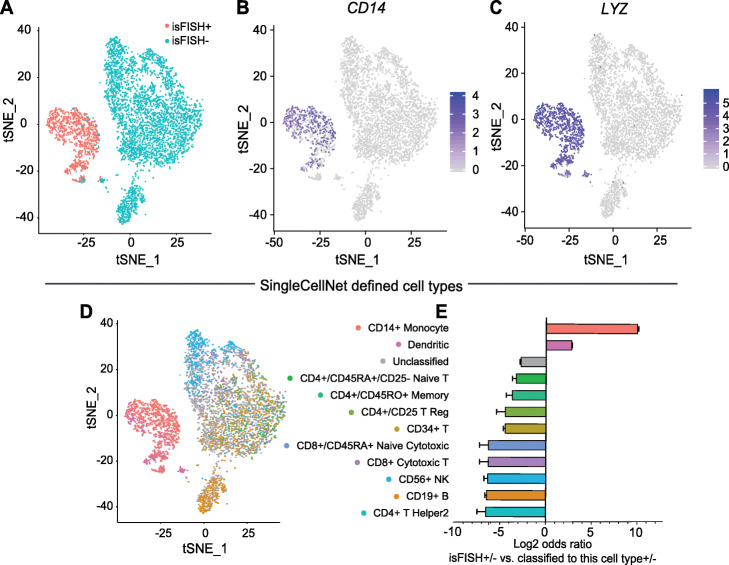
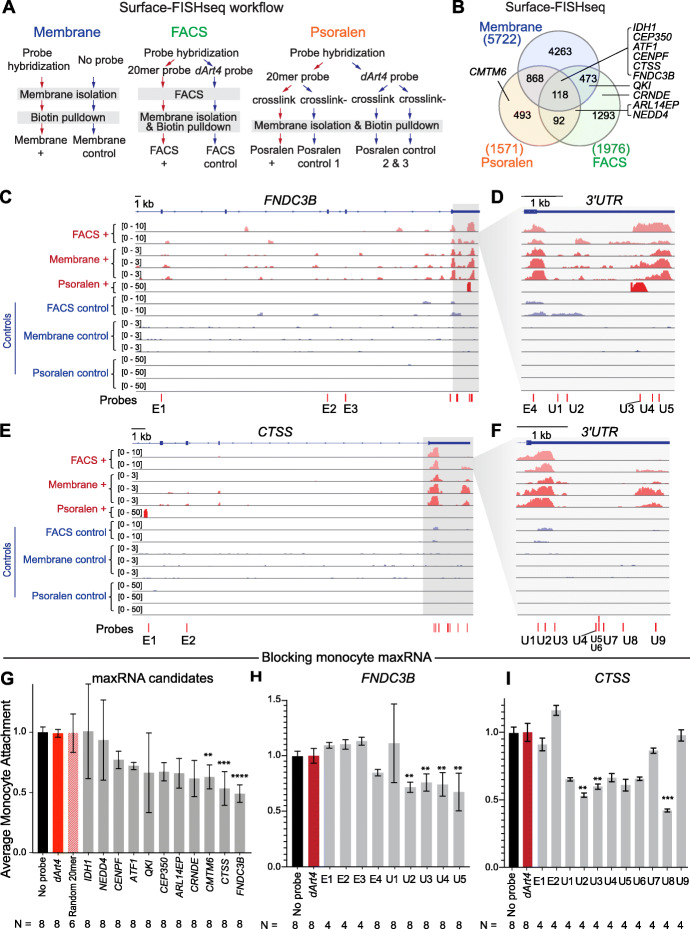
Results: We develop a technique called Surface-seq to selectively sequence maxRNAs and validate two Surface-seq identified maxRNAs by RNA fluorescence in situ hybridization. To test for cell-type specificity of maxRNA, we use antisense oligos to hybridize to single-stranded transcripts exposed on the surface of human peripheral blood mononuclear cells (PBMCs). Combining this strategy with imaging flow cytometry, single-cell RNA sequencing, and maxRNA sequencing, we identify monocytes as the major type of maxRNA+ PBMCs and prioritize 11 candidate maxRNAs for functional tests. Extracellular application of antisense oligos of FNDC3B and CTSS transcripts inhibits monocyte adhesion to vascular endothelial cells.

Conclusions: Collectively, these data highlight maxRNAs as functional components of the cell surface, suggesting an expanded role for RNA in cell-cell and cell-environment interactions.

Keywords: Cell membrane; Cell surface; Cell-environment interaction; Endothelial cells; Extracellular RNA; Monocyte; Single cell.


Conflict of interest statement

S.Z. is a founder and board member of Genemo, Inc.

Figures

Fig. 1
Fig. 1
Sequencing and validation of maxRNA from a cell line. a, b The workflow of the two variations of Surface-seq. c A Venn diagram of the noncoding RNAs identified by the 5 Surface-seq experiments, indexed by A1, A2, A3 (based on Surface-seq variation A), and B1, B2 (based on Surface-seq variation B). d Read coverages from the 5 Surface-seq libraries on the MALAT1 gene, indexed by A1, A2, A3, B1, and B2. Red arrowheads: locations of Surface-FISH probes. e A hypothetical model of the relative positions of Surface-FISH probes (red arrowheads) on a membrane-bound Malat1 RNA fragment. f Box plots of the numbers of Surface-FISH signal foci per cell (y-axis) for Malat1, Neat1, and two controls (mut-Malat1, mut-Neat1) (columns). N: number of cells examined. g, h Malat1 Surface-FISH (g) and DIC image of the same cell (h). The green dashed lines outline the rim of the cell. i, j Control probeset mut-Malat1 Surface-FISH (i) and DIC images of the same cell (j). k, l Malat1 Surface-FISH (k) and transmission-through-dye (TTD) image of the same cell (l). Arrows: Malat1 Surface-FISH signals. The TTD image was produced by a membrane-permeable dye used in conjunction with a membrane-impermeable quencher, indicating a cell with an intact cell membrane. Scale bar = 5 μm. Probe signals were compared against corresponding controls. ***p value < 0.0001
Fig. 2
Fig. 2
Imaging flow cytometry (IFC) analysis of maxRNAs co-localization with immune cell surface markers in human PBMCs. a A schematic view of the extracellular hybridization of the fluorophore (red dot) labeled probes (isFISH probes) to a hypothetical maxRNA. b, c IFC images of two representative PBMC cells (rows) in 5 channels (columns), including DAPI, CD19, CD3ε, CD14, and maxRNA probes, as well as merged images of all channels (Composite). d, e The proportions of PBMCs that exhibit IFC signals (y-axis) when assayed with maxRNA probes and 3 types of controls (dArt4 probe, 6-mer library, and fluorophore only). Each box plot was derived from 4 independent biological replicates. d Total IFC positive cells PBMCs for each probe treatment. e CD14+, CD3ε+, CD19+, and CD3ε−CD14−CD19− PBMCs are separately plotted
Fig. 3
Fig. 3
Single-cell transcriptomes of maxRNA presenting PBMCs. ac tSNE plots of 11,233 single cells resulted from FACS sorting, including 2486 isFISH+ (pink dots) and 9043 isFISH− cells (blue dots) (a), with CD14 (b), and LYZ (c) expression levels color-coded as indicated next to the cell type label. d The classification of the single cells with each color representing a pre-defined cell type. e Association (measured by log2 odds ratio, x-axis) of isFISH+ cells with each pre-defined cell type (y-axis). A value greater than 0 indicates enrichment, while a value smaller than 0 indicates depletion. Error bar: standard error of the log2 odds ratio
Fig. 4
Fig. 4
Surface-FISHseq analysis of PBMCs and functional tests of maxRNAs in primary human monocytes. a The Surface-FISHseq experimental workflow for the 3 technical variations. b A Venn diagram of maxRNAs identified by each of the 3 technical variations of Surface-FISHseq: Surface-FISHseq-membrane (blue), Surface-FISHseq-FACS (green), and Surface-FISHseq-Psoralen (orange). cf Read distributions of Surface-FISHseq test libraries (red tracks) and control libraries (blue tracks) on (c) FNDC3B and (e) CTSS. d, f Expanded views of the 3′UTR regions of the two genes. Probes track (bottom track): locations and IDs of antisense oligonucleotides for functional tests. g Effects of probe incubation on the average monocyte attachment levels (normalized to the no-probe control (black), y-axis) of dArt4 control probeset (dArt4), the randomized 20 nt control probeset (random 20-mer), and the antisense probe-sets against the 11 Surface-FISHseq identified targets (gray columns). Each probe-set is comprised of twenty-five 20 nt antisense oligonucleotide probes. Error bar: standard error of the mean. N: number of replicate experiments. Each condition was compared to no-probe control. **Bonferroni-adjusted p < 0.001, ***Bonferroni-adjusted p < 0.0001, ****Bonferroni-adjusted p < 0.00001. h, i Effects of individual antisense probes to the average monocyte attachment levels (y-axis) in no-probe control (black), dArt4 control (red), and by each FNDC3B probe (gray columns, indexed by E1-E4, U1-U5 corresponding to locations in d) and each CTSS probe (E1, E2, U1-U9 corresponding to the locations in panel f). Each condition was compared to no-probe control. **Bonferroni-adjusted p < 0.001, ***Bonferroni-adjusted p < 0.0001

Similar articles

Cited by

References

    1. Casciola-Rosen LA, Anhalt G, Rosen A. Autoantigens targeted in systemic lupus erythematosus are clustered in two populations of surface structures on apoptotic keratinocytes. J Exp Med. 1994;179(4):1317–1330. - PMC - PubMed
    1. Takahashi T, Kulkarni NN, Lee EY, Zhang LJ, Wong GCL, Gallo RL. Cathelicidin promotes inflammation by enabling binding of self-RNA to cell surface scavenger receptors. Sci Rep. 2018;8(1):4032. - PMC - PubMed
    1. Morozkin ES, Laktionov PP, Rykova EY, Vlassov VV. Extracellular nucleic acids in cultures of long-term cultivated eukaryotic cells. Ann N Y Acad Sci. 2004;1022:244–249. - PubMed
    1. Block KF, Puerta-Fernandez E, Wallace JG, Breaker RR. Association of OLE RNA with bacterial membranes via an RNA-protein interaction. Mol Microbiol. 2011;79(1):21–34. - PMC - PubMed
    1. Sanders W, Laederach A. Membrane RNAs in bacteria. Mol Microbiol. 2011;79(1):1–2. - PMC - PubMed

Publication types