

Impact of industrial production system parameters on chicken microbiomes: mechanisms to improve performance and reduce Campylobacter
- PMID: 32907634
- PMCID: PMC7488076
- DOI: 10.1186/s40168-020-00908-8
Impact of industrial production system parameters on chicken microbiomes: mechanisms to improve performance and reduce Campylobacter
Abstract
Background: The factors affecting host-pathogen ecology in terms of the microbiome remain poorly studied. Chickens are a key source of protein with gut health heavily dependent on the complex microbiome which has key roles in nutrient assimilation and vitamin and amino acid biosynthesis. The chicken gut microbiome may be influenced by extrinsic production system parameters such as Placement Birds/m2 (stocking density), feed type and additives. Such parameters, in addition to on-farm biosecurity may influence performance and also pathogenic bacterial numbers such as Campylobacter. In this study, three different production systems 'Normal' (N), 'Higher Welfare' (HW) and 'Omega-3 Higher Welfare' (O) were investigated in an industrial farm environment at day 7 and day 30 with a range of extrinsic parameters correlating performance with microbial dynamics and Campylobacter presence.
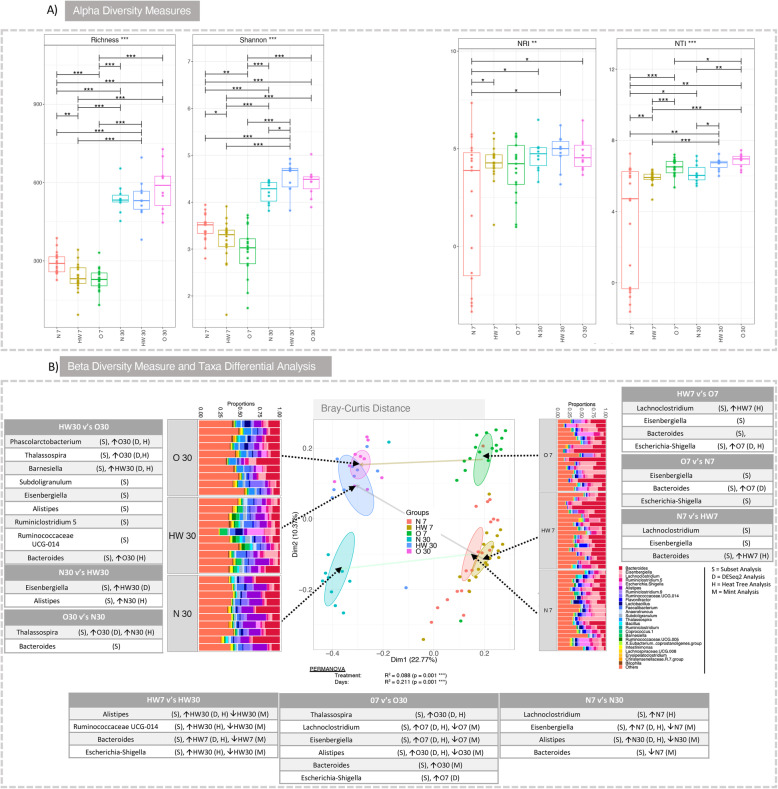
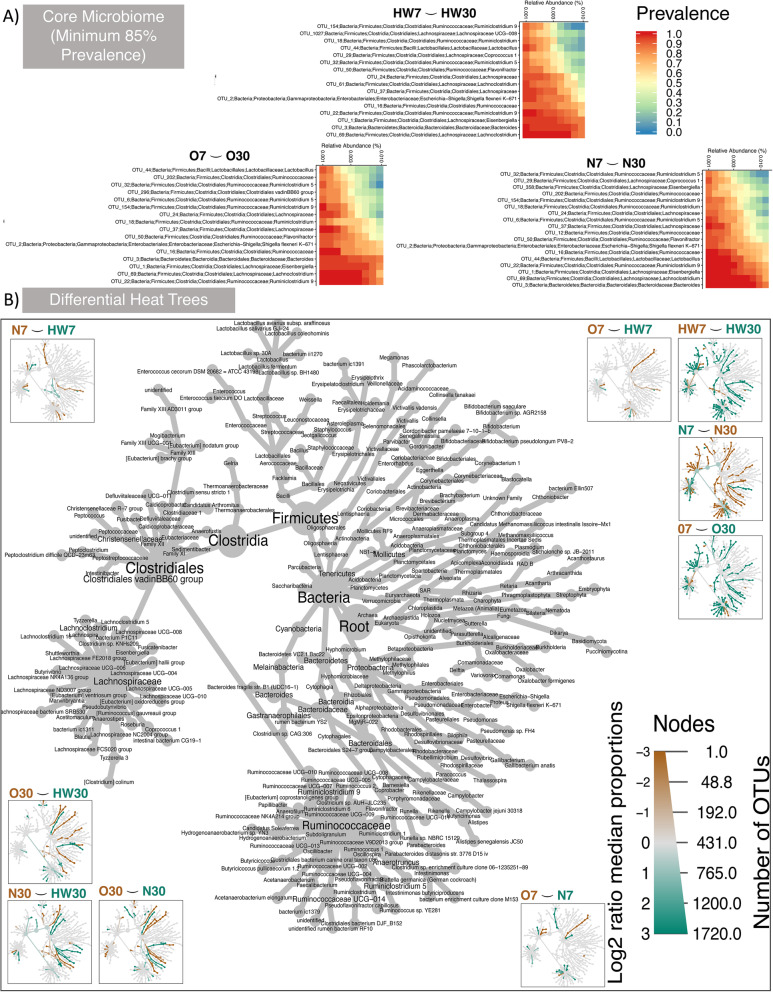
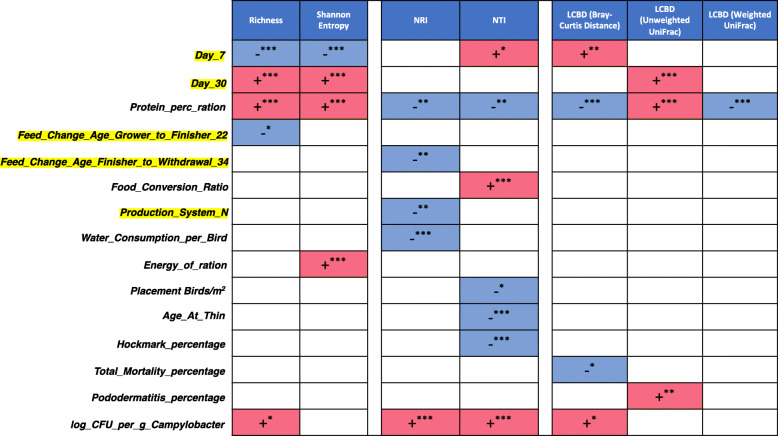
Results: Our data identified production system N as significantly dissimilar from production systems HW and O when comparing the prevalence of genera. An increase in Placement Birds/m2 density led to a decrease in environmental pressure influencing the microbial community structure. Prevalence of genera, such as Eisenbergiella within HW and O, and likewise Alistipes within N were representative. These genera have roles directly relating to energy metabolism, amino acid, nucleotide and short chain fatty acid (SCFA) utilisation. Thus, an association exists between consistent and differentiating parameters of the production systems that affect feed utilisation, leading to competitive exclusion of genera based on competition for nutrients and other factors. Campylobacter was identified within specific production system and presence was linked with the increased diversity and increased environmental pressure on microbial community structure. Addition of Omega-3 though did alter prevalence of specific genera, in our analysis did not differentiate itself from HW production system. However, Omega-3 was linked with a positive impact on weight gain.
Conclusions: Overall, our results show that microbial communities in different industrial production systems are deterministic in elucidating the underlying biological confounders, and these recommendations are transferable to farm practices and diet manipulation leading to improved performance and better intervention strategies against Campylobacter within the food chain. Video Abstract.
Keywords: Campylobacter; Chicken; Competitive exclusion; Diversity; Environmental filtering; Microbiome; Phylogenetic signal; Production systems.
Conflict of interest statement
AM, AR and UL are employed by company Moy Park. AM is enrolled on a Ph.D. programme at QUB and undertook research work at AFBI and Moy Park. All other authors declare no competing interests.
Figures
References
-
- FAO: Food outlook: biannual report on global food markets - November 2018. pp. 104: Rome; 2018:104.
-
- Stanley D, Hughes RJ, Moore RJ. Microbiota of the chicken gastrointestinal tract: influence on health, productivity and disease. Appl Microbiol Biotechnol. 2014;98:4301–4310. - PubMed
-
- Stanton AV, Shortall K, El-Sayed T, O’Donovan F, James K, Kennedy J, Hayes H, Fahey A, Dolan E, Williams D. Eating Omega-3 polyunsaturated fatty acid enriched chicken-meat and eggs results in increased plasma docosahexaenoic and eicosapentaenoic acid levels and an improved Omega-3-index. Circulation. 2017;136:A19913.
Publication types
MeSH terms
LinkOut - more resources
Full Text Sources
