. 2021 Jul;70(7):1345-1361.
doi: 10.1136/gutjnl-2019-319227. Epub 2020 Sep 9.

TREM-2 defends the liver against hepatocellular carcinoma through multifactorial protective mechanisms

Affiliations

TREM-2 defends the liver against hepatocellular carcinoma through multifactorial protective mechanisms

Aitor Esparza-Baquer et al. Gut. 2021 Jul.

Abstract

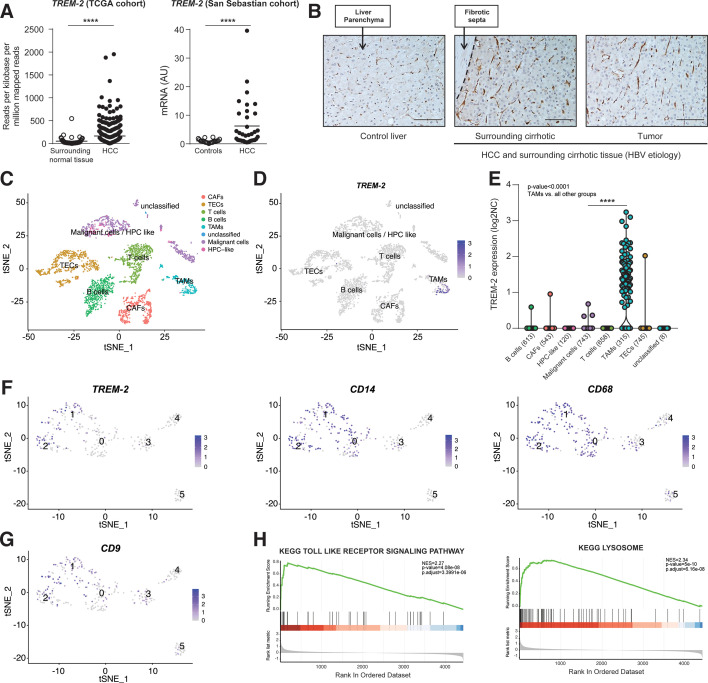
Objective: Hepatocellular carcinoma (HCC) is a prevalent and aggressive cancer usually arising on a background of chronic liver injury involving inflammatory and hepatic regenerative processes. The triggering receptor expressed on myeloid cells 2 (TREM-2) is predominantly expressed in hepatic non-parenchymal cells and inhibits Toll-like receptor signalling, protecting the liver from various hepatotoxic injuries, yet its role in liver cancer is poorly defined. Here, we investigated the impact of TREM-2 on liver regeneration and hepatocarcinogenesis.

Design: TREM-2 expression was analysed in liver tissues of two independent cohorts of patients with HCC and compared with control liver samples. Experimental HCC and liver regeneration models in wild type and Trem-2-/- mice, and in vitro studies with hepatic stellate cells (HSCs) and HCC spheroids were conducted.

Results: TREM-2 expression was upregulated in human HCC tissue, in mouse models of liver regeneration and HCC. Trem-2-/- mice developed more liver tumours irrespective of size after diethylnitrosamine (DEN) administration, displayed exacerbated liver damage, inflammation, oxidative stress and hepatocyte proliferation. Administering an antioxidant diet blocked DEN-induced hepatocarcinogenesis in both genotypes. Similarly, Trem-2-/- animals developed more and larger tumours in fibrosis-associated HCC models. Trem-2-/- livers showed increased hepatocyte proliferation and inflammation after partial hepatectomy. Conditioned media from human HSCs overexpressing TREM-2 inhibited human HCC spheroid growth in vitro through attenuated Wnt ligand secretion.

Conclusion: TREM-2 plays a protective role in hepatocarcinogenesis via different pleiotropic effects, suggesting that TREM-2 agonism should be investigated as it might beneficially impact HCC pathogenesis in a multifactorial manner.

Keywords: hepatocellular carcinoma; immune-mediated liver damage; liver immunology; liver regeneration; molecular carcinogenesis.


Conflict of interest statement

Competing interests: None declared.

Figures

Figure 1
Figure 1
TREM-2 expression is elevated in human HCC and is prominently expressed in tumour infiltrating macrophages. (A) qPCR analysis of TREM-2 expression in surrounding normal tissue and in HCC tissue (n=49 and 366, respectively) in the cohort from TCGA and in normal human liver (controls) and HCC samples (n=21 and 35, respectively) of the San Sebastian cohort. (B) Representative images of TREM-2 expression by immunohistochemistry in human healthy liver and diseased liver from a patient with an HCC tumour and its surrounding cirrhotic liver of HBV aetiology. Scale bars represent 100 µm. (C) t-SNE projection depicting cellular composition of human HCC tumours. Cells that share similar transcriptome profiles are grouped by colours and were annotated using lineage specific markers. (D and E) t-SNE plot depicting TREM-2 expression in TAMs (D) and corresponding Log2 normalised counts (Log2NC) TREM-2 expression values for all tumour infiltrating cells types (E). Shown in brackets are the number of cells analysed for each cell type post-data processing. (F and G) t-SNE projection post-reclustering of TAMs and TREM-2, CD14, CD68 (F) and CD9 (G) expression therein. (H) GSEA plots depicting enrichments in TLR signalling and lysosome pathways within TREM-2 expressing TAMs. The y-axis represents the enrichment score (ES) and vertical black lines on the x-axis shows where genes annotated to the respective pathways appear in the ranked list of genes. The coloured band represents the ES values (red for positive and blue for negative). (A) Non-parametric Mann-Whitney test was used. (E) One-way analysis of variance followed by Tukey’s post-test was used. ****Denotes a p value of <0.0001. AU, arbitrary units, CD, cluster of differentiation, GSEA, gene set enrichment analysis; HCC, hepatocellular carcinoma; qPCR, quantitative PCR; TAMs, tumour-associated macrophages; TCGA, the cancer genome atlas; TLR, Toll-like receptor; TREM-2, triggering receptor expressed on myeloid cells 2; tSNE, t-distributed Stochastic Neighbour Embedding.
Figure 2
Figure 2
Trem-2-/- mice exhibit increased hepatocyte damage, inflammation and oxidative stress in an acute DEN model. (A) Scheme depicting experimental outline of acute DEN in both genotypes of mice following injection with 100 mg/kg DEN (saline; n=6–7, DEN 6 hour; n=7, DEN 24 hours; n=10, DEN 72 hours; n=6–7). (B) Quantification of damaged livers of both genotypes at the indicated time points and representative H&E images. (C) Quantification of damaged hepatocytes at the indicated time points measured by manually counting γH2AX positive nuclei and representative IHC images. (D) ALT levels were determined in the serum post-DEN. (E) ROS was determined in liver tissue of WT and Trem-2-/- mice after 24 hours of DEN administration with the H2DCFDA dye. (F) mRNA levels of the chemokines Cxcl1 and Mcp1, the cytokine Tnf and the oxidative stress enzyme Hmox1 and the growth factor Hgf were determined. Parametric Student’s t-test and non-parametric Mann-Whitney test were used. Data represent mean±SEM and *, ** and **** denote a p value of <0.05,<0.01 and <0.0001, respectively. ALT, alanine aminotransferase; AU, arbitrary units; Cxcl1, C–X–C motif chemokine ligand 1; DEN, diethylnitrosamine; Hgf, hepatocyte growth factor; Hmox1, heme oxigenase 1; IHC, immunohistochemistry; Mcp1, monocyte chemoattractant protein 1; ROS, reactive oxygen species; Tnf, tumour necrosis factor; TREM-2, triggering receptor expressed on myeloid cells-2.
Figure 3
Figure 3
TREM-2 overexpression lowers liver injury, inflammation and oxidative stress in acute DEN. (A) Scheme depicting experimental outline for TREM-2 overexpression. C57BL/6 mice were intravenously injected with control or TREM-2 expressing adenoassociated viruses (1×10¹¹ pfu) and after 72 hours mice were intraperitoneally injected with 100 mg/kg DEN. Animals were sacrificed 72 hours post-DEN (n=10). (B) mRNA levels of Trem-2. (C) ALT, AST and AP levels were determined in the serum post-DEN. (D) ROS was determined in liver tissue of C57BL/6 mice 72 hours post-DEN administration with the H2DCFDA dye. (E) mRNA levels of the chemokine Mcp1 were determined. Parametric Student’s t-test and non-parametric Mann-Whitney test were used. Data represent mean±SEM and *, **, *** and **** denote a p value of <0.05,<0.01,<0.001 and <0.0001, respectively. AAV, adeno-associated viruses; ALT, alanine aminotransferase; AP, alkaline phosphatase; AST, aspartate aminotransferase; AU, arbitrary units; DEN, diethylnitrosamine; i.p., intraperitoneal; i.v., intravenous; Mcp1, monocyte chemoattractant protein 1; ROS, reactive oxygen species; TREM-2, triggering receptor expressed on myeloid cells 2.
Figure 4
Figure 4
Trem-2 null mice exhibit elevated tumourigenesis post-DEN. (A) Scheme depicting experimental outline of chronic DEN in both genotypes of mice following injection with 30 mg/kg DEN (n=14–17). (B) Diagram depicting antioxidant intervention with BHA during chronic DEN (n=7–12). (C) qPCR analysis of hepatic Trem-2 expression of 30 and 40 weeks DEN-injured mice and (D) qPCR analysis of Trem-2 expression in non-tumour versus tumour tissue in the liver of 30 and 40 weeks DEN-injured mice. (E) Representative pictures of the livers (arrows depict tumours) and total tumour number per mice are shown. (F) Representative liver pictures of DEN injured mice after 15 weeks of BHA diet (n=7–12) and tumour numbers herein. (C-E) Parametric Student’s t-test and non-parametric Mann-Whitney test were used. Data represent mean±SEM and *,**, *** and **** denote a p value of <0.05, <0.01, <0.001 and <0.0001. AU, arbitrary units; BHA, butylated hydroxyanisole; DEN, diethylnitrosamine; i.p., intraperitoneal; qPCR, quantitative PCR; TREM-2, triggering receptor expressed on myeloid cells 2; WT, wild type.
Figure 5
Figure 5
Trem-2 null mice exhibit increased numbers of proliferative and damaged hepatocytes post-DEN-induced carcinogenesis. (A) Total HCC tumour counting in DEN-injected WT and Trem-2-/- livers sacrificed after 30 weeks (n=16). (B and C) Microscopic analysis of WT and Trem-2-/- mice injected with 30 mg/kg DEN and sacrificed after 30 and 40 weeks fed with a normal or a BHA diet for 15 weeks (n=7–17). (B) Representative PCNA IHC images and quantification of proliferative hepatocytes measured by manually counting PCNA positive nuclei (20×) (C). Representative γH2AX IHC images and quantification of damaged hepatocytes measured by manually counting γH2AX positive nuclei (20×). Scale bars represent (A) 1000 µm and (B and C) 100 µm. (D) Correlation between the mRNA expression levels of Trem-2 and markers of fibrosis Col1a1 and Acta2 in the non-tumour liver tissue of DEN-administered WT mice sacrificed after 30 and 40 weeks (n=29). (A–C) Parametric Student’s t-test and non-parametric Mann-Whitney test were used. (D) Spearman’s correlation test was used. Data represent mean±SEM and *, ** and *** denote a p value of <0.05, <0.01 and <0.001, respectively. AU, arbitrary units; Acta2, actin alpha 2, smooth muscle; BHA, butylated hydroxyanisole; Col1a1, collagen type I alpha 1 chain; DEN, diethylnitrosamine; γH2AX, phospho-histone H2A.X; HCC, hepatocellular carcinoma; IHC, immuonohistochemistry; n.s, non-significant; PCNA, proliferating cell nuclear antigen; TREM-2, triggering receptor expressed on myeloid cells 2; WT, wild type.
Figure 6
Figure 6
Trem-2 null mice exhibit elevated carcinogenesis in fibrosis-associated HCC models. (A–D) WT and Trem-2-/- mice were injected with 30 mg/kg DEN followed by 10 weekly injections of CCl4 and sacrificed at 30 weeks post-DEN injection. (A) Scheme depicting experimental outline of DEN/CCl4 in both genotypes of mice (n=13–14). (B) Representative pictures of the livers (arrows depict tumours) and tumour number classified by size and per mouse are shown. (C) Liver fibrosis was analysed by Sirius red staining. Representative images (4×) and quantification by Image J software (10×) are shown. (D) Hepatic Pcna expression by qPCR of DEN/CCl4 treated WT and Trem-2-/- mice. (E–H) TAA (0.03% w/v) was administered to WT and Trem-2-/- mice for 40 weeks. (E) Scheme depicting experimental outline of TAA administration (n=9). (F) Representative pictures of the livers (arrows depict tumours) and total tumour volume (calculated with the formula Tv= (W x L)/2) per mouse are shown. (G) Liver fibrosis was analysed by Sirius red staining; representative images (4×) and quantification by Image J image analysis software (10×) are shown. (H) Hepatic Pcna expression by qPCR of WT and Trem-2-/- mice after TAA administration. Scale bars (C and G) represent 100 µm. Parametric Student’s t test and non-parametric Mann-Whitney test were used. Data represent mean±SEM and * denotes a p value of <0.05. AU, arbitrary units; CCl4, carbon tetrachloride; DEN, diethylnitrosamine; HCC, hepatocellular carcinoma; i.p., intraperitoneal; PCNA, proliferating cell nuclear antigen; qPCR, quantitative PCR; TAA, thioacetamide; TREM-2, triggering receptor expressed on myeloid cells 2; WT, wild type.
Figure 7
Figure 7
Role of TREM-2 in liver regeneration and hepatocyte proliferation after PHx. (A) Expression of hepatic Trem-2 in WT animals at the indicated time points post-PHx (n=3–4). (B–E) WT and Trem-2-/- mice were sham-operated or subjected to PHx and sacrificed at the indicated time points (n=3–6). (B) Representative IHC images of the PCNA proliferative marker 36 hours post-PHx (20×) and quantification of proliferating hepatocytes measured by counting PCNA positive nuclei. Scale bars represent 100 µm. (C) Representative images of the BRDU staining 36 hours post (20×) and quantification of proliferating hepatocytes measured by manually counting BRDU incorporation in nuclei. Scale bars represent 100 µm. (D) PCNA was determined by immunoblotting 72 hours post-PHx, and β-actin was used as house-keeping control (n=5). Representative images and quantification of the relative PCNA/β-actin levels are shown. (E) mRNA expression of the proinflammatory cytokine Tnf 1 hour after PHx (n=5–6), and cytokine Il6 and Hgf 6 hours following PHx (n=6–11). Parametric Student’s t test and non-parametric Mann-Whitney test were used. Data represent mean±SEM and *, **, *** denote a p value of <0.05,<0.01 and <0.001, respectively. AU, arbitrary units; BRDU, 5′-bromo-2′-deoxyuridine; Hgf, hepatocyte growth factor; IHC, immuonohistochemistry; Il6, interleukin 6, PCNA, proliferating cell nuclear antigen; PHx, partial hepatectomy; Tnf, tumour necrosis factor; TREM-2, triggering receptor expressed on myeloid cells 2; WT, wild type.
Figure 8
Figure 8
HCC spheroid culture in LX-2 conditioned media. (A) TREM-2 was overexpressed in LX-2 cells and expression efficiency determined by qPCR and immunoblotting (n=4). (B) Hep3B cells were seeded in hanging droplets for 7 days and forming spheroids were transferred to LX-2 conditioned media from either cells that were overexpressing TREM-2 or a control plasmid. Spheroid size was recorded (20×) using a Nikon eclipse TS100 microscope. (C) TNF and MCP1 and the mRNA levels of canonical Wnt ligands WNT3, WNT7A and WNT8A 24 hours post-TREM-2 overexpression. (D) Hep3B spheroids were incubated with the Wnt/β-catenin inhibitor IWR-1 in LX-2 conditioned media for 72 hours and spheroid growth was recorded as indicated. (E) LX-2 cells or Hep3B spheroids were incubated with the inhibitor of Wnt ligand secretion IWP-2, Hep3B spheroids were incubated in LX-2 conditioned media for 72 hours and spheroid growth was monitored as indicated. (A–C) Parametric Student’s t test and non-parametric Mann-Whitney test were used. (D and E) Kruskal-Wallis test followed by Dunn’s multiple comparison test for individual subgroup comparison was used. Data represent mean±SEM and *, ** and **** denote a p value of<0.05, 0.01 and <0.0001, respectively. Data in (A–E) are representative of at least two independent experiments. AU, arbitrary units; GAPDH, glyceraldehyde-3-phosphate dehydrogenase; HCC, hepatocellular carcinoma; HSC, hepatic stellate cells; MCP1, monocyte chemoattractant protein 1; n.s, non-significant; OE, overexpression; qPCR, quantitative PCR; SN, supernatant; TNF, tumour necrosis factor; TREM-2, triggering receptor expressed on myeloid cells 2.
Figure 9
Figure 9
TREM-2 modulates hepatocarcinogenesis in a multifactorial manner. Post-liver damage, Trem-2 absence leads to elevated DNA damage and hepatocyte death which provokes further DNA damage and augments inflammation and growth factor production. Conversely overexpression of TREM-2 dampens hepatic damage, inflammation and ROS, suggesting endogenous TREM-2 modulates hepatocellular injury in the initiation phase of HCC. TREM-2 expression in HSCs further impacts WNT ligand and cytokine expression/secretion, which impacts HCC growth. Recruitment of TREM-2+CD9+ monocyte-derived macrophages into HCC tumours is also depicted. Although the exact function of these cells remains to be elucidated, they are likely functionally similar to TREM-2 expressing KCs. Together, TREM-2’s expression in non-parenchymal and infiltrating cells and its associated effects may impact the mutational rate of proliferating hepatocytes, altering hepatocyte regeneration, transformation and dampening HCC development. HCC, hepatocellular carcinoma; ROS, reactive oxygen species; TREM-2, triggering receptor expressed on myeloid cells 2.

Comment in

Similar articles

Cited by

References

    1. Forner A, Reig M, Bruix J. Hepatocellular carcinoma. Lancet 2018;391:1301–14. 10.1016/S0140-6736(18)30010-2 - DOI - PubMed
    1. Aravalli RN. Role of innate immunity in the development of hepatocellular carcinoma. World J Gastroenterol 2013;19:7500–14. 10.3748/wjg.v19.i43.7500 - DOI - PMC - PubMed
    1. Turnbull IR, Gilfillan S, Cella M, et al. . Cutting edge: TREM-2 attenuates macrophage activation. J Immunol 2006;177:3520–4. 10.4049/jimmunol.177.6.3520 - DOI - PubMed
    1. Hamerman JA, Jarjoura JR, Humphrey MB, et al. . Cutting edge: inhibition of TLR and FcR responses in macrophages by triggering receptor expressed on myeloid cells (TREM)-2 and DAP12. J Immunol 2006;177:2051–5. 10.4049/jimmunol.177.4.2051 - DOI - PubMed
    1. Sharif O, Knapp S. From expression to signaling: roles of TREM-1 and TREM-2 in innate immunity and bacterial infection. Immunobiology 2008;213:701–13. 10.1016/j.imbio.2008.07.008 - DOI - PubMed

Publication types

MeSH terms