. 2020 Sep 9;11(1):4507.
doi: 10.1038/s41467-020-18272-4.

Substantial underestimation of SARS-CoV-2 infection in the United States

Affiliations

Substantial underestimation of SARS-CoV-2 infection in the United States

Sean L Wu et al. Nat Commun. .

Abstract

Accurate estimates of the burden of SARS-CoV-2 infection are critical to informing pandemic response. Confirmed COVID-19 case counts in the U.S. do not capture the total burden of the pandemic because testing has been primarily restricted to individuals with moderate to severe symptoms due to limited test availability. Here, we use a semi-Bayesian probabilistic bias analysis to account for incomplete testing and imperfect diagnostic accuracy. We estimate 6,454,951 cumulative infections compared to 721,245 confirmed cases (1.9% vs. 0.2% of the population) in the United States as of April 18, 2020. Accounting for uncertainty, the number of infections during this period was 3 to 20 times higher than the number of confirmed cases. 86% (simulation interval: 64-99%) of this difference is due to incomplete testing, while 14% (0.3-36%) is due to imperfect test accuracy. The approach can readily be applied in future studies in other locations or at finer spatial scale to correct for biased testing and imperfect diagnostic accuracy to provide a more realistic assessment of COVID-19 burden.


Conflict of interest statement

The authors declare no competing interests.

Figures

Fig. 1
Fig. 1. Daily SARS-CoV-2 tests per 1000 population in the United States by state and region.
SARS-CoV-2 testing rates in US states increased from close to 0 in early March to 6 per 1000 in Kansas to 31 per 1000 in Rhode Island by April 18, 2020. Generally, testing rates were higher in the Northwest and Northeast and lower in the Midwest and South. We estimated the cumulative population tested in each state by date by dividing the number of tests performed by 2019 population projections from the U.S. 2010 Census. Each open circle indicates the number of individuals tested in a state on a given day per 1000. Line, point, and text colors are based on quintiles of the distribution of testing per 1000 population on April 18, 2020 across all states. Testing quintile from lowest to highest is mapped to color from warmest to coolest (such that quintile 1, the lowest, maps to yellow (warmest), and quintile 5, the highest, maps to dark purple (coolest)). In each panel, state names are sorted in descending order by the population tested per 1000. Quality of daily estimates of the number of tests performed varied by state; see Supplementary Table 3 for details. See interactive plot at https://covid19epi.github.io/stats/.
Fig. 2
Fig. 2. Confirmed COVID-19 cases vs. estimated SARS-CoV-2 infections.
In each US state, confirmed COVID-19 case counts ranged from 0.4 to 12.2 per 1000, while estimated total infections ranged from 3.0 to 63.0 per 1000. a Gray bars indicate the median of sampled distribution of estimated infections from probabilistic bias analysis. b Ratio between estimated infections versus confirmed cases, with reveals underestimation of total SARS-CoV-2 infection burden according to our model. In (b), ratios in each state are colored by quintile in descending order, with the darkest shade of blue indicating the largest quintile, and the lightest shade of green indicating the lowest quintile. Analyses include cumulative confirmed COVID-19 case counts up to April 18, 2020. Estimated SARS-CoV-2 infections were from a Bayesian probabilistic bias analysis to correct for incomplete testing and imperfect test accuracy. Estimated infections include both symptomatic and asymptomatic infections. Horizontal black lines indicate the simulation interval for estimated infections (2.5th and 97.5th percentiles of the distribution of estimated infections for each state) which were computed via 104 Monte Carlo samples from the distribution of estimated SARS-CoV-2 infections in each state. Quality of daily estimates of the number of tests performed varied by state; see Supplementary Table 3 for details. See interactive plot at https://covid19epi.github.io/stats/.
Fig. 3
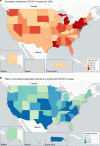
Fig. 3. Map of confirmed COVID-19 case counts and the ratio of expected infections.
Confirmed COVID-19 cases per 1000 and estimated SARS-CoV-2 infections per 1000 varied by US state and region. Map of confirmed COVID-19 case counts and the ratio of expected infections. Each panel displays colors defined by quintiles of the distribution of a confirmed COVID-19 cases per 1000 and b the ratio of the median of the distribution of estimated infections from the probabilistic bias analysis to confirmed COVID-19 cases. Analyses include cumulative confirmed COVID-19 case counts up to April 18, 2020. Estimated infections were from a using semi-Bayesian probabilistic bias analysis to correct for incomplete testing and imperfect test accuracy. Estimated SARS-CoV-2 infections include both symptomatic and asymptomatic infections. Quality of daily estimates of the number of tests performed varied by state; see Supplementary Table 3 for details. Underlying map from OpenStreetMap available under the Open Database License (https://www.openstreetmap.org/copyright). See interactive plot at https://covid19epi.github.io/stats/.

References

    1. Day, M. Covid-19: identifying and isolating asymptomatic people helped eliminate virus in Italian village. BMJ368, m1165 (2020). - PubMed
    1. Nishiura H, et al. Estimation of the asymptomatic ratio of novel coronavirus infections (COVID-19) Int J. Infect. Dis. 2020;94:154–155. doi: 10.1016/j.ijid.2020.03.020. - DOI - PMC - PubMed
    1. Qiu H, et al. Clinical and epidemiological features of 36 children with coronavirus disease 2019 (COVID-19) in Zhejiang, China: an observational cohort study. Lancet Infect. Dis. 2020;20:689–696. doi: 10.1016/S1473-3099(20)30198-5. - DOI - PMC - PubMed
    1. Lavezzo, E. et al. Suppression of a SARS-CoV-2 outbreak in the Italian municipality of Vo’. Nature10.1038/s41586-020-2488-1 (2020). - PubMed
    1. Zou L, et al. SARS-CoV-2 viral load in upper respiratory specimens of infected patients. N. Engl. J. Med. 2020;382:1177–1179. doi: 10.1056/NEJMc2001737. - DOI - PMC - PubMed

Publication types