. 2020 Sep 9;11(1):4510.
doi: 10.1038/s41467-020-18140-1.

The neuromuscular junction is a focal point of mTORC1 signaling in sarcopenia

Affiliations

The neuromuscular junction is a focal point of mTORC1 signaling in sarcopenia

Daniel J Ham et al. Nat Commun. .

Abstract

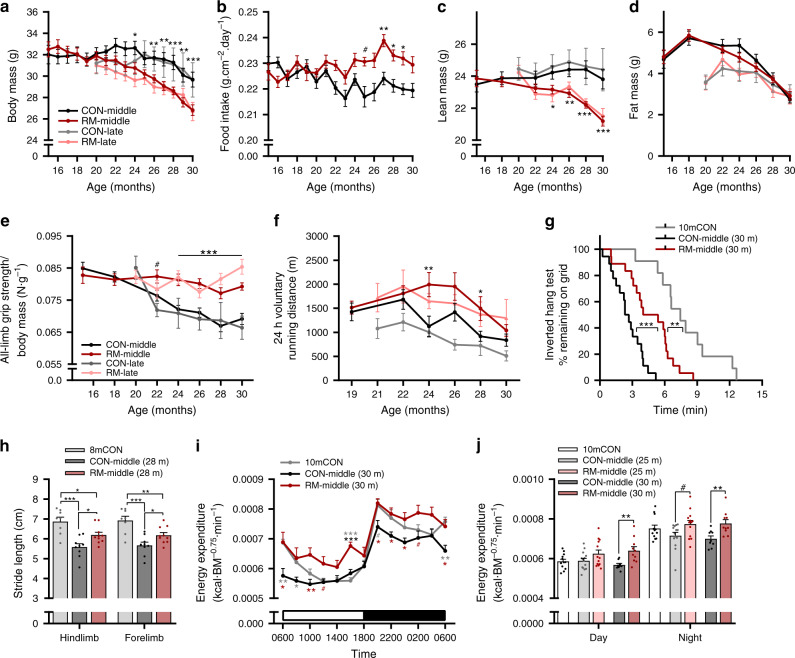
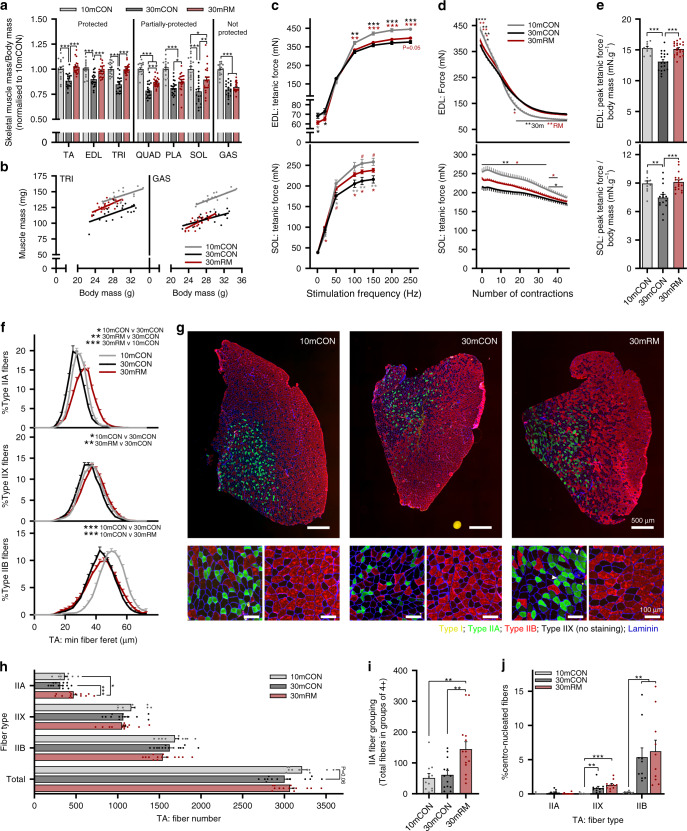
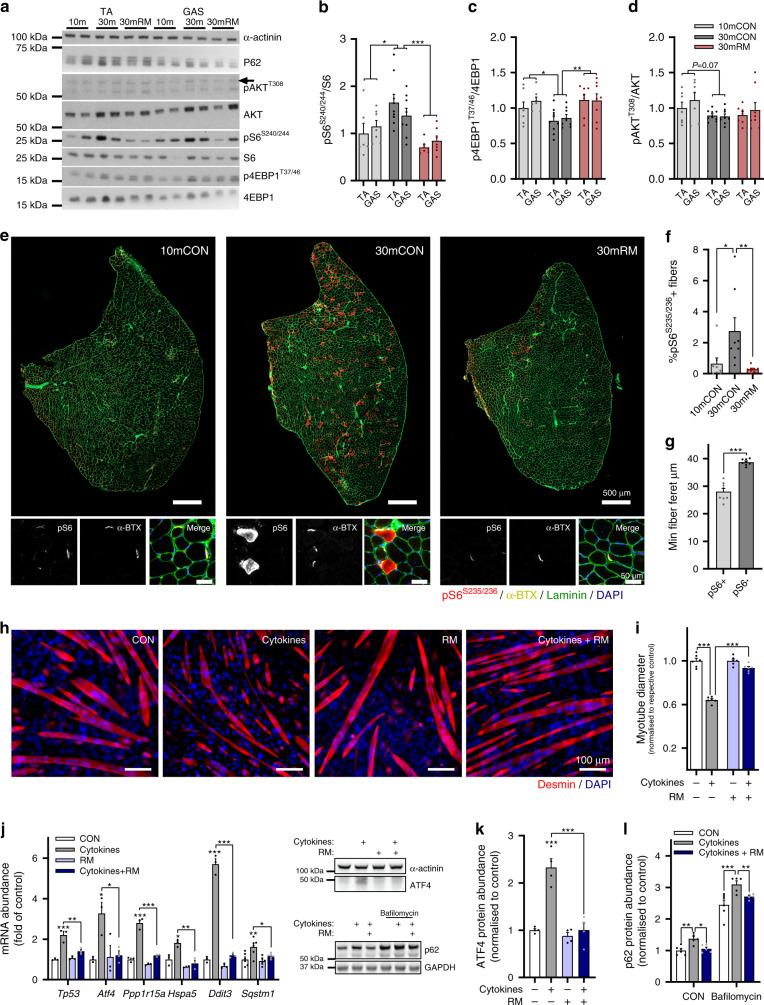
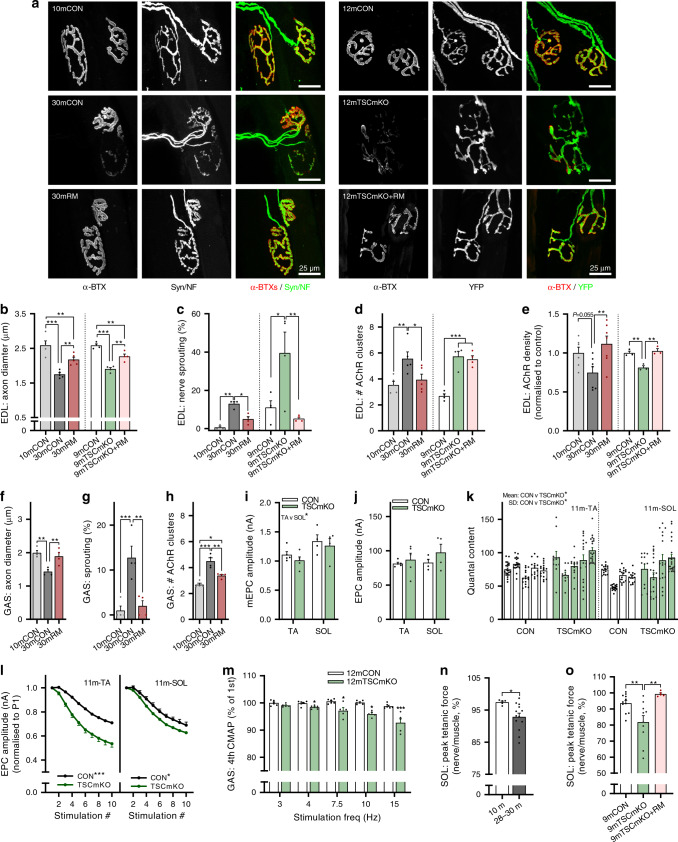
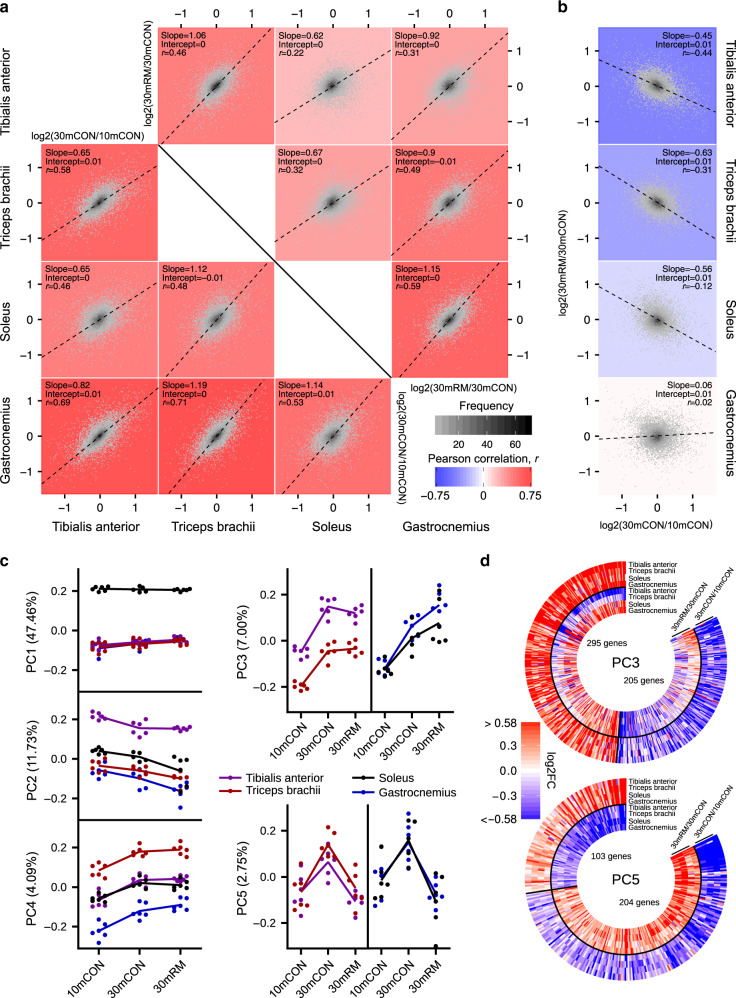
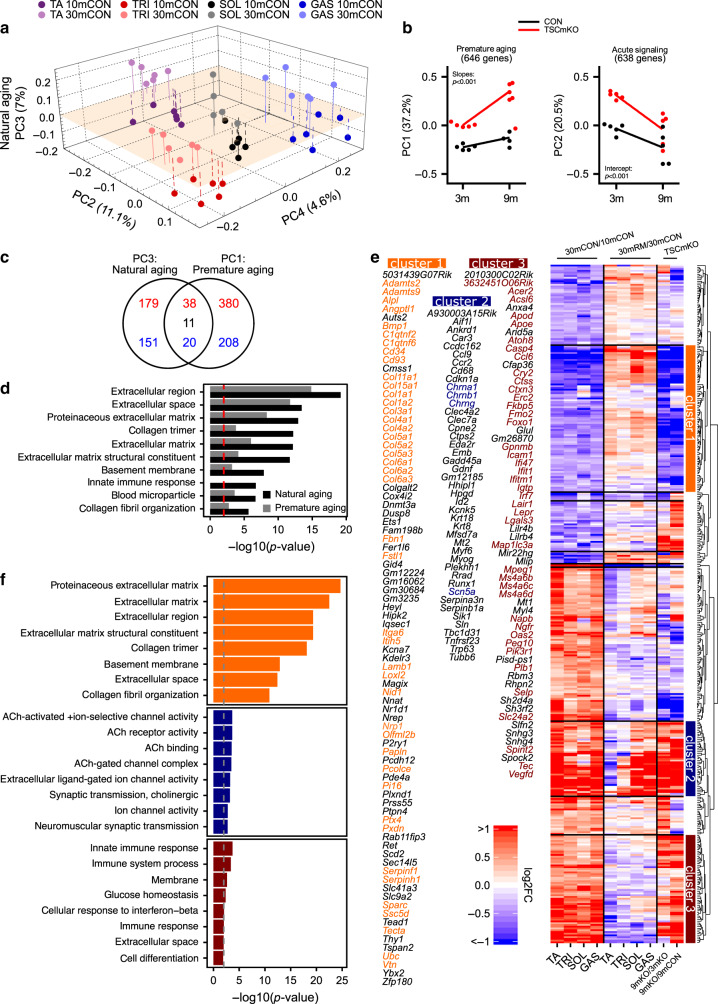
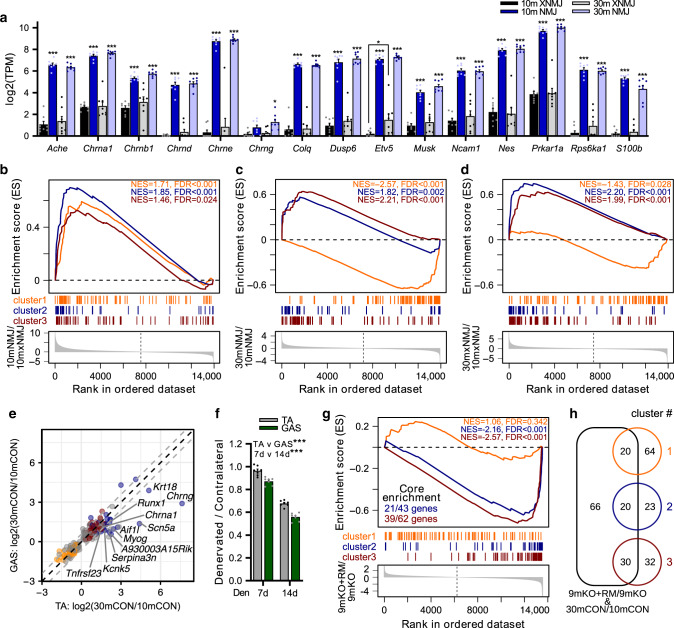
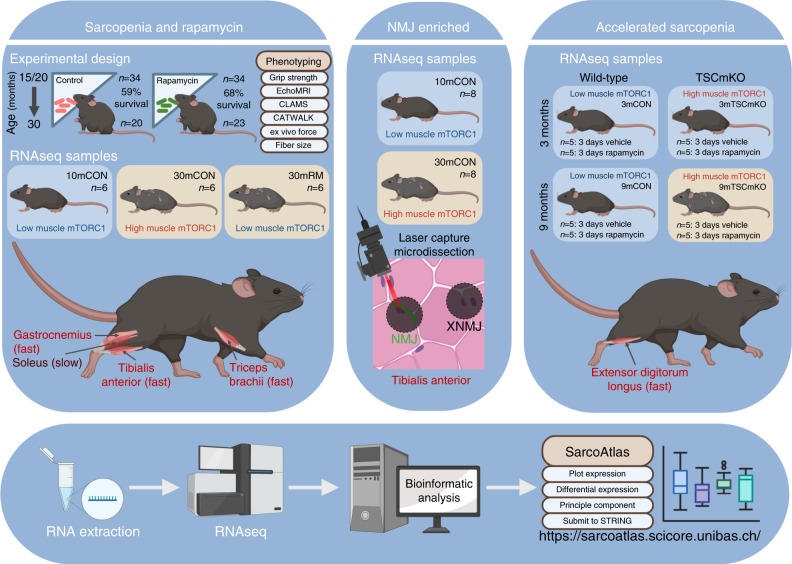
With human median lifespan extending into the 80s in many developed countries, the societal burden of age-related muscle loss (sarcopenia) is increasing. mTORC1 promotes skeletal muscle hypertrophy, but also drives organismal aging. Here, we address the question of whether mTORC1 activation or suppression is beneficial for skeletal muscle aging. We demonstrate that chronic mTORC1 inhibition with rapamycin is overwhelmingly, but not entirely, positive for aging mouse skeletal muscle, while genetic, muscle fiber-specific activation of mTORC1 is sufficient to induce molecular signatures of sarcopenia. Through integration of comprehensive physiological and extensive gene expression profiling in young and old mice, and following genetic activation or pharmacological inhibition of mTORC1, we establish the phenotypically-backed, mTORC1-focused, multi-muscle gene expression atlas, SarcoAtlas (https://sarcoatlas.scicore.unibas.ch/), as a user-friendly gene discovery tool. We uncover inter-muscle divergence in the primary drivers of sarcopenia and identify the neuromuscular junction as a focal point of mTORC1-driven muscle aging.


Conflict of interest statement

The authors declare no competing interests.

Figures

Fig. 1
Fig. 1. Rapamycin slows age-related decrements in whole-body muscle function and metabolism.
a Body mass for mouse groups receiving rapamycin (~4 mg kg−1 day−1) or control diet beginning at 15 months (CON-middle and RM-middle) or 20 months (CON-late and RM-late) of age; n = 18 (CON-middle), 17 (RM-middle), 5 (CON-late), and 9 (RM-late) mice. b Mean daily food intake for middle-aged groups; n = 18 (CON-middle) and 17 (RM-middle) mice. Bimonthly recordings of whole-body lean (c) and fat mass (d); n = 18 (CON-middle), 17 (RM-middle), 6 (CON-late), and 9 (RM-late) mice. e All-limb grip strength normalized to body mass; n = 19 (CON-middle), 18 (RM-middle), 6 (CON-late), and 9 (RM-late) mice. f Twenty-four hours of voluntary running-wheel distance; n = 16 (CON-middle), 15 (RM-middle), 6 (CON-late), and 9 (RM-late) mice. Note that improvements by rapamycin were similar, irrespective of the time of treatment onset. g Kaplan–Meier plot for the inverted grip-hang test performed prior to endpoint measures at 30 months of age for the middle-aged group; n = 11 (10mCON), 18 (CON-middle), and 18 (RM-middle) mice. h Gait analysis of forelimb- and hindlimb-stride length at 28 months of age for middle-aged groups; n = 8 (8mCON), 9 (CON-middle), and 10 (RM-middle) mice. i Whole-body metabolic analysis of energy expenditure normalized to body surface area reported every 2 h across one full day (white)/night (black) cycle in the month prior to endpoint measures and j mean day and night values recorded at 25 and 30 months of age for middle-aged groups; n = 12 (10mCON), 14 (25mCON), 13 (25mRM), 9 (30mCON), and 10 (30mRM) mice. Data are presented as mean ± SEM. For a, b, e, and f, both control groups (CON-late and CON-middle) and both RM groups (RM-late and RM-middle) were combined for statistical comparisons. Two-way repeated-measure ANOVA with Sidak or Tukey post hoc tests (af, ij), Mantel–Cox log rank (g), and one-way ANOVA with Fisher’s LSD post hoc tests (h) was used to compare the data. *, **, and *** denote a significant difference between groups of P < 0.05, P < 0.01, and P < 0.001, respectively. # denotes a trend where 0.05 < P < 0.10. Colored asterisks refer to the group of comparison.
Fig. 2
Fig. 2. Rapamycin attenuates the age-related loss of muscle size and function.
a Muscle mass for quadriceps (QUAD), gastrocnemius (GAS), tibialis anterior (TA), plantaris (PLA), extensor digitorum longus (EDL), soleus (SOL), and triceps brachii (TRI) was averaged across both limbs, normalized to body mass and then to 10-month-old control mice. b Scatterplot and linear regression of the relationship between body and muscle mass of a forelimb (TRI) and the non-rapamycin-responsive hindlimb (GAS) muscle. Isolated muscle function parameters, including (c) force-frequency curve, d fatigue response to multiple stimulations, and (e) peak force normalized to body mass for EDL (top panel) and SOL muscle (bottom panel). f Fiber-type-specific cross-sectional area analyzed on whole cross sections from TA muscle, stained with antibodies against type I (yellow), type IIA (green), and type IIB (red) fibers as well as laminin (blue), while fibers without staining were classified as IIX. g Representative images with magnification of IIA (green fiber, left bottom)-rich and IIB (red fiber, right bottom)-rich regions. White arrows indicate grouping (four or more neighboring fibers) of IIA fibers in rapamycin-treated mice. h Mean total and fiber-type-specific fiber number from whole TA cross sections. i Counts of IIA fibers in groups of four or more neighboring fibers, per cross section, and j the percentage of fibers with centralized nuclei. For f, between-group statistical comparisons were performed on the mean fiber minimum Feret. Group numbers for 10mCON are n = 17 (a, b), 10 (c, e: EDL), 11 (c, e: SOL), 8 (d: EDL), 9 (d: SOL), 11 (fi), and 9 (j) mice, for 30mCON n = 20 (a, b), 19 (ce: EDL), 15 (ce: SOL), 13 (fi), and 10 (j) mice, and for 30mRM n = 23 (a, b), 22 (ce: EDL), 18 (c, e: SOL), 17 (d: SOL), 14 (fi), and 10 (j) mice. Data are presented as mean ± SEM. One-way (a and ej) or two-way repeated- measure (c, d) ANOVAs with Fisher’s LSD or Tukey’s (when ANOVA was not significant) post hoc tests were used to compare between data. *, **, and *** denote a significant difference between groups of P < 0.05, P < 0.01, and P < 0.001, respectively. Colored asterisks refer to the group of comparison.
Fig. 3
Fig. 3. Rapamycin-sensitive mTORC1 activity increases in sarcopenic muscle fibers and drives muscle wasting in vitro.
a Representative western blot analysis of AKT-mTORC1 pathway components in 10mCON, 30mCON, and 30mRM in both the tibialis anterior (TA) and gastrocnemius (GAS) muscle. Similar results were obtained for each protein across three separate gels with different samples. Quantification of western blots showing the abundance of phosphorylated protein normalized to total protein for (b) S6, (c) 4EBP1, and (d) AKT. e Representative images of TA cross sections stained for pS6S235/236 (red), α-bungarotoxin (neuromuscular junctions (NMJs), yellow), laminin (green), and DAPI (blue), and magnification of regions containing NMJs. Scale bars in full-section and enlarged images are 50 µm and 5 µm, respectively. f Quantification of the percentage of pS6S235/236-positive fibers in 10mCON, 30mCON, and 30mRM groups. g Quantification of minimum fiber Feret for pS6S235/236-positive and pS6S235/236-negative fibers in 30-month-old TA muscle. h Representative images of C2C12 myotubes incubated for 24 h in differentiation media (CON) or media containing 10 nM rapamycin, 20 ng ml−1 TNFα, and 100 ng ml−1 IFNγ (cytokines) or cytokines and rapamycin (cytokines + RM), and i quantification of myotube diameter. j RT-qPCR analysis of genes associated with ER stress and muscle wasting in C2C12 myotubes after 6 h of incubation in CON, cytokines, rapamycin, or cytokines+rapamycin. k Quantification and representative western blot image (left, upper) of ATF4 protein abundance after 6 h of incubation in differentiation media with or without cytokines and rapamycin (RM). l Quantification of p62 protein abundance and representative western blot image (left, lower) in differentiation media (CON) or media containing the autophagy-flux inhibitor bafilomycin (200 nM) after 4 h of incubation in media with or without cytokines and rapamycin (24 h). Group numbers for b are n = 6 mice for TA and seven for GAS (10mCON), eight for 30mCON, and seven for 30mRM. For c and d, n = 7 mice (10mCON), eight (30mCON), seven for TA, and eight for GAS (30RM). For fg, n = 8. For hi, n = 6 wells across two separate experiments. For j, n = 6 wells. For k, n = 4 wells. For l, n = 6 (CON) and five (cytokines and cytokines+RM) wells. Data are mean ± SEM. Two-way repeated-measure ANOVAs with Sidak post hoc tests (bd, i), one-way ANOVAs with Fisher’s LSD (f), Tukey’s (j, k) post hoc tests, or student’s two-sided t test (g), were used to compare between data. *, **, and *** denote a significant difference between groups of P < 0.05, P < 0.01, and P < 0.001, respectively. Where 0.05 < P < 0.1, P values are reported.
Fig. 4
Fig. 4. Overactive mTORC1 drives neuromuscular junction (NMJ) instability and impairs NMJ function.
a Representative whole-mount images of the pre- (neurofilament/synaptophysin or YFP) and postsynapse (acetylcholine receptors (AChRs) stained using alpha bungarotoxin) in extensor digitorum longus (EDL) muscle for 10-month-old control (10mCON), 30-month-old (30mCON), and 30-month-old mice treated from 15 months with rapamycin (30mRM, left) and for 9-month-old control (9mCON), TSCmKO (9mTSCmKO), and TSCmKO + 4 weeks of rapamycin-treatment (TSCmKO+RM, right) mice. Morphological properties of whole-mount EDL NMJs, including b axon diameter, c the percentage of NMJs with sprouting axons, and d the number of postsynaptic AChR clusters for 9mTSCmKO and sarcopenic experiments. e Acetylcholine receptor density in EDL cross sections. fh Morphological properties of whole-mount GAS NMJs for 10mCON, 30mCON, and 30mRM mice. In situ electrophysiological readouts of individual NMJ transmission properties in the tibialis anterior (TA) and soleus (SOL) muscle of 11-month-old TSCmKO mice and littermate controls, including (i) miniature end- plate current (mEPC), j end-plate current (EPC), k quantal content, and l EPC over repeated stimulations. m EMG recordings of compound muscle action potential (CMAP) rundown over four consecutive stimulations in the GAS of 9-month-old TSCmKO mice and littermate controls at stimulation frequencies between 3 and 15 Hz. Nerve- relative to muscle-stimulated peak tetanic force in SOL nerve-muscle preparations in (n) 10- (n = 5) and 28–30-month-old (n = 13) wild-type mice, and (o) 9-month-old control (n = 11), TSCmKO (n = 10), and TSCmKO mice treated with rapamycin for 4 weeks (n = 5). Group numbers for 10mCON are n = 5 (b, d), 3 (c), 6 (e), and 4 (fh) mice. For 30mCON and 30mRM, n = 5 (b, d), 4 (c, fh), and 7 (e) mice. For 9mCON, 9mTSCmKO, and 9mTSCmKO+RM, n = 4 (bd) and 3 (e) mice. For 11mCON and 11mTSCmKO, n = 5 (TA: il) and 4 (SOL: il) mice. For m, n = 6 (12mCON) and 5 (12mTSCmKO) mice. For n, n = 5 (10m) and 13 (28–30 m). For o, n = 11 (9mCON), 10 (9mTSCmKO), and 5 (9mTSCmKO + RM) mice. Data are presented as mean ± SEM. One-way ANOVA with Fisher’s LSD post hoc test (bh, o), two-way (ij) or two-way repeated-measure ANOVA (l, m) with Fisher’s LSD post hoc test (m), or two-tailed independent student’s t test (n) were used to compare between data. *, **, and *** denote a significant difference between groups of P < 0.05, P < 0.01, and P < 0.001, respectively. Where 0.05 < P < 0.1, P values are reported.
Fig. 5
Fig. 5. Rapamycin exerts pro- and anti-aging stimuli.
a Pairwise comparisons of age- (30mCON/10mCON, under diagonal) and rapamycin-induced (30mRM/30mCON, above diagonal) gene expression changes between tibialis anterior (TA), triceps brachii (TRI), soleus (SOL), and gastrocnemius (GAS) muscles, and b pairwise comparisons of age- and rapamycin-induced gene expression changes within muscles with slope, intercept, and Pearson’s correlation coefficient (r) indicated. For a and b, each graph is a 2D-density plot with the plotting area divided into small fragments; the intensity of the gray color of each fragment represents the number of genes in that fragment. Black dashed lines correspond to directions of the highest variance (PC1) for comparisons with the slope “s” and intercept “i”. The color of the plotting area was defined by the strength of the Pearson correlation coefficient r. c Coordinates of principal components (PC1–5) for gene expression data collected in TA, TRI, SOL, and GAS in 10mCON, 30mCON, and 30mRM. n = 6 mice per group and muscle, except for SOL 30mCON where n = 5. Each dot corresponds to one muscle sample, from an individual animal. The numbers associated with the PCs indicate the fraction of the variance in transcript expression in samples along the corresponding PC. d Heatmaps of the changes in the expression of genes aligned with PCs 3 and 5, respectively. A gene was considered aligned with a PC if the absolute value of the Pearson correlation between the expression of the gene and PC coordinates was ≥0.4, and the absolute value of the z score of the projection of the gene expression on a PC was ≥1.96.
Fig. 6
Fig. 6. mTORC1 suppresses extracellular matrix (ECM) remodeling, promotes inflammation, and is involved in muscle responses to functional denervation.
a Coordinates of principal components (PC2–4) for gene expression data (TPM) collected in tibialis anterior (TA), triceps brachii (TRI), soleus (SOL), and gastrocnemius (GAS) from 10mCON and 30mCON mice. b Coordinates of PC1 and PC2 for gene expression data (TPM) generated from extensor digitorum longus (EDL) muscle of 3- and 9-month-old TSCmKO and littermate control mice. The numbers associated with the PCs indicate the fraction of the variance in gene expression in samples along the corresponding PC. Each dot corresponds to one muscle sample, from an individual animal. Linear regression analysis was used to compare slopes and intercepts. c Overlap of genes aligned with PC3 from a (natural aging) and PC1 from b (premature aging). A gene was considered aligned with a PC if the absolute value of the Pearson correlation coefficient between the expression of the gene and PC coordinates was ≥0.4, and the absolute value of the z score of the projection of the gene expression on a PC was ≥1.96. Red and blue numbers represent increasing and decreasing genes, respectively, while black numbers represent genes oppositely regulated between TSCmKO and sarcopenia data sets. d Top-ten DAVID gene ontology terms enriched (P < 0.01) for genes aligned to natural aging PC3 and the enrichment of these terms for genes aligned with premature aging PC1. e Heatmap of changes occurring during aging in the expression of genes aligned with natural aging PC3, i.e., common age-related gene-expression changes (30mCON/10mCON) in all four muscles, along with fold changes in these genes for 30mRM/30mCON, 9mTSCmKO/3mTSCmKO, and 9mTSCmKO/9mCON. Hierarchical clustering based on the Euclidean distance of these changes rendered 10 gene clusters, including three prominent clusters, now referred to as clusters 1, 2, and 3. Genes associated with clusters 1, 2, and 3 are listed. f Top-eight DAVID gene ontology terms enriched (P < 0.01) for gene clusters 1, 2, and 3, respectively. Enrichment significance threshold was set at P < 0.01 (gray and red dashed lines). Genes from clusters 1 to 3 contributing to the top enriched terms are colored. For TSCmKO data set n = 5 mice per group. For the sarcopenia data set, n = 6 mice per muscle per group, except for SOL 30mCON where one data point was removed due to a technical error. A modified Fisher’s exact test was used to determine significance.
Fig. 7
Fig. 7. The neuromuscular junction (NMJ) is a focal point of mTORC1-driven sarcopenic signaling.
a The expression of genes known to be enriched at the NMJ based on mRNA-seq data generated from synaptic (NMJ) and extra-synaptic (xNMJ) regions of TA muscle from 10-month-old (10m) and 30-month-old (30m) mice. NMJ and xNMJ samples were collected using laser-capture microdissection on α-bungarotoxin- stained cross sections. Gene set enrichment analysis (GSEA) comparing the expression of genes in (b) NMJ versus xNMJ regions of 10m mice. c NMJ regions of 30m versus 10m groups and d xNMJ regions of 30m versus 10m groups. The distribution of genes from clusters 1, 2, and 3 was examined in lists of genes ranked by the magnitude of changes between conditions. Significance was set at the false discovery rate (FDR) < 0.01. e Scatterplot of fold-change expression of genes aligned with the aging PC3 from Fig. 6a between 30m and 10m for gastrocnemius (GAS) and tibialis anterior (TA). Labeled genes show a > log2(1.5)-fold change between TA and all three other muscles. Genes from clusters 1, 2, and 3 are colored orange, red, and blue, respectively, while gray dots are genes aligned with aging PC3, but not belonging to clusters 1–3. f Muscle mass of TA and GAS muscles denervated for 7 or 14 days relative to the contralateral control leg. g GSEA comparing the distribution of genes from clusters 1–3 in the ranked list of gene expression changes between 9-month-old TSCmKO mice (9mKO) and 9-month-old TSCmKO mice subjected to 3 days of rapamycin (8 mg kg−1 day−1) treatment (9mKO+RM). For clusters significantly enriched, the number of genes reaching the “leading edge” threshold are indicated. h Venn diagram of genes differentially expressed between 9mKO+RM and 9mKO, and aligned with the aging PC3, and their overlap with genes in clusters 1–3. Group numbers are (ad) 8, (e) 6, (f) 7, and (g) 5. For (e), each dot represents the log-fold change between means of mice in each group. Data are means ± SEM. Two-way ANOVAs (a, f) with Tukey’s post hoc test (a) were used to compare between data. *, **, and *** denote a significant difference between groups of P < 0.05, P < 0.01, and P < 0.001, respectively.
Fig. 8
Fig. 8. SarcoAtlas.
A graphical representation of the experimental design, group numbers, treatment duration, and muscles analyzed for the three novel data sets generated, analyzed, and available through the user-friendly SarcoAtlas application (https://sarcoatlas.unibas.ch/). SarcoAtlas allows interested users to plot and extract expression data for a gene of interest, and perform principal component or differential expression analysis on any of the three novel data sets: (1) sarcopenia and rapamycin, (2) laser-capture microdissection of NMJ-enriched and non-NMJ (XNMJ) regions, and (3) TSCmKO model of accelerated sarcopenia. Furthermore, gene lists can be easily submitted to string to visualize interactions and investigate gene ontology. Figure created with BioRender.com.

References

    1. Janssen I, Shepard DS, Katzmarzyk PT, Roubenoff R. The healthcare costs of sarcopenia in the United States. J. Am. Geriatr. Soc. 2004;52:80–85. - PubMed
    1. Lopez-Otin C, Blasco MA, Partridge L, Serrano M, Kroemer G. The hallmarks of aging. Cell. 2013;153:1194–1217. - PMC - PubMed
    1. Stallone, G., Infante, B., Prisciandaro, C. & Grandaliano, G. mTOR and aging: an old fashioned dress. Int. J. Mol. Sci. 20, 2774 (2019). - PMC - PubMed
    1. Arriola Apelo SI, Lamming DW. Rapamycin: an inhibitor of aging emerges from the soil of Easter island. J. Gerontol. A Biol. Sci. Med. Sci. 2016;71:841–849. - PMC - PubMed
    1. Bodine SC, et al. Akt/mTOR pathway is a crucial regulator of skeletal muscle hypertrophy and can prevent muscle atrophy in vivo. Nat. Cell Biol. 2001;3:1014–1019. - PubMed

Publication types

MeSH terms

Substances