Observational Study
. 2020 Sep 9;11(1):4518.
doi: 10.1038/s41467-020-18325-8.

Rapid and dynamic processing of face pareidolia in the human brain

Affiliations
Observational Study

Rapid and dynamic processing of face pareidolia in the human brain

Susan G Wardle et al. Nat Commun. .

Abstract

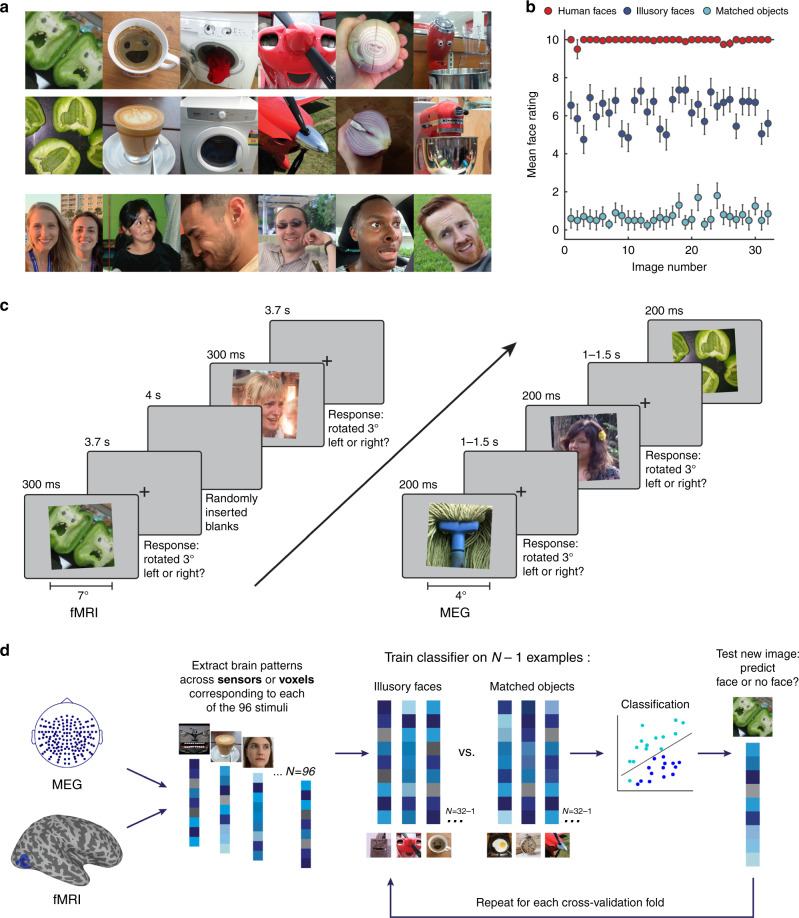
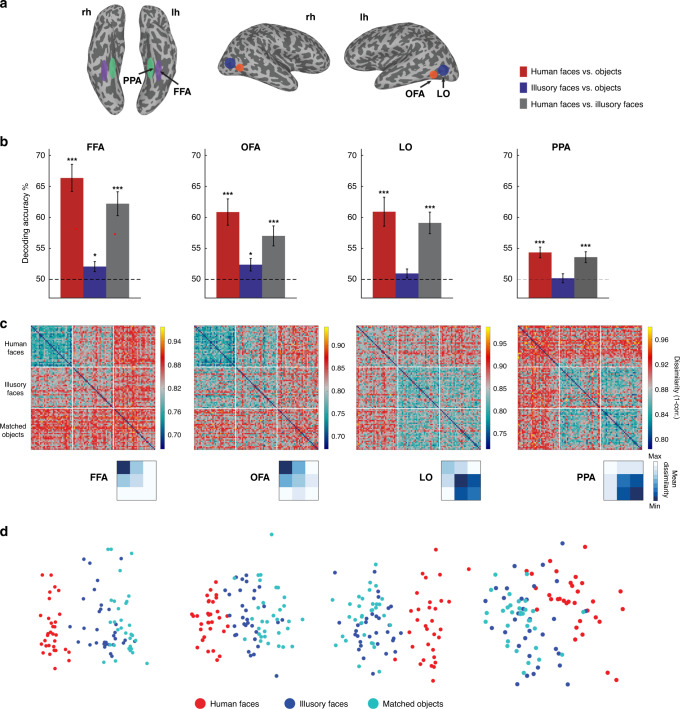
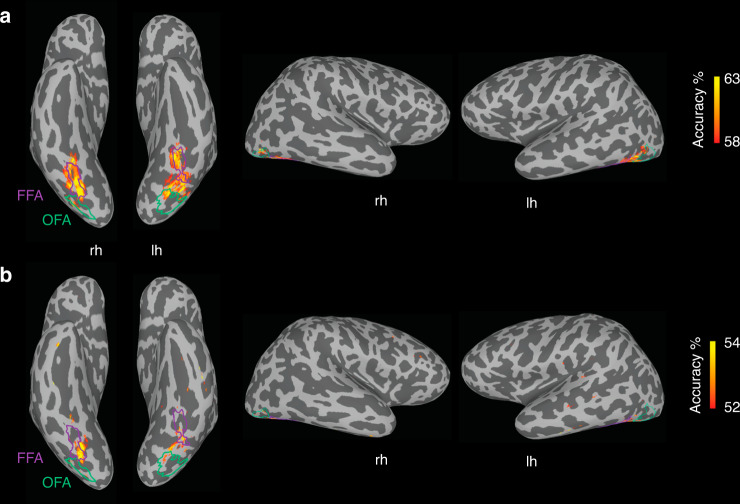
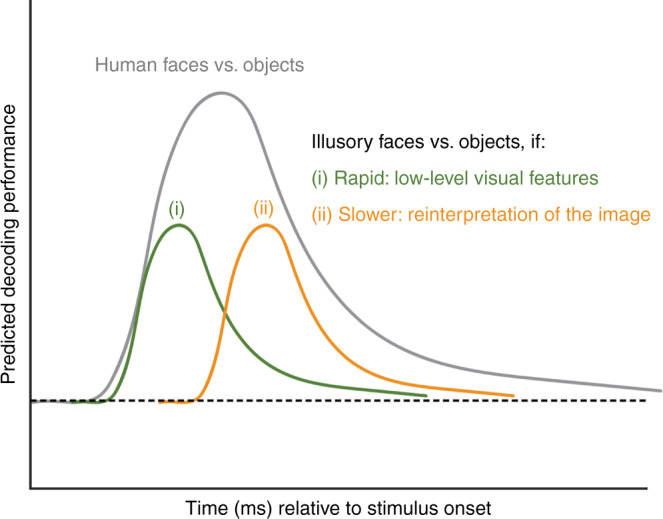
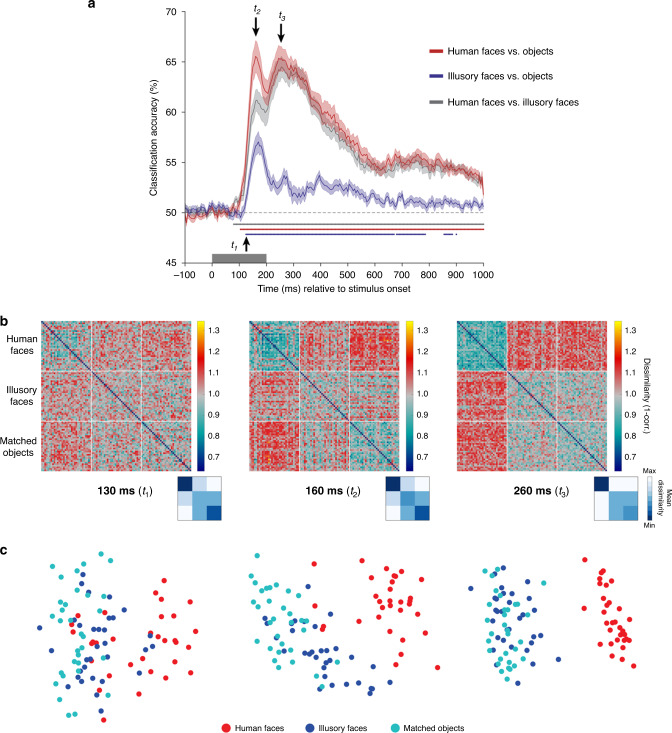
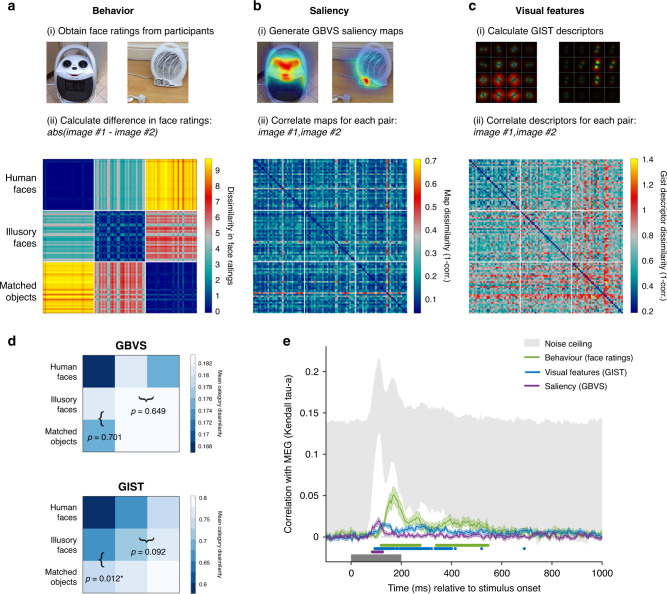
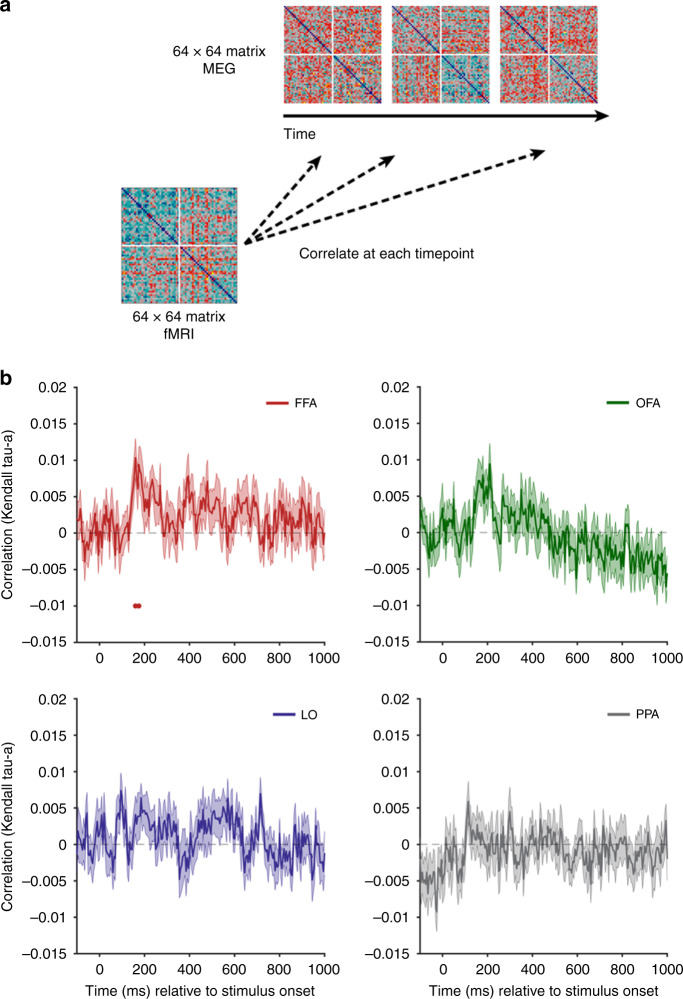
The human brain is specialized for face processing, yet we sometimes perceive illusory faces in objects. It is unknown whether these natural errors of face detection originate from a rapid process based on visual features or from a slower, cognitive re-interpretation. Here we use a multifaceted approach to understand both the spatial distribution and temporal dynamics of illusory face representation in the brain by combining functional magnetic resonance imaging and magnetoencephalography neuroimaging data with model-based analysis. We find that the representation of illusory faces is confined to occipital-temporal face-selective visual cortex. The temporal dynamics reveal a striking evolution in how illusory faces are represented relative to human faces and matched objects. Illusory faces are initially represented more similarly to real faces than matched objects are, but within ~250 ms, the representation transforms, and they become equivalent to ordinary objects. This is consistent with the initial recruitment of a broadly-tuned face detection mechanism which privileges sensitivity over selectivity.


Conflict of interest statement

The authors declare no competing interests.

Figures

Fig. 1
Fig. 1. Experimental design and analysis.
a Example visual stimuli from the set of 96 photographs used in all experiments. The set included 32 illusory faces, 32 matched objects without an illusory face, and 32 human faces. Note that the human face images used in the experiments are not shown in the figure because we do not have the rights to publish them. The original face stimuli used in the experiments are available at the Open Science Framework website for this project: https://osf.io/9g4rz. The human faces shown in this figure are similar photographs taken of lab members who gave permission to publish their identifiable images. See Supplementary Fig. 1 for all 96 visual stimuli. Full resolution versions of the stimuli used in the experiment are available at the Open Science Framework website for this project: https://osf.io/9g4rz. b Behavioral ratings for the 96 stimuli were collected by asking N = 20 observers on Amazon Mechanical Turk to “Rate how easily can you can see a face in this image” on a scale of 0–10. Illusory faces are rated as more face-like than matched nonface objects. Error bars are ±1 SEM. Source data are provided as a Source data file. c Event-related paradigm used for the fMRI (n = 16) and MEG (n = 22) neuroimaging experiments. In both experiments the 96 stimuli were presented in random order while brain activity was recorded. Due to the long temporal lag of the fMRI BOLD signal, the fMRI version of the experiment used a longer presentation time and longer interstimulus-intervals than the MEG version. To maintain alertness the participants’ task was to judge whether each image was tilted slightly to the left or right (3°) using a keypress (fMRI, mean = 92.5%, SD = 8.6%; MEG, mean = 93.2%, SD = 4.8%). d Method for leave-one-exemplar-out cross-decoding. A classifier was trained to discriminate between a given category pair (e.g., illusory faces and matched objects) by training on the brain activation patterns associated with all of the exemplars of each category except one, which was left out as the test data from a separate run for the classifier to predict the category label. This process was repeated across each cross-validation fold such that each exemplar had a turn as the left-out data. Accuracy was averaged across all cross-validation folds.
Fig. 2
Fig. 2. fMRI results showing sensitivity to illusory faces in face-selective cortex.
a Schematic visualization of the four functional regions of interest; each region was defined individually in each hemisphere of each subject from their functional localizer. b Results of cross-decoding (train and test the classifier on brain activity associated with different exemplars so generalization across stimuli is required) the three stimulus categories from four regions of interest. The mean decoding accuracy is shown, averaged over N = 16 participants. Asterisks indicate conditions with statistically significant decoding, evaluated using one-sample t-tests (one-tailed) and FDR adjusted *p values < 0.05, and ***p values < 0.001 to correct for multiple comparisons. The distinction between human faces and objects with (FFA: p = 0.00004, OFA: p = 0.0005, LO: p = 0.0002, PPA: p = 0.0008) or without an illusory face (FFA: p = 0.00001, OFA: p = 0.0002, LO: p = 0.0003, PPA: p = 0.0002) can be decoded from activation patterns in all regions. Illusory faces can be discriminated from similar matched objects from activity in FFA (p = 0.015) and OFA (p = 0.020) only, but not in LO (p = 0.11) and PPA (p = 0.40). Error bars are SEM. Source data are provided as a Source data file. c Representational dissimilarly matrices (96 × 96) for all stimuli for the four regions of interest. The dissimilarity is calculated by taking 1-correlation (Spearman) between the BOLD activation patterns for each pair of stimuli. The colorbar range is scaled to the max and min of the dissimilarity values for each ROI for visualization. White lines indicate stimulus category boundaries. Insets show 3 × 3 matrices for each ROI averaged by category, excluding the diagonal. Source data are provided as a Source data file. d Visualization of the dissimilarity matrices in (c) using multidimensional scaling. The first two dimensions following MDS are plotted, each of the points representing the 96 stimuli is colored according to its category membership. Proximity of the points represents more similar brain activation patterns for the stimuli. Note that in the FFA and OFA, the illusory faces are more separated from the matched objects and closer to the human faces compared to LO and PPA.
Fig. 3
Fig. 3. Localized sensitivity to illusory faces.
fMRI cross-decoding searchlight results for a human faces vs. objects and b illusory faces vs. objects. For both comparisons, the location of greatest decoding accuracy is within ventral temporal cortex and overlaps with FFA particularly in the right hemisphere. The location of greatest cross-decoding for illusory faces vs. matched objects (across exemplars) is a subset of the area for human faces vs. objects. For illustration, the approximate boundaries of functionally defined FFA (purple) and OFA (green) as defined by the location of overlapping surface nodes across individual participants (node inclusion threshold = 3/16 participants for OFA, 4/16 participants for FFA) are drawn on this example inflated surface for comparison with the searchlight results.
Fig. 4
Fig. 4. Schematic diagram showing predicted results for MEG cross-decoding of illusory faces vs. objects based on two possible accounts: (i) rapid processing based on low-level visual features (green line), or (ii), slower reinterpretation of the image (orange line).
Relative to decoding human faces vs. objects (gray line), performance is expected to be reduced because illusory face images share many more visual features with the matched object images than they do with human face images, thus brain activation patterns for these categories are expected to be less separable. See Fig. 5a for the empirical results.
Fig. 5
Fig. 5. MEG results showing a rapid transformation in the representation of illusory faces over time.
a Cross-decoding results across time for all three category comparisons. Mean classifier performance is plotted across time relative to stimulus onset, averaged over N = 22 participants. Shaded area represents SEM. Multiple comparisons were controlled for using Threshold-Free Cluster Enhancement as implemented in CoSMoMVPA. Stimulus duration is indicated by the gray bar from 0–200 ms on the x-axis. Chance performance is 50%, indicated by the dashed line. Colored disks along the x-axis indicate statistically significant timepoints. By 130 ms (t1) from stimulus onset, all three comparisons can be significantly decoded. There is an initial peak at ~160 ms (t2) for all comparisons, and a second peak ~260 ms (t3) for decoding human faces from all objects with or without a face, that is absent for decoding illusory faces from matched objects. These three timepoints of interest are used as the focus for the subsequent analyses. Source data are provided as a Source data file. b Representational dissimilarly matrices (96 × 96) for all stimuli for the three timepoints of interest (130, 160, and 260 ms post stimulus onset). The dissimilarity is calculated by taking 1-correlation (Spearman) between the MEG activation patterns for each pair of stimuli. The colorbar range is scaled to the max and min of the dissimilarity values across all timepoints for visualization (see Supplementary Movie 1 for complete time-varying RDM). White lines indicate stimulus category boundaries. Insets show 3 × 3 matrices for each time point averaged by category, excluding the diagonal. Source data are provided as a Source data file. c Visualization of the dissimilarity matrices in (b) using multidimensional scaling. The first two dimensions following MDS are plotted. Each of the points representing the 96 stimuli is colored according to its category membership. Proximity of the points represents more similar brain activation patterns for the associated stimuli.
Fig. 6
Fig. 6. Linking MEG representations to models of visual saliency, visual features, and behavior.
Construction of representational dissimilarity matrices for comparison with the MEG data for a visual saliency based on the GBVS model, b visual features based on the GIST model, and c behavior based on participants’ face ratings. Source data are provided as a Source data file. d Category-averaged RDMs were constructed for the saliency and visual feature models by averaging the mean dissimilarities for each exemplar in (a, b) respectively to produce 3 × 3 matrices. We tested (i) whether illusory faces were more similar to human faces than matched objects were and (ii) whether illusory faces were more similar to each other on average than to matched objects by subtracting the relevant squares in the category-averaged RDMs (marked with brackets). Reported p values are FDR corrected values (to control for multiple comparisons) from a two-sided permutation test (1000 permutations of the category labels of the original 96 × 96 RDM). Asterisks (*) indicate statistical significance at p < 0.05. e Correlation between the behavioral, saliency, and visual feature models in (ac) with the time-varying MEG dissimilarity matrix. Shaded area represents SEM. The noise ceiling marked in gray represents the estimate of the maximum correlation possible given the data. Statistically significant timepoints are indicated by colored disks along the x-axis. Multiple comparisons were controlled for using Threshold-Free Cluster Enhancement as implemented in CoSMoMVPA. The saliency model significantly correlates with the MEG data from 85–125 ms post stimulus onset. The main significant correlation between the visual feature model and the MEG data occurs from 95–400 ms, while the behavioral model correlates in two time-windows, from 120–275 and 340–545 ms. Source data are provided as a Source data file.
Fig. 7
Fig. 7. fMRI-MEG fusion.
a The fMRI dissimilarity matrices (1-correlation) for each of the four ROIs were correlated with the time-varying MEG dissimilarity matrix (1-correlation). Note that real human faces (n = 32) were removed from this analysis so the matrices are 64 × 64. b Results of fMRI-MEG fusion. The mean correlation between each of the RDMs for the four ROIs with the time-varying MEG RDM is plotted relative to stimulus onset, averaged over N = 22 participants. Statistical significance is indicated by colored disks along the x-axis. Error is SEM. Source data are provided as a Source data file.

Similar articles

Cited by

References

    1. Grill-Spector K, Weiner KS, Kay K, Gomez J. The functional neuroanatomy of human face perception. Annu. Rev. Vis. Sci. 2017;3:102016–061214. - PMC - PubMed
    1. Taubert J, Wardle SG, Flessert M, Leopold DA, Ungerleider LG. Face pareidolia in the rhesus monkey. Curr. Biol. 2017;27:2505–2509.e2. - PMC - PubMed
    1. Taubert J, et al. Amygdala lesions eliminate viewing preferences for faces in rhesus monkeys. Proc. Natl. Acad. Sci. USA. 2018;115:8043–8048. - PMC - PubMed
    1. Puce A, Allison T, Gore JC, McCarthy G. Face-sensitive regions in human extrastriate cortex studied by functional MRI. J. Neurophysiol. 1995;74:1192–1199. - PubMed
    1. Kanwisher N, McDermott J, Chun MM. The fusiform face area: a module in human extrastriate cortex specialized for face perception. J. Neurosci. 1997;17:4302–4311. - PMC - PubMed

Publication types