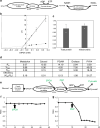
. 2020 Sep 9;11(1):4509.
doi: 10.1038/s41467-020-18234-w.

A moonlighting role for enzymes of glycolysis in the co-localization of mitochondria and chloroplasts

Affiliations

A moonlighting role for enzymes of glycolysis in the co-localization of mitochondria and chloroplasts

Youjun Zhang et al. Nat Commun. .

Abstract

Glycolysis is one of the primordial pathways of metabolism, playing a pivotal role in energy metabolism and biosynthesis. Glycolytic enzymes are known to form transient multi-enzyme assemblies. Here we examine the wider protein-protein interactions of plant glycolytic enzymes and reveal a moonlighting role for specific glycolytic enzymes in mediating the co-localization of mitochondria and chloroplasts. Knockout mutation of phosphoglycerate mutase or enolase resulted in a significantly reduced association of the two organelles. We provide evidence that phosphoglycerate mutase and enolase form a substrate-channelling metabolon which is part of a larger complex of proteins including pyruvate kinase. These results alongside a range of genetic complementation experiments are discussed in the context of our current understanding of chloroplast-mitochondrial interactions within photosynthetic eukaryotes.


Conflict of interest statement

The authors declare no competing interests.

Figures
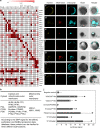
Fig. 1
Fig. 1. The protein–protein interaction of Arabidopsis glycolytic enzymes.
a The protein interactions calculated fold change in the heatmap. The novel complex of phosphoglycerate mutase 1–enolase–PYK4 complex could be detected. The star mark was represented fold change more than four times compared with GFP control. b Sublocation of all the glycolysis according to the SUBA4 database mitochondria proteomics data and GFP signal. c NE-TPT/PGAM1-CE. d NE-TPT/PGAM2-CE. e Enolase-NE/PGAM1-CE. f Enolase-NE/PGAM2-CE. g Enolase-NE/PYK4-CE. h VDAC1-NE/PYK4-CE. i VDAC3-NE/PYK4-CE. Confirmation of phosphoglycerate mutase 1–enolase–PYK4 complex with membrane protein (chloroplast TPT and mitochondria VDAC) by bimolecular fluorescent complementation (BiFC) assay. Interactions among chloroplast and mitochondria membrane protein and phosphoglycerate mutase 1–enolase–PK4 complex were further tested by BiFC with transient expression of tagged proteins in Arabidopsis mesophyll protoplasts. NE is the N-terminal of the split-mCitrine, CE is the C-terminal of the split-mCitrine. The panels from the left side show the BiFC fluorescence, fluorescence from bright-field image, MitoTracker Red staining, autofluorescence, blank, and the merged image of all of those, respectively. j Confirmation of protein–protein interaction by split Renilla luciferase assay. Interactions among chloroplast and mitochondria membrane protein and phosphoglycerate mutase–enolase–pyruvate kinase complex were further confirmed by split Renilla luciferase with transient expression of tagged proteins in Arabidopsis mesophyll protoplasts. One-way ANOVA analysis by enolase/GFP as a negative control (*P < 0.05, SD). PGM phosphoglucomutase, HXK hexokinase, PGI phosphoglucose isomerase, PFK phosphofructokinase, ALD aldolase, TPI tripsephosphate isomerase, GAPDH glyceraldehyde phosphate dehydrogenase, PGK phosphoglycerate kinase, ENO enolase, PYK pyruvate kinase, PGAM phosphoglycerate mutase, TPT triose phosphate translocator, VDAC voltage-dependent anion channel.
Fig. 2
Fig. 2. The protein–protein interaction among the phosphoglycerate mutase 1–enolase–PK4 complex and VDAC.
a mCitrine-TPT/PGAM1-mcherry. b Enolase-mCitrine/PGAM1-mcherry. c Enolase-mCitrine/PGAM2-mcherry. d Enolase-mCitrine/PYK4-mcherry. e VDAC1-mCitrine/PYK4-mcherry. f VDAC3-mCitrine/PYK4-mcherry. Co-sublocalization of phosphoglycerate mutase 1–enolase–PYK4 complex with organelles’ membrane protein was further tested by confocal with transient expression of tagged proteins in Arabidopsis leaves. The panels from the left side show the mCitrine fluorescence, mCherry fluorescence autofluorescence, blank, and the merged image of all of those, respectively. g Confirmation of protein–protein interaction by FLIM-FRET assays. All the vectors of the co-sublocalization were transformed into plant cell culture for the FLIM-FRET analysis. The Los2-mcitrine/mCherry was used as negative control (*P < 0.05, error bar is SEM with more than 10 replicates).
Fig. 3
Fig. 3. The glycolytic enzyme complex between mitochondria and chloroplast in vivo.
a Confirmation of protein complex with two organelles by three protein co-sublocalization. The enolase-mCitrineCE and IPGAM1-mCitrineNE and PYK4-mCherry were coexpressed in the Arabidopsis leaves. The novel complex present strong signal between mitochondria and chloroplast. b The summary of protein–protein interaction. MPC mitochondrial pyruvate carrier, TPT triose phosphate translocator, VDAC voltage-dependent anion channel, CBC Calvin–Benson–Bassham cycle.
Fig. 4
Fig. 4. The function of the phosphoglycerate mutase–enolase–pyruvate kinase complex in isolated plant mitochondria.
a Mechanism of the enzyme activity measurement. The NADH degradation ratio was measured at OD340 and calculated as −V. b Using the Michaelis–Menten equation to analyze the protein complex and the glycolytic free enzymes. The substrate concentration that produces a Vi that is one-half of Vmax is designated the Michaelis–Menten constant, KM. The filled symbols are data from the isolated mitochondria fraction. The open symbols are data from the total extra-plastidial protein extracts. c Protein concentration measured by anti-enolase western blotting. Five micrograms of total protein and 5µg of mitochondrial protein were loaded to get the same amount of enolase at two times western blotting. d All the character of each enzyme and protein complex. The phosphoglycerate mutase–enolase–pyruvate kinase complex has lower KM and 19 times efficiency compared with free enzyme. e Schematic representation of the isotope dilution experiment to assess the channeling of 2PGA and PEP. 13C-labeled glucose was incubated to yeast HXK, PGI, PFK, ALD, TPI, GAPDH, GAPDH, and PGK with ATP and NAD+ for 2h, and then fed to isolate Arabidopsis mitochondria and the label accumulation in pyruvate was monitored. Non-labeled 2PGA and PEP were added into the medium once the fractional enrichment of 13C label in pyruvate had reached steady state. In the case of channeling, the addition of non-labeled intermediates does not affect the subsequent labeling of pyruvate. f The result of isotope dilution experiments for 2PGA. The time-course plot shows the ratio in fractional 13C enrichment in pyruvate compared with the unlabeled pyruvate at different time points. The metabolite is considered to be channeled when the confidence interval line is ~1. g The result of isotope dilution experiments for PEP. The metabolite is considered not to be channeled when the confidence interval line is <1.
Fig. 5
Fig. 5. The association of mitochondria and chloroplast.
The mitochondria associated at middle of the day (MD) in wild type (a); pgam1/2 (b), sdmA-pgam1/2 (c), the double mutant complemented by native promoter with non-functional phosphoglycerate mutase); enolase-2 (d). The cyan fluorescence is the mitochondria. Purple is the autofluorescence. Yellow represents the unassociated mitochondria and white represents associated mitochondria, respectively. e the difference of mitochondria associated between WT and mutants. Enolase-2 and enolase-4 are two mutants of enolase. nA-enolase-2 is the enolase-2 complemented by native promoter with nuclear target enolase. One-way ANOVA analysis by WT_MD as control (*P < 0.05, **P < 0.01, SD). MN middle of the night, pgam1/2 double mutant of phosphoglycerate mutase 1 and phosphoglycerate mutase 2, sdmA-pgam1/2 the double mutant complemented by native promoter with non-functional phosphoglycerate mutase), nA nuclear targeted. Note: scale bar is different in each figure. White arrow is used to highlight the most important points within each panel.
Fig. 6
Fig. 6. The analysis of mitochondrial movement in the plant mature leaves.
Mitochondrial movement analysis 1 min at middle of the day (MD) in wild type (a), pgam1/2 (b), sdmA-pgam1/2 (c), and enolase-2 (d). The mitochondria of WT and sdmA-pgam1/2 mostly move around the chloroplast, while the mitochondria of mutants randomly and disorderly moved in the cell. Kymograph of the mitochondrial movement at MD in wild type (e), pgam1/2 (f), sdmA-pgam1/2 (g), and enolase-2 (h). The mitochondria attached to the chloroplast at 10–15 s and move to other place both in WT and sdmA-pgam1/2, while there is not attachment between mitochondria and chloroplast in other mutant. i Displacement length of all the lines. Displacement is the mitochondria move distance at the 1 min detected time. One-way ANOVA analysis by WT_MD as control for samples of MD or WT_MN as control samples of MN (*P < 0.05, **P < 0.01, SEM) and mutant’s MD was compared with MN. MN middle of the night, pgam1/2 double mutant of phosphoglycerate mutase 1 and phosphoglycerate mutase 2, sdmA-pgam1/2 the double mutant complemented by native promoter with non-functional phosphoglycerate mutase), nA nuclear targeted. Note: scale bar is different for each figure.
Fig. 7
Fig. 7. The association of mitochondria and chloroplast was significantly decreased by the enolase inhibitor.
a The mitochondria associated at wild type treated with mock ~40 min. b The mitochondria associated at wild type treated with enolase inhibitor (ENOblock hydrochloride) ~40 min. c The difference of mitochondria associated after treating with mock and ENOblock. One-way ANOVA analysis (**P < 0.01, SD). d Mitochondrial movement analysis after treating with mock and ENOblock. One-way ANOVA analysis (P < 0.01, SD). Note: scale bar is different for each figure. White arrow is used to highlight the most important points within each panel.

Similar articles

Cited by

References

    1. Kohler R. The background to Eduard Buchner’s discovery of cell-free fermentation. J. Hist. Biol. 1971;4:35–61. - PubMed
    1. Plaxton WC. The organization and regulation of plant glycolysis. Annu. Rev. Plant Biol. 1996;47:185–214. - PubMed
    1. Sweetlove LJ, Fernie AR. The role of dynamic enzyme assemblies and substrate channelling in metabolic regulation. Nat. Commun. 2018;9:2136. - PMC - PubMed
    1. Fernie AR, Zhang Y, Sweetlove LJ. Passing the baton: substrate channelling in respiratory metabolism. Research. 2018;2018:1539325. - PMC - PubMed
    1. Araiza Olivera D, et al. A glycolytic metabolon in Saccharomyces cerevisiae is stabilized by F-actin. FEBS J. 2013;280:3887–3905. - PubMed

Publication types

MeSH terms