. 2020 Sep 9;11(1):4520.
doi: 10.1038/s41467-020-18298-8.

Collagen promotes anti-PD-1/PD-L1 resistance in cancer through LAIR1-dependent CD8+ T cell exhaustion

Affiliations

Collagen promotes anti-PD-1/PD-L1 resistance in cancer through LAIR1-dependent CD8+ T cell exhaustion

David H Peng et al. Nat Commun. .

Abstract

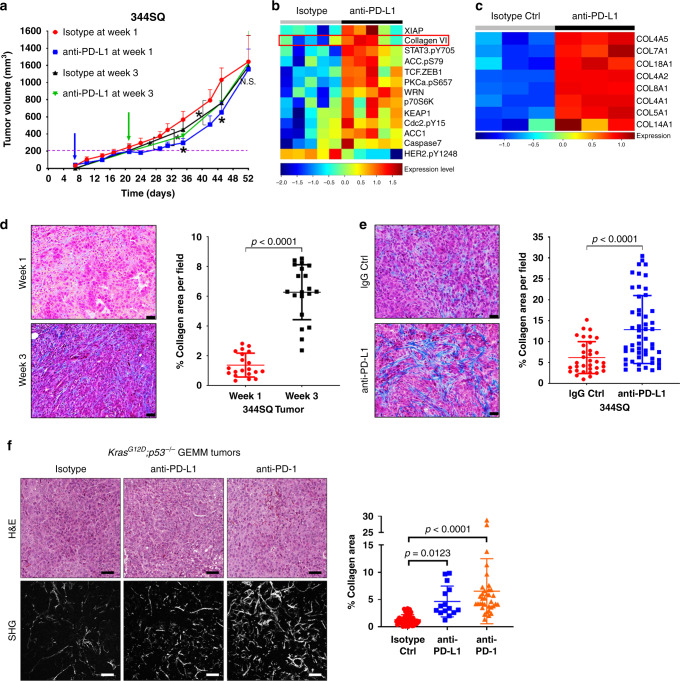
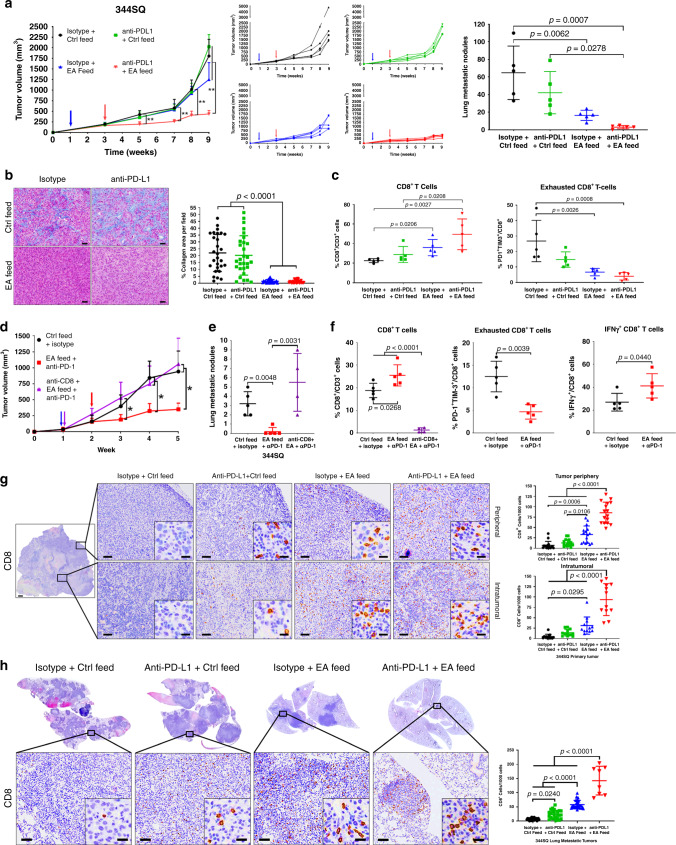
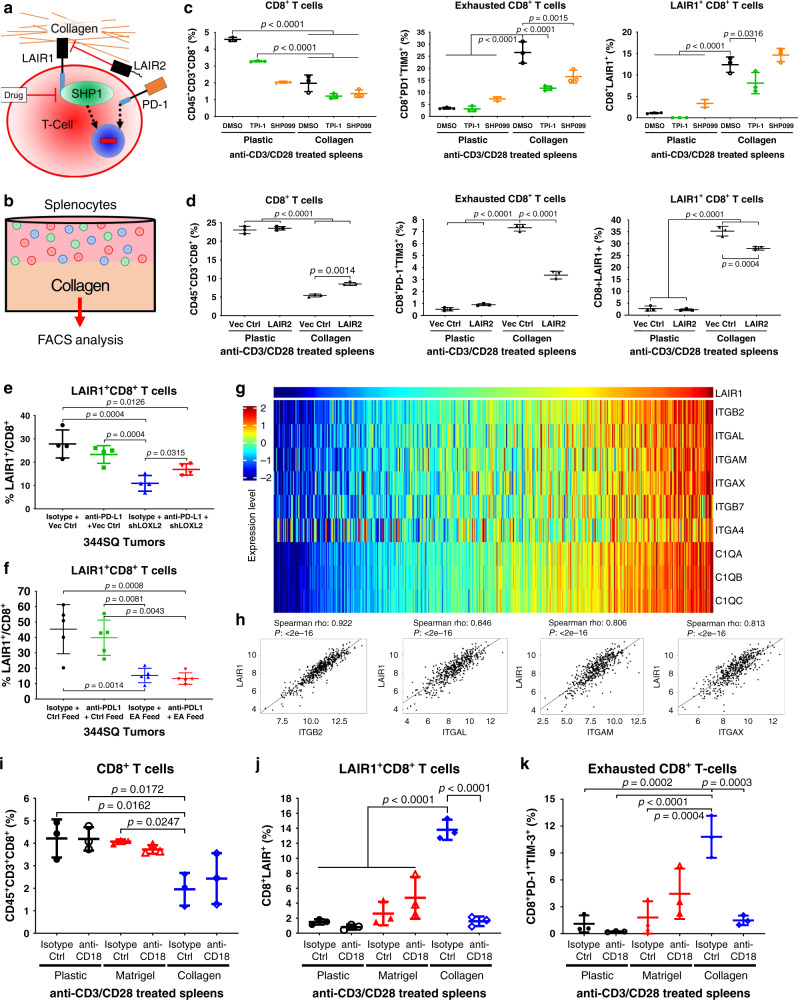
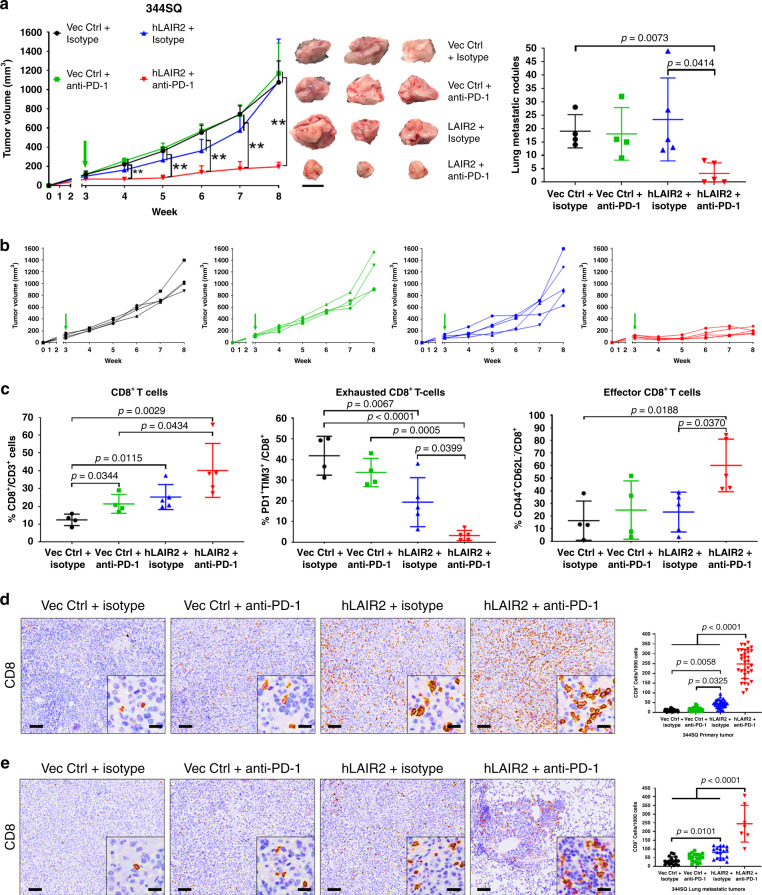
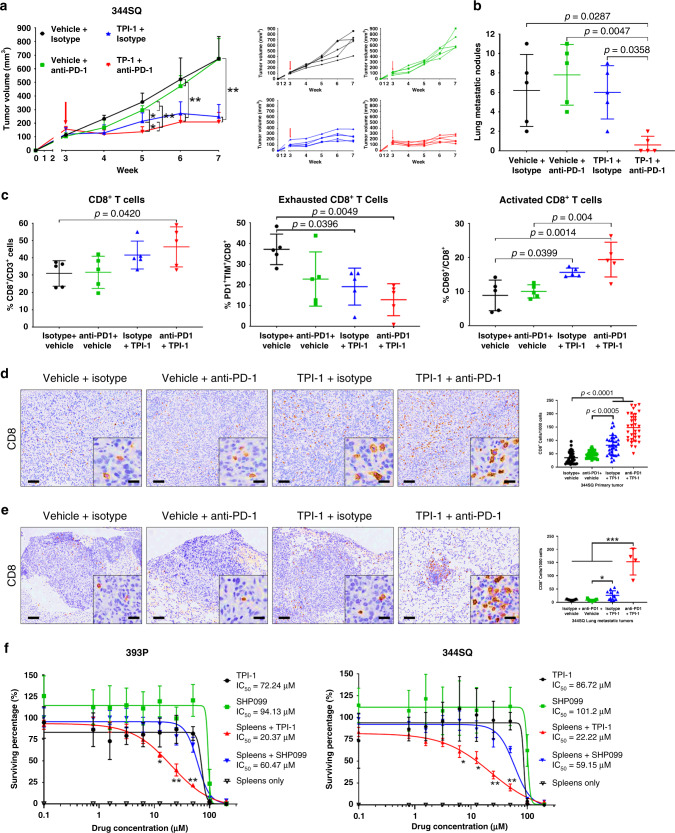
Tumor extracellular matrix has been associated with drug resistance and immune suppression. Here, proteomic and RNA profiling reveal increased collagen levels in lung tumors resistant to PD-1/PD-L1 blockade. Additionally, elevated collagen correlates with decreased total CD8+ T cells and increased exhausted CD8+ T cell subpopulations in murine and human lung tumors. Collagen-induced T cell exhaustion occurs through the receptor LAIR1, which is upregulated following CD18 interaction with collagen, and induces T cell exhaustion through SHP-1. Reduction in tumor collagen deposition through LOXL2 suppression increases T cell infiltration, diminishes exhausted T cells, and abrogates resistance to anti-PD-L1. Abrogating LAIR1 immunosuppression through LAIR2 overexpression or SHP-1 inhibition sensitizes resistant lung tumors to anti-PD-1. Clinically, increased collagen, LAIR1, and TIM-3 expression in melanoma patients treated with PD-1 blockade predict poorer survival and response. Our study identifies collagen and LAIR1 as potential markers for immunotherapy resistance and validates multiple promising therapeutic combinations.


Conflict of interest statement

D.L.G. declares advisory board/consulting work for Janssen, AstraZeneca, GlaxoSmithKline, Astellas, Ribon Therapeutics and Sanofi. D.L.G. receives research grant funding from AstraZeneca, Janssen, Ribon Therapeutics, Astellas and Takeda. L.A.B. declares consulting work for AstraZeneca, AbbVie, GenMab, BergenBio, Pharma Mar, SA. L.A.B. receives research grant funding from AbbVie, AstraZeneca, GenMab, Tolero Pharmaceuticals. All other authors declare that they have no conflict of interests.

Figures

Fig. 1
Fig. 1. PD-(L)1 blockade is associated with increased intratumoral collagen deposition.
a In vivo volume measurements at indicated time points for 344SQ subcutaneous tumors implanted in syngeneic WT mice treated weekly with anti-PD-L1 (200 µg/mouse) or isotype control (200 µg/mouse). Treatment start time denoted by blue (1-week post-implantation) or green (3-week post-implantation) arrow; n = 5 mice per treatment group. Statistics calculated using a one-way repeated mixed-effects model (REML) with *p = 0.0371. b Heatmap of RPPA profile showing statistically significant (FDR < 0.05) differentially expressed proteins in 344SQ subcutaneous tumors treated weekly with anti-PD-L1 or isotype control, starting 1-week post-implantation in mice. Tumor samples were collected for RPPA at the endpoint of experiment in (a), ~7 weeks, when tumors developed resistance. c Heatmap of statistically significant (FDR < 0.05) differentially expressed mRNAs related to collagen genes in 344SQ tumors treated weekly with anti-PD-L1 or isotype control, starting after one week of implantation. Tumors samples and RNA profiling data were obtained from a prior study at treatment endpoint, ~8 weeks, when tumors developed resistance. d Representative Masson’s trichrome stains and quantification of percent collagen area per field of untreated 344SQ tumors collected at 1 or 3 weeks post-implantation in mice; n = 5 tumors per time point and four microscopy fields per tumor sample were analyzed. Scale bars, 50 µm. Statistics calculated using two-sided student’s t-test. e Representative trichrome stains and quantification of percent collagen area per field of 344SQ tumors treated weekly with IgG isotype control or anti-PD-L1, starting after 1 week of implantation. Tumors were analyzed at endpoint of the experiment in (a); n = 5 tumors per treatment group with 34 total microscopy fields analyzed for IgG Ctrl and 52-total fields analyzed for anti-PD-L1 groups. Scale bars, 50 µm. Statistics calculated using a two-sided student’s t-test. f Left: Representative H&E stains and SHG microscopy, including SHG quantification of percent collagen area per field of lung tumor tissues from KrasG12D;p53-/- (KP) mice treated weekly with anti-PD-1, -PD-L1 or isotype control for 12–14 weeks; n = 5 lung tissues per treatment group with 45 (isotype Ctrl), 15 (anti-PD-L1), and 35 (anti-PD-1) total microscopy fields analyzed across all tissues in respective groups. Scale bars, 100 µm. Data presented as mean +/− SD. Statistics calculated using one-way ANOVA post hoc Tukey for multiple comparisons. *P < 0.05.
Fig. 2
Fig. 2. Tumors with decreased collagen have increased CD8+ TILs and decreased exhausted CD8+ TILs.
a Experimental schema illustrating immune assessment of 393P or 344SQ KP syngeneic tumors with LOXL2 knockdown or enzymatic inhibition. Tumors were collected and analyzed 5 weeks following subcutaneous implantation. Ellagic acid LOXL2 inhibitor was administered through mice feed 1-week following tumor implantation. b Quantification of lung metastatic surface nodules for indicated tumor groups after 5 weeks of tumor growth; 393P and 344SQ-shLOXL2 n = 5 mice per group; 344SQ Vec Ctrl and EA feed n = 4 mice per group. c Ratio of moles of DHLNL, HLNL, and d-Pyr collagen crosslinks per mole of total collagen analyzed by mass spectrometry in 344SQ tumors treated with EA feed LOXL2 inhibitor or LOXL2 shRNA; n = 3 tumors per treatment group. Data presented as mean +/− SD. Statistics calculated as a two-tailed student’s t-test between different two groups from two separate experiments as denoted by a dashed-red line. d Left: Representative FACS plots of indicated tumor cell suspensions for percentage of CD8+ T cells gated from CD45+CD3+ cells. Right: Quantification of percentage of total CD8+ T cells for each individual tumor sample; 393P and 344SQ-shLOXL2 n = 5 mice per group; 344SQ Vec Ctrl and EA feed n = 4 mice per group. e Left: Representative FACS plots of indicated tumor cell suspensions for percentage of PD-1+TIM-3+ cells gated from CD8+ T cells in (d). Right: Quantification of percentage of PD-1+TIM-3+ CD8+ T cells for each individual tumor sample; 393P and 344SQ-shLOXL2 n = 5 mice per group; 344SQ Vec Ctrl and EA feed n = 4 mice per group. All data presented as mean +/− SD. Statistics calculated using a one-way ANOVA post hoc Tukey test.
Fig. 3
Fig. 3. Reduction in LOXL2-dependent collagen deposition sensitizes tumors to PD-L1/PD-1 blockade.
a Left: Tumor volume measurements at indicated time points for 344SQ subcutaneous tumors treated with ellagic acid (EA) feed, single-agent anti-PD-L1 (200 µg/mouse/week), or both drugs in combination. Starting time of ellagic acid feed indicated by the blue arrow. Starting time of PD-L1 blockade denoted by the red arrow. Middle: Tumor volume measurements for individual mice in each treatment group. Right: Quantification of lung metastatic surface nodules (right) in indicated treatment groups at endpoint of the experiment; n = 5 mice per treatment group; **p < 0.01. b Representative trichrome stains and quantification of percent collagen area per field of 344SQ tumors in the indicated treatment groups at the endpoint of the experiment from (a); n = 5 tumors per treatment group with 28 (isotype + Ctrl feed), 29 (anti-PD-L1 + Ctrl feed), 23 (isotype + EA feed), and 30 (anti-PD-L1 + EA feed) total fields analyzed across all tissues in respective groups. Scale bars, 50 µm. c Left: FACS quantification of percentage of total CD8+ T cells gated from CD45+CD3+ cells for each individual tumor sample from the experiment in (a). Right: FACS quantification of percentage of PD-1+TIM-3+ cells gated from total CD8+ T cells for each individual tumor sample; n = 5 tumors per group. d Tumor volume measurements at indicated time points for 344SQ tumors treated with EA feed and anti-PD-1 (200 µg/mouse/week) with or without antibody depletion of CD8 T cells (200 µg/mouse/week); n = 5 tumors per group. Starting time of EA feed and anti-CD8 depletion marked by the blue and purple arrow. Red arrow denotes the starting time of PD-L1 blockade; *p < 0.05. e Quantification of lung metastatic surface nodules in indicated treatment groups at the endpoint of the experiment from (d). f FACS quantification of percentage of total CD8+ (left), PD-1+TIM-3+ CD8+ (middle), and IFN-γ+ CD8+ (right) TILs in tumor cell suspensions at experimental endpoint from (d). Statistics calculated using one-way ANOVA post hoc Tukey test for multi-group or two-tailed student’s t-test for two-group comparisons. g Representative CD8 IHC stains with quantification of peripheral and intratumoral primary tumor regions as denoted by black zoom box in 344SQ tumors from the experiment in (a); n = 5 tumors per group. For the tumor periphery, 16 total fields were analyzed across all tumors for each treatment group. For intratumoral regions, 12 total fields were analyzed across all tumors for each treatment group. Scale bars, 100 µm. Inset scale bars, 20 µm. h Representative CD8 IHC stains with quantification of metastatic lung tumor regions as denoted by black zoom box from the experiment in (a); n = 5 lungs for isotype + Ctrl feed, anti-PD-L1 + Ctrl feed, isotype + EA feed treatment groups, with five tumor fields quantified per sample; n = 4 lungs for anti-PD-L1 + EA feed group with two fields quantified per sample Scale bars, 100 µm. Inset scale bars, 20 µm. All data presented as mean +/− SD. Unless stated, statistics calculated using a one-way ANOVA post hoc Tukey test.
Fig. 4
Fig. 4. Collagen induces CD8+ T cell exhaustion through LAIR1-mediated SHP-1 signaling.
a Proposed model illustrating LAIR1 binding to collagen, which induces SHP-1-mediated T cell exhaustion alternative to the PD-1 pathway. LAIR1 signaling can be inhibited by secreted LAIR2 homolog binding to the LAIR1 collagen epitope or small-molecule inhibition of SHP-1. b Schematic of in vitro co-culture experiments. Splenocytes isolated from WT mice were co-cultured on collagen versus on plastic as a control in LAIR2-conditioned media, media containing SHP-1 inhibitor (TPI-1) or SHP-2 inhibitor (SHP099), and then analyzed by FACS. c FACS percentage of total CD8+ (left), PD-1+TIM-3+ CD8+ (middle), and LAIR1+ CD8+ (bottom) T cells in splenocytes co-cultured on plastic or collagen treated with 10µM SHP-1 inhibitor (TPI-1), 20 µM SHP-2 inhibitor (SHP099), or DMSO control for 96 h; n = 3 technical triplicates. d FACS percentage of total CD8+ (left), PD-1+TIM-3+ CD8+ (middle), and LAIR1+ CD8+ (right) T cells in splenocytes co-cultured on plastic or collagen for 96 h in conditioned media from 344SQ cells expressing LAIR2 or vector control; n = 3 technical triplicates. e FACS percentage of LAIR1+ CD8+ T cells for indicated 344SQ tumor cell suspensions from the experiment in Supplementary Fig. 5; n = 4 tumors per group. f FACS percentage of LAIR1+ CD8+ T cells for indicated 344SQ tumor cell suspensions from the experiment in Fig. 3; n = 5 tumors per group. g Heatmap showing association of mRNA expression in TCGA LUSC dataset between LAIR1 and collagen receptor genes that are statistically significant (P < 0.05) by Spearman’s rank correlation. h Representative scatter plot analysis of Spearman’s rank correlation between ITGB2, ITGAL, ITGAM, and ITGAX versus LAIR1 mRNA expression in TCGA LUSC dataset. ik Splenocytes cultured in vitro on plastic, laminin-rich Matrigel, or collagen were treated with CD18 inhibitory antibody (10 µg/mL) for 96 h and analyzed by FACS for percentage of (i) total CD8+ T cells gated from CD45+CD3+ splenocytes, (j) LAIR1+ CD8+ T cells, and (k) PD-1+TIM-3+ exhausted CD8+ T cells; n = 3 technical replicates per group. Unless stated, all data presented as mean +/− SD and statistics calculated using a one-way ANOVA post hoc Tukey test.
Fig. 5
Fig. 5. Combination of PD-1 blockade with LAIR2 overexpression reduces lung tumor growth and metastasis.
a Left: Tumor volume measurements at indicated time points for 344SQ syngeneic tumors ± LAIR2 overexpression treated weekly with anti-PD-1 (200 µg/mouse) or isotype control (200 µg/mouse). Starting time of PD-1 blockade denoted by green arrow. Middle: Images of three representative 344SQ primary subcutaneous tumors for each of the indicated treatment groups. Right: Quantification of lung metastatic surface nodules in indicated treatment groups at endpoint of the experiment. For Vec Ctrl + isotype and Vec Ctrl + anti-PD-1 n = 4 mice per treatment group. For hLAIR2 + isotype and hLAIR2 + anti-PD-1 n = 5 mice per treatment group. Scale bar, 1 cm. Statistics calculated using one-way ANOVA; **p < 0.01. b Tumor volume measurements for individual mice in each treatment group from the experiment in (a). c FACS quantification for percentage of total CD8+ (left), PD-1+TIM-3+ exhausted CD8+ (middle), and CD44+CD62L- effector (right) CD8+ TILs in indicated 344SQ tumor cell suspensions from the experiment in (a). d Representative CD8 IHC stains with quantification of 344SQ primary tumors from the experiment in (a); n = 4 tumors for Vec Ctrl + isotype and Vec Ctrl + anti-PD-1 groups; n = 5 tumors for hLAIR2 + isotype and hLAIR2 + anti-PD-1 groups, 32 total fields quantified across all tumor samples for each treatment group. Scale bars, 100µm. Inset scale bars, 20 µm. e Representative CD8 IHC stains with quantification of metastatic lung tumors from the experiment in (a); n = 4 lungs for Vec Ctrl + isotype, Vec Ctrl + anti-PD-1, and hLAIR2 + isotype groups, 17 total tumor fields quantified across all samples for each group; n = 3 lung for hLAIR2 + anti-PD-1 group with seven total tumor fields quantified across all samples. Scale bars, 100 µm. Inset scale bars, 20 µm. All data presented as mean +/− SD. Statistics calculated using a one-way ANOVA post hoc Tukey test.
Fig. 6
Fig. 6. Combination of PD-1 blockade with SHP-1 inhibition reduces lung tumor growth and metastasis.
a Left: Tumor volume measurements at indicated time points for 344SQ subcutaneous tumors treated weekly with anti-PD-1 (200 µg/mouse) monotherapy, daily with TPI-1 (3 mg/kg/mouse) monotherapy, or both therapies in combination. Treatment start time denoted by a red arrow. Right: Tumor volume measurements for individual mice in each treatment group from the aforementioned experiment; n = 5 mice per treatment group. b Quantification of lung metastatic surface nodules in indicated treatment groups at the endpoint of the experiment in (a). c FACS quantification for percentage of total CD8+ (left), PD-1+TIM-3+ exhausted CD8+ (middle), and CD69+ activated (right) CD8+ TILs in indicated 344SQ tumor cell suspensions from the experiment in (a). d Representative CD8 IHC stains with quantification of 344SQ primary tumors from the experiment in (a); n = 5 tumors per group, 32 total fields quantified across all samples for each treatment group. Scale bars, 100 µm. Inset scale bars, 20 µm. e Representative CD8 IHC stains with quantification of metastatic lung tumors from the experiment in (a); n = 5 lungs for isotype + Vehicle (15 total tumor fields), anti-PD1+Vehicle (17 total tumor fields), and isotype + TPI-1 (14 total tumor fields); n = 2 lung for anti-PD-1 + TPI-1 with 2 tumor fields per sample analyzed. Scale bars, 100 µm. Inset scale bars, 20 µm. f In vitro cell survival response after 72 h of increasing concentrations of SHP-1 (TPI-1) or SHP-2 (SHP099) inhibitor treatment in 393P (left) and 344SQ (right) KP cells alone or in co-culture with splenocytes. Cells were quantified using WST-1 reagent and normalized to DMSO control; n = 8 replicates per concentration per group. Indicated statistical significance relative to all treatment groups. All data presented as mean +/− SD. Statistics calculated using a one-way ANOVA post-hoc Tukey test. *P < 0.05; **P < 0.01.
Fig. 7
Fig. 7. High-collagen expression correlates with decreased CD8+ T cells, increased LAIR1 and TIM-3 exhaustion markers in human lung cancer datasets.
a Representative images of human lung cancer tissue sections (n = 451 for TMA and 8–10 whole tissue sections) stained by IHC for collagen I, collagen III, CD8, and TIM3. Scale bars, 200 µm. Inset scale bars, 50 µm. b Cluster plot analysis of Spearman’s rank correlation between total percent collagen I & III area versus CD8 or TIM-3 IHC signal count in human lung cancer tissue microarrays (n = 451 tissue samples). c Cluster plot analysis of Spearman’s rank correlation between percent collagen I or collagen III area versus CD8 or TIM3 IHC signal count in human lung cancer whole tissue sections (n = 8–10 tissue samples). d Heatmap showing the association of mRNA expression in the TCGA LUSC dataset between LAIR1 and collagen genes that are statistically significant (P < 0.05) by Spearman’s rank correlation. e Heatmap showing the association of mRNA expression in TCGA LUSC dataset between HAVCR2 (TIM-3) and collagen genes that are statistically significant (P < 0.05) by Spearman’s rank correlation. f Representative cluster plot analysis of Spearman’s rank correlation between COL3A1 versus LAIR1 or HAVCR2 (TIM3) mRNA expression in the TCGA LUSC dataset. g Cluster plot analysis of Spearman’s rank correlation between LAIR1 versus HAVCR2 (TIM3) mRNA expression in the TCGA LUSC dataset.
Fig. 8
Fig. 8. Collagen, LAIR1, and TIM3 predict response and overall survival to anti-PD-1/PD-L1 therapies.
a Heatmap showing statistically significant (P < 0.05) association between collagen mRNA expression in pre-treatment tumor biopsies and disease progression (progressive disease vs. partial/complete response) for melanoma patients receiving anti-PD-1 therapy (nivolumab). b Representative dot plots comparing pre-treatment collagen mRNA levels in melanoma patients that exhibited progressive disease (PD) versus partial or complete response (PR/CR) to anti-PD-1. PD sample size of n = 13 independent patient samples and PR/CR sample size of n = 15 independent patient samples. Boxplots shown as the median ± 1 quartile, with whiskers extending to the most extreme data point within 1.5 interquartile range from the box boundaries. Statistics calculated using two-sided Wilcoxon matched pair rank test with significance at P < 0.05. c Overall changes in LAIR1 and HAVCR2 (TIM3) mRNA expression levels in melanoma tumor biopsy samples between pre- and on-treatment with anti-PD-1; n = 43 independent patient samples for pre- and on-treatment groups. Boxplots shown as the median ± 1 quartile, with whiskers extending to the most extreme data point within 1.5 interquartile range from the box boundaries. Statistics calculated using two-sided Wilcoxon matched pair rank test with significance at P < 0.05. d Kaplan–Meier curves predicting survival of melanoma patients receiving anti-PD-1 therapy based on net changes in LAIR1 and HAVCR2 (TIM3) mRNA levels. Statistics calculated using a two-sided log-rank Cox test with significance at P < 0.05.

References

    1. Siegel RL, Miller KD, Jemal A. Cancer statistics, 2019. CA Cancer J. Clin. 2019;69:7–34. - PubMed
    1. Dagogo-Jack I, Shaw AT. Tumour heterogeneity and resistance to cancer therapies. Nat. Rev. Clin. Oncol. 2018;15:81–94. - PubMed
    1. Hanahan D, Weinberg RA. Hallmarks of cancer: the next generation. Cell. 2011;144:646–674. - PubMed
    1. Brahmer J, et al. Nivolumab versus docetaxel in advanced squamous-cell non-small-cell lung cancer. N. Engl. J. Med. 2015;373:123–135. - PMC - PubMed
    1. Forde PM, et al. Neoadjuvant PD-1 blockade in resectable lung cancer. N. Engl. J. Med. 2018;378:1976–1986. - PMC - PubMed

Publication types

MeSH terms

Substances