Clinical Trial
. 2020 Sep 9;10(1):14832.
doi: 10.1038/s41598-020-69318-y.

Comparing the visual outcome, visual quality, and satisfaction among three types of multi-focal intraocular lenses

Affiliations
Clinical Trial

Comparing the visual outcome, visual quality, and satisfaction among three types of multi-focal intraocular lenses

Dong Won Paik et al. Sci Rep. .

Erratum in

Abstract

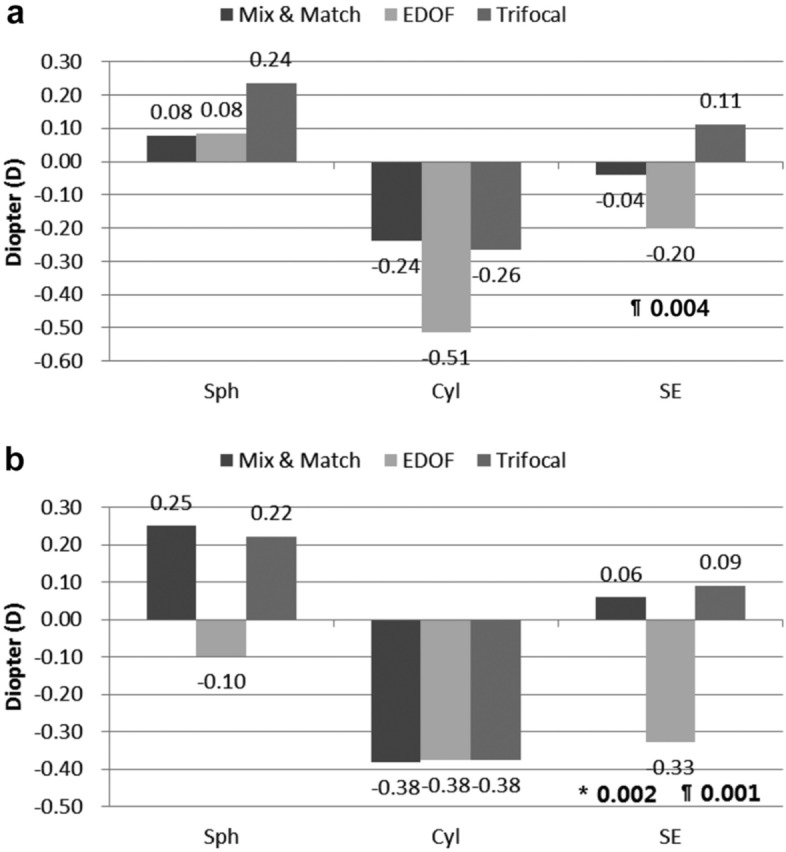
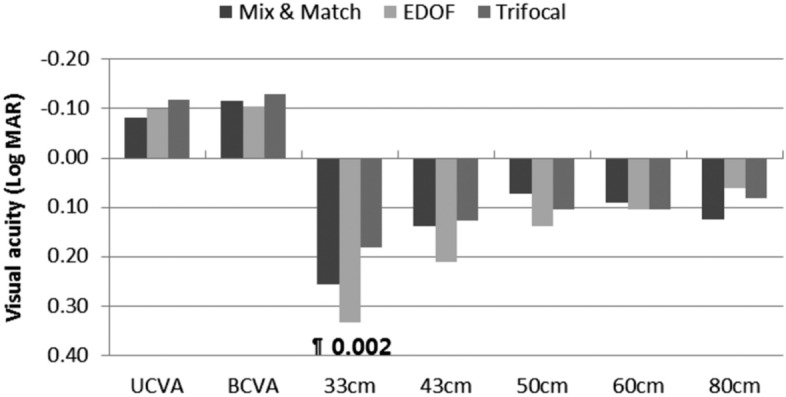
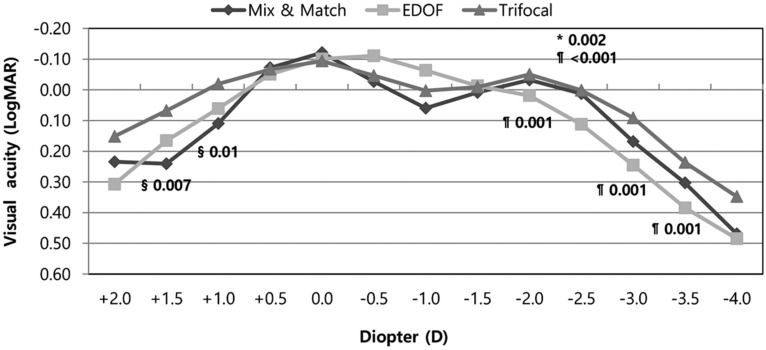
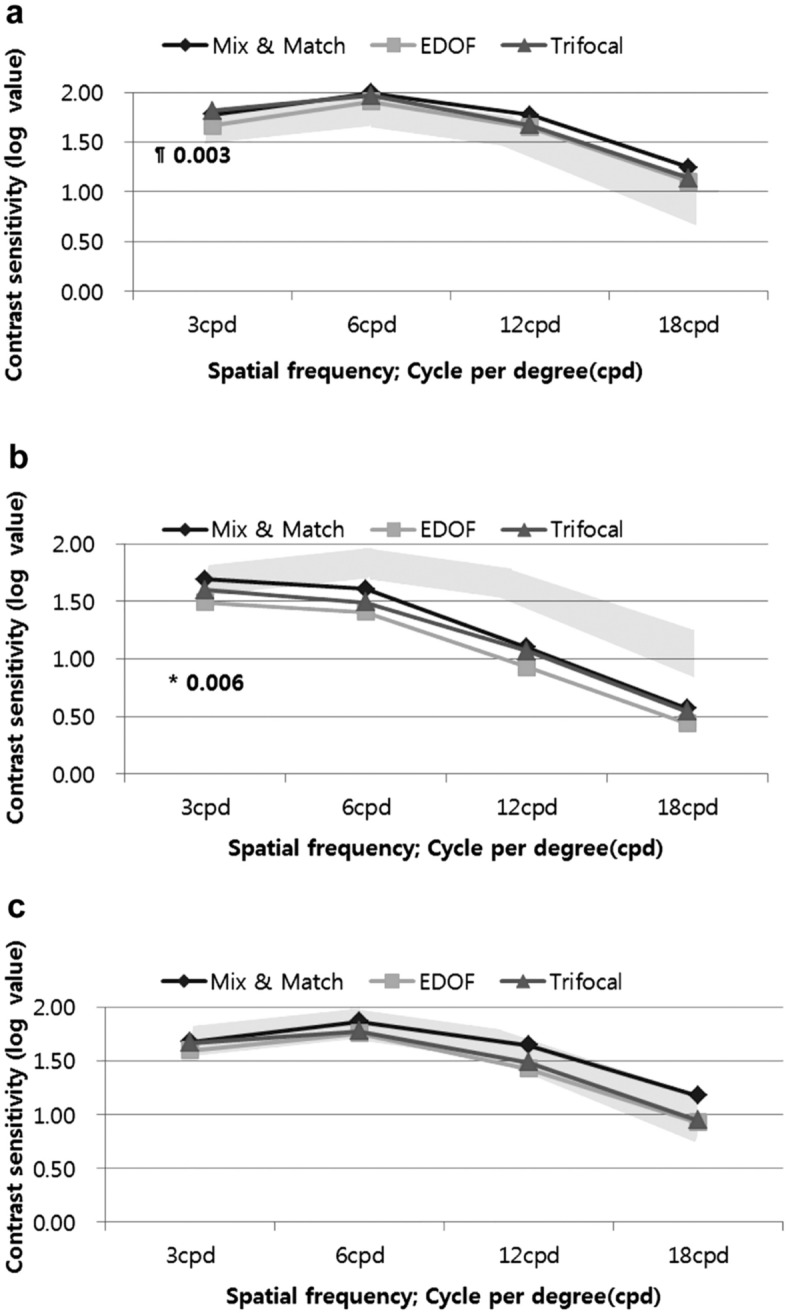
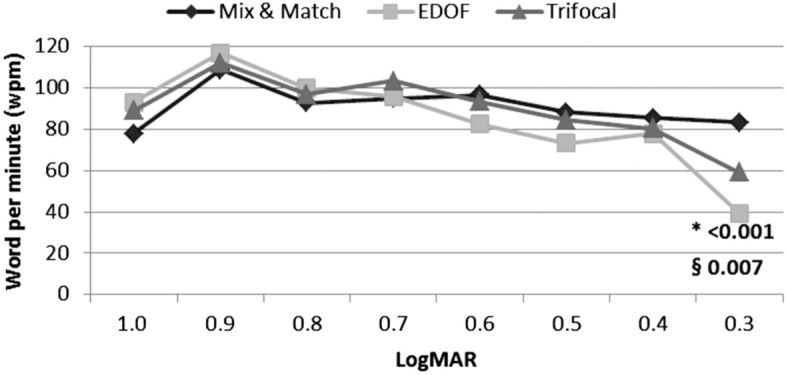
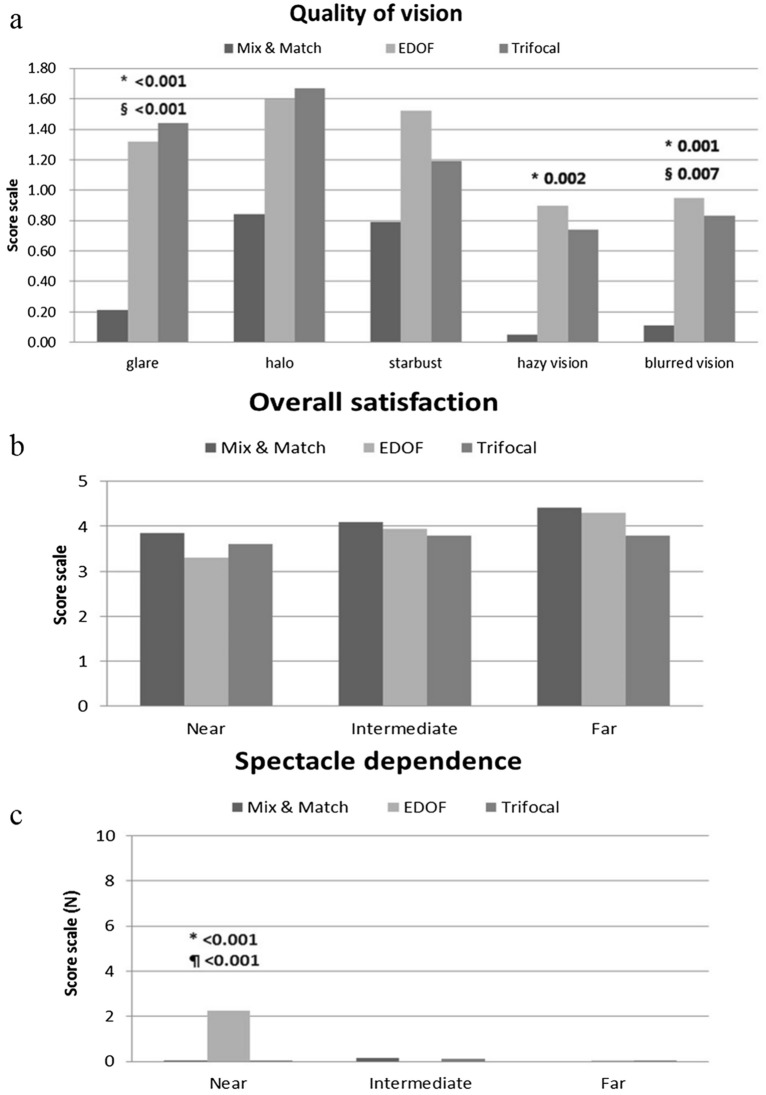
This study compared the visual outcome, visual quality, and satisfaction following implantation of the Mix-and-Match bifocal IOLs (+ 2.75 D and + 3.25 D add power Tecnis Multifocal Model), EDOF IOL (Tecnis Symfony IOL), and Trifocal IOL (FineVision PodFT, PhysIOL). All outcomes were compared among the three groups. The manifest refraction indicated that the EDOF group had significantly higher myopic spherical equivalent values than did the others. In the terms of visual acuity, there were no significant differences in far or intermediate visual acuity among the three groups. Only in near (33 cm), the EDOF group had significantly worse binocular visual acuity than did the Trifocal group (p = 0.002). Regarding to defocus curve, the Trifocal group had better defocus curves at near distances (- 2.0 to - 3.5 D; p = 0.001 vs. EDOF) than did the other two groups. In contrast sensitivity test, the EDOF group had relatively lower value than did the other two groups. In reading speed, only at 0.3 logMAR (6.5-point font), Mix-and-Match group had a significantly higher reading speed than did the other two groups (p = < 0.001 vs. EDOF, p = 0.007 vs. Trifocal). also Mix-and-Match group showed significantly fewer visual artifacts. There were no differences between the three groups in terms of patient satisfaction.ClinicalTrials.gov number: NCT04019691.


Conflict of interest statement

The authors declare no competing interests.

Figures

Figure 1
Figure 1
Postoperative refractive outcomes in the three groups (Mix-and-Match, EDOF and Trifocal). a Dominant eye. The EDOF group had significantly higher myopic SE values than did the Trifocal group (p = 0.004) in the dominant eyes at three months. b Non-dominant eye. The EDOF group had higher myopic SE values than did the Mix-and-Match group (p = 0.002) and the Trifocal group (p = 0.001) in non-dominant eyes at three months. All outcomes were compared among the three groups. Bonferroni correction for multiple comparisons: significant p values (p < 0.017) in bold with symbols. *: Mix and Match versus EDOF, §: Mix and Match versus Trifocal, ¶: EDOF versus Trifocal.
Figure 2
Figure 2
Postoperative uncorrected near, intermediate, and far visual acuity. No significant differences in far or intermediate visual acuity among the three groups were observed in the binocular vision test at three months. In subgroup analysis, at 33 cm near distance, the EDOF group had significantly worse binocular visual acuity than did the Trifocal group (p = 0.002). All outcomes were compared among the three groups. Bonferroni correction for multiple comparisons: significant p values (p < 0.017) in bold with symbols. *: Mix and Match versus EDOF, §: Mix and Match versus Trifocal, ¶: EDOF versus Trifocal.
Figure 3
Figure 3
Binocular defocus curves for the three groups. Mix-and-Match and Trifocal groups showed best visual acuity results at 0.0 D and second peak at − 2.0 D, but showed dips in the intermediate range (− 0.5 to − 1.5 D). The EDOF group provided continuous range of vision, but with a more progressive visual acuity decrease to the higher levels of defocus. Trifocal group had a significantly better defocus curve at near distance (− 2.0 to − 3.5 D; p = 0.001 vs. EDOF) than did the EDOF group in the subgroup analysis. All outcomes were compared among the three groups. Bonferroni correction for multiple comparisons: significant p values (p < 0.017) in bold with symbols. *: Mix and Match versus EDOF, §: Mix and Match versus Trifocal, ¶: EDOF versus Trifocal.
Figure 4
Figure 4
Contrast sensitivity in the three groups. a Photopic. At the spatial frequency of 3 cycles per degree (cpd), the EDOF group was significantly lower than the Trifocal group under the photopic condition at three months (p = 0.003). b Mesopic with glare off. At the spatial frequency of 3 cycles per degree (cpd), the EDOF group was significantly lower than the Mix-and-Match group at three months (p = 0.006). c Mesopic with glare on. All three groups had normal values and no differences. All outcomes were compared among the three groups. Bonferroni correction for multiple comparisons: significant p values (p < 0.017) in bold with symbols. *: Mix and Match versus EDOF, §: Mix and Match versus Trifocal, ¶: EDOF versus Trifocal. Opaque area represents the normal value range.
Figure 5
Figure 5
Reading speed test results for the three groups. No significant differences among the three groups for font sizes between 1.0 logMAR (29-point font) and 0.4 logMAR (9-point font). The Mix-and-Match group had a significantly higher reading speed than the other two groups at 0.3 logMAR (6.5-point font) (p =  < 0.001 vs. EDOF, p = 0.007 vs. Trifocal). All outcomes were compared among the three groups. Bonferroni correction for multiple comparisons: significant p values (p < 0.017) in bold with symbols. *: Mix and Match versus EDOF, §: Mix and Match versus Trifocal, ¶: EDOF versus Trifocal.
Figure 6
Figure 6
Postoperative questionnaire at 3 months. a Quality of vision (visual artifacts) questionnaire. The Mix-and-Match group showed the lowest frequency of visual artifacts at three months. Subgroup analysis showed the frequency of three symptoms (glare, hazy vision, and blurred vision) were significantly lower in the Mix-and-Match group than they were in the other groups (glare; p < 0.001 vs. EDOF and p < 0.001 vs. Trifocal, hazy vision; p = 0.002 vs. EDOF, blurred vision; p = 0.001 vs. EDOF and p = 0.007 vs. Trifocal). b Overall satisfaction (near, intermediate, and far) questionnaire. Three groups reported relatively similar satisfaction with far, intermediate, and near vision at three months. c Spectacle dependence (near, intermediate, and far) in the three groups. The EDOF group showed significantly higher near-vision spectacle dependence (p < 0.001 vs. Mix-and-Match, p < 0.001 vs. Trifocal) at 3 months. All outcomes were compared among the three groups. Bonferroni correction for multiple comparisons: significant p values (p < 0.017) in bold with symbols. Spectacle dependence score scale: 0–10 (0—none; N—N out of 10; 10—Always). Quality of vision score scale: 0–3 (0—none; 1—mild; 2—moderate; 3—severe). Subjective satisfaction score scale: 1–5 (1—very unsatisfied; 2—unsatisfied; 3—neither satisfied nor dissatisfied; 4—satisfied; 5—very satisfied). *: Mix and Match versus EDOF, §: Mix and Match versus Trifocal, ¶: EDOF versus Trifocal.

References

    1. Fernández-Vega L, Alfonso JF, Baamonde MB, Montés-Micó R. Symmetric bilateral implantation of a distance dominant diffractive bifocal intraocular lens. J. Cataract Refract. Surg. 2007;33:1913–1917. doi: 10.1016/j.jcrs.2007.06.044. - DOI - PubMed
    1. Alfonso JF, Fernández-Vega L, Puchades C, Montés-Micó R. Intermediate visual function with different multifocal intraocular lens models. J. Cataract Refract. Surg. 2010;36:733–739. doi: 10.1016/j.jcrs.2009.11.018. - DOI - PubMed
    1. Hayashi K, Yoshida M, Hirata A, Yoshimura K. Short-term outcomes of combined implantation of diffractive multifocal intraocular lenses with different addition power. Acta Opthalmol. 2015;93:287–293. doi: 10.1111/aos.12591. - DOI - PubMed
    1. Yang CM, Lim DH, Hwang S, Hyun J, Chung TY. Prospective study of bilateral mix and match implantation of diffractive multifocal intraocular lenses in Koreans. BMC Opthalmol. 2018;18:73. doi: 10.1186/s12886-018-0735-0. - DOI - PMC - PubMed
    1. Pedrotti E, Bruni E, Bonacci E, Badalamenti R, Mastropasqua R, Marchini G. Comparative analysis of the clinical outcome with a monofocal and an extended range of vision intraocular lens. J. Refract. Surg. 2016;32:436–442. doi: 10.3928/1081597X-20160428-06. - DOI - PubMed

Publication types

Associated data