. 2020 Sep 9;10(1):14831.
doi: 10.1038/s41598-020-71795-0.

2,3,7,8-Tetrachlorodibenzo-p-dioxin (TCDD) dysregulates hepatic one carbon metabolism during the progression of steatosis to steatohepatitis with fibrosis in mice

Affiliations

2,3,7,8-Tetrachlorodibenzo-p-dioxin (TCDD) dysregulates hepatic one carbon metabolism during the progression of steatosis to steatohepatitis with fibrosis in mice

Russell R Fling et al. Sci Rep. .

Abstract

2,3,7,8-Tetrachlorodibenzo-p-dioxin (TCDD), a persistent environmental contaminant, induces steatosis that can progress to steatohepatitis with fibrosis, pathologies that parallel stages in the development of non-alcoholic fatty liver disease (NAFLD). Coincidently, one carbon metabolism (OCM) gene expression and metabolites are often altered during NAFLD progression. In this study, the time- and dose-dependent effects of TCDD were examined on hepatic OCM in mice. Despite AhR ChIP-seq enrichment at 2 h, OCM gene expression was not changed within 72 h following a bolus dose of TCDD. Dose-dependent repression of methionine adenosyltransferase 1A (Mat1a), adenosylhomocysteinase (Achy) and betaine-homocysteine S-methyltransferase (Bhmt) mRNA and protein levels following repeated treatments were greater at 28 days compared to 8 days. Accordingly, levels of methionine, betaine, and homocysteic acid were dose-dependently increased, while S-adenosylmethionine, S-adenosylhomocysteine, and cystathionine exhibited non-monotonic dose-dependent responses consistent with regulation by OCM intermediates and repression of glycine N-methyltransferase (Gnmt). However, the dose-dependent effects on SAM-dependent metabolism of polyamines and creatine could not be directly attributed to alterations in SAM levels. Collectively, these results demonstrate persistent AhR activation disrupts hepatic OCM metabolism at the transcript, protein and metabolite levels within context of TCDD-elicited progression of steatosis to steatohepatitis with fibrosis.


Conflict of interest statement

The authors declare no competing interests.

Figures
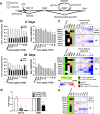
Figure 1
Figure 1
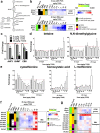
TCDD-elicited repression of SAM biosynthesis and methyltransferase gene expression. (a) Schematic pathway depicting enzymes (open rectangle) and metabolites (open circle) associated with SAM biosynthesis and utilization by methyltransferases (MT). (b) Hepatic levels of SAM and SAH were determined by LC–MS/MS (mean ± s.e.m., n = 5–6) at 8 and 28 days of repeated TCDD exposure and (c) hepatic gene expression of genes involved in the biosynthesis, regulation, and utilization of SAM and SAH were assessed at 8 and 28 days by RT-qPCR or RNA-seq, respectively (n = 8). (d) Fold change for hepatic MAT1A and GNMT protein levels after 28 days measured by the WES capillary electrophoresis system (mean ± s.e.m., n = 4). (e) Hepatic gene expression associated with SAM metabolism was determined by RNA-seq for a time-course after a bolus dose of 30 µg/kg TCDD (n = 5). For the heatmaps, the median effective dose (ED50) and benchmark dose lower limit (BMDL) and relative transcript count (rel. count, ) are denoted. The red/blue color scale represents the log2(fold change) for differential gene expression. Orange represents the presence of putative dioxin response elements (pDREs). AhR enrichment peaks (FDR ≤ 0.05) are denoted by light green. pDREs found within AHR ChIP-seq enrichment peaks are denoted by garnet. Asterisks (*) denote p < 0.05 determined by one-way ANOVA with a Dunnett’s post-hoc test. Pound signs (#) denote posterior probabilities P1(t) ≥ 0.80 compared to vehicle. Official gene name and symbol, and metabolite abbreviations: Comt catechol-O-methyltransferase, Gamt guanidinoacetate N-methyltransferase, Gnmt glycine N-methyltransferase, Inmt indolethylamine N-transferase, Mat1a, Mat2a S-adenosylmethionine synthase isoform 1a or 2a, Nnmt nicotinamide N-methyltransferase, Pemt phosphatidylethanolamine N-methyltransferase, Sardh sarcosine dehydrogenase, SAM S-adenosylmethionine, SAH S-adenosylhomocysteine.
Figure 2
Figure 2
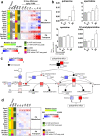
TCDD elicited effects on the hepatic metabolism of homocysteine. (a) Schematic of pathway depicting enzymes and metabolites associated with homocysteine metabolism. Boxes represent enzymes and circles represent metabolites. (b) Hepatic gene expression associated with homocysteine metabolism was measured at 8 or 28 days by qRT-PCR and RNA-seq, respectively (n = 8). (c) Hepatic protein levels (mean ± s.e.m.) were determined by capillary electrophoresis for AHCY, BHMT, and CBS in male mice at 28 days (n = 4). (d) Metabolite fold change at 8 days (mean ± s.e.m., n = 3–6) or 28 days (mean ± s.e.m., n = 4–5) were determined by LC–MS/MS for betaine, N,N-dimethylglycine and (e) cystathionine (8 and 28 days), or methionine and homocysteic acid (28 days only). (f) Hepatic gene expression of methionine transporters at 28 days (n = 8). (g) Hepatic gene expression associated with homocysteine metabolism was determined by RNA-seq for a time-course after a bolus dose of 30 µg/kg TCDD (n = 5). For the heatmaps, the effective dose (ED50), benchmark dose lower limit (BMDL), and relative transcript counts (rel. count) are denoted. The red/blue color scale represents the log2(fold change) for differential gene expression. Orange represents the presence of putative dioxin response elements (pDREs). AhR enrichment peaks (FDR ≤ 0.05) are denoted by light green. pDREs found within AHR ChIP-seq enrichment peaks are denoted by garnet. Asterisks (*) denote p < 0.05 determined by one-way ANOVA with a Dunnett’s post-hoc test. Pound signs (#) denote posterior probabilities P1(t) ≥ 0.80 compared to vehicle. Official gene name and symbol: Ahcy adenosylhomocysteinase, Bhmt betaine homocysteine S-methyltransferase, Cbs cystathionine beta-synthetase.
Figure 3
Figure 3
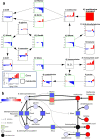
TCDD-Elicited Effects on Polyamine (PA) Biosynthesis. (a) Hepatic gene expression associated with PA metabolism was examined using RNA-seq at 28 days repeated TCDD exposure (n = 8). (b) Hepatic PA levels were determined by LC–MS/MS at 28 days repeated TCDD exposure (mean ± s.e.m., n = 5). (c) Hepatic gene expression associated with polyamine metabolism was determined by RNA-seq for a time-course after a bolus dose of 30 µg/kg TCDD. (d) Schematic pathway of hepatic polyamine biosynthesis incorporating fold changes of metabolites (open circle) and gene expression (open rectangle) in male mice orally gavaged with sesame oil vehicle or 30 µg/kg TCDD every 4 days for 28 days. Fold changes of metabolites and gene expression were determined by LC–MS/MS or RNA-seq, respectively. For the heatmaps, the effective dose (ED50), benchmark dose lower limit (BMDL), and relative transcript count (Rel. Count) are denoted. The red/blue color scale represents the log2(fold change) for differential gene expression. Orange represents the presence of putative dioxin response elements (pDREs). AhR enrichment peaks (FDR ≤ 0.05) are denoted by light green. pDREs found within AHR ChIP-seq enrichment peaks are denoted by garnet. Asterisks (*) denote *p < 0.05 determined by one-way ANOVA with a Dunnett’s post-hoc test. Pound signs (#) denote posterior probabilities P1(t) ≥ 0.80 compared to vehicle.). Official gene name and symbol, and metabolite abbreviations: Amd1 S-adenosylmethionine decarboxylase, Azin1 antizyme inhibitor 1, Oaz1 ornithine decarboxylase antizyme 1, Odc1 ornithine decarboxylase, L-ornithine (ORN), Paox peroxisomal N1-acetyl-spermine/spermidine oxidase, PA polyamine, Sat1 & 2 spermine/spermidine acetyltransferase, Slc3a2 4F2 cell-surface antigen heavy chain, Srm spermidine synthase, Sms spermine synthase, Smox spermine oxidase, SAM S-adenosylmethionine, Decarbox-SAM decarboxylated SAM, MTA methylthioadenosine.
Figure 4
Figure 4
TCDD-Elicited Dose-Dependent Effects on Creatine Biosynthesis. (a) Schematic of systemic creatine biosynthesis and transport. For 30 µg/kg TCDD treatment groups, renal Gatm expression and hepatic Gamt fold-changes from vehicle are denoted. (b) Hepatic gene expression associated with creatine metabolism at 8 or 28 days repeated TCDD exposure. (c) Guanidinoacetate (GAA)-, creatine (CRE)-, and creatinine (CRN)-fold changes determined by LC–MS/MS in male mice orally gavaged with sesame oil vehicle or 30 µg/kg TCDD every 4 days for 28 days (mean ± s.e.m., n = 5). (d) Hepatic expression associated with creatine metabolism in male mice orally gavaged with a bolus dose of 30 µg/kg TCDD (n = 8). For the heatmaps, the effective dose (ED50), benchmark dose lower limit (BMDL), and relative transcript count (Rel. Count) are denoted. The red/blue color scale represents the log2(fold change) for differential gene expression. Orange represents the presence of putative dioxin response elements (pDREs) with a matrix similarity scores (MSS) ≥ 0.856. AhR enrichment peaks (FDR ≤ 0.05) denoted by light green were determined by ChIP-seq. pDREs found within AHR ChIP-seq enrichment peaks are denoted by garnet. Asterisks denote (*) p < 0.05 or (**) p < 0.01 determined by one-way ANOVA with a Dunnett’s post-hoc test. Pound signs (#) denote posterior probabilities P1(t) ≥ 0.80 compared to vehicle. Official gene name and symbol, and metabolite abbreviations: Gamt guanidinoacetate N-methyltransferase, Gatm glycine amidinotransferase, mitochondrial, Ckm creatine kinase M-type, ARG arginine, GLY glycine, GAA guanidinoacetate, CRE creatine, and CRN creatinine, PCRE phosphocreatine.
Figure 5
Figure 5
Summary of effects of TCDD on OCM gene expression and metabolites. (a) OCM pathway schematic depicting dose response effects of TCDD on gene expression (green rectangles labelled A–H) and metabolite levels (black rounded rectangles labelled 1–11) in male C57BL/6 mice at 28 days repeated TCDD exposure. Gene expression and metabolite levels were determined by RNA-seq or LC–MS/MS, respectively. Homocysteine levels were not determined (N.D.). The Log2(fold change) range is denoted on left y-axis of each box and the bar colors represents red as induced and blue as repressed. (b) OCM pathway schematic depicting changes in gene expression and metabolite levels in male C57BL/6 mice orally gavaged with sesame oil vehicle or 30 µg/kg TCDD every 4 days for 28 days. Inhibition or activation of enzymes in pathway are indicated by grey dashed lines. Changes in genes expression and metabolite levels were determined by RNA-seq or LC–MS/MS, respectively. Green boxes represent genes and black circles represent metabolites. The Log2(fold change) represents red as induced and blue as repressed. Official gene name and symbol: (a) Mat1a S-adenosylmethionine synthase isoform 1a, (b) Mat2a S-adenosylmethionine synthase isoform 2a, (c) Gnmt glycine N-methyltransferase, (d) Sardh sarcosine dehydrogenase, (e) Ahcy adenosylhomocysteinase, (f) Cbs cystathionine beta-synthetase, (g) Bhmt betaine homocysteine methyltransferase, (h) Slc1a5, 7a5, 7a7, 7a8, 16a9, 38a1, 38a2, and 43a2 solute carrier family.

Similar articles

Cited by

References

    1. Walker AK. 1-Carbon cycle metabolites methylate their way to fatty liver. Trends Endocrinol. Metab. 2016;28:63–72. - PMC - PubMed
    1. Ducker GS, Rabinowitz JD. One-carbon metabolism in health and disease. Cell Metab. 2016;25:27–42. - PMC - PubMed
    1. Mentch SJ, et al. Histone methylation dynamics and gene regulation occur through the sensing of one-carbon metabolism. Cell Metab. 2015;22:861–873. - PMC - PubMed
    1. Friso S, Udali S, De Santis D, Choi SW. One-carbon metabolism and epigenetics. Mol. Aspects Med. 2017;54:28–36. - PubMed
    1. Pegg AE. Mammalian polyamine metabolism and function. IUBMB Life. 2009;61:880–894. - PMC - PubMed

Publication types

MeSH terms