. 2020 Sep 9;3(1):498.
doi: 10.1038/s42003-020-01211-w.

Allosteric regulation of lysosomal enzyme recognition by the cation-independent mannose 6-phosphate receptor

Affiliations

Allosteric regulation of lysosomal enzyme recognition by the cation-independent mannose 6-phosphate receptor

Linda J Olson et al. Commun Biol. .

Abstract

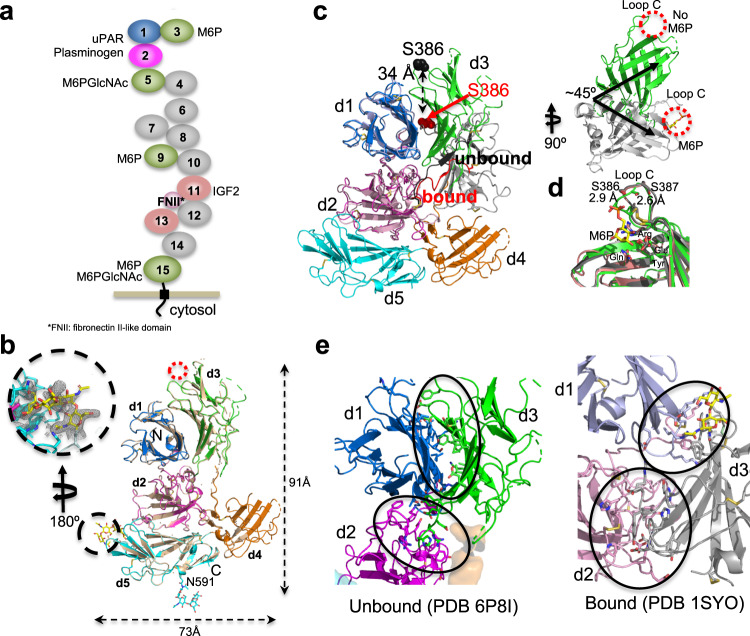
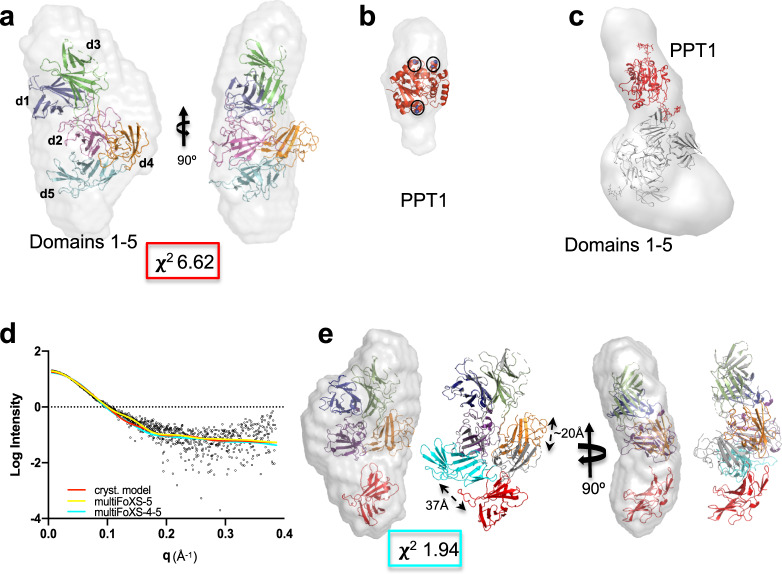
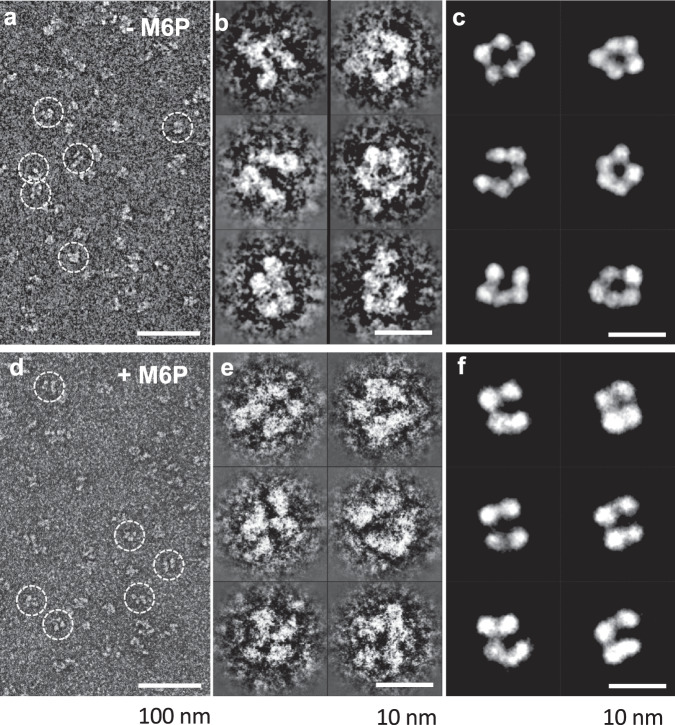
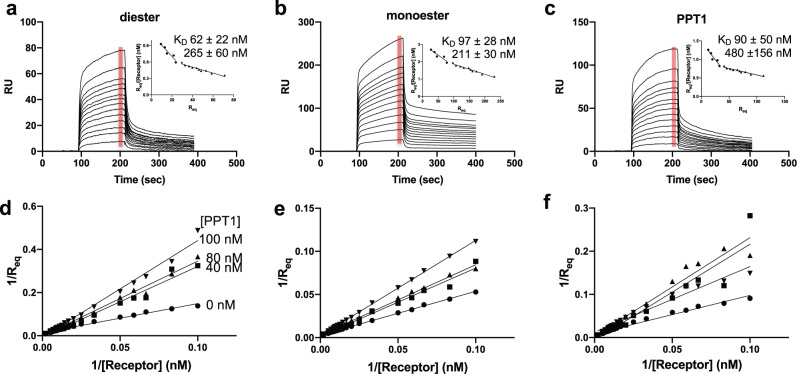
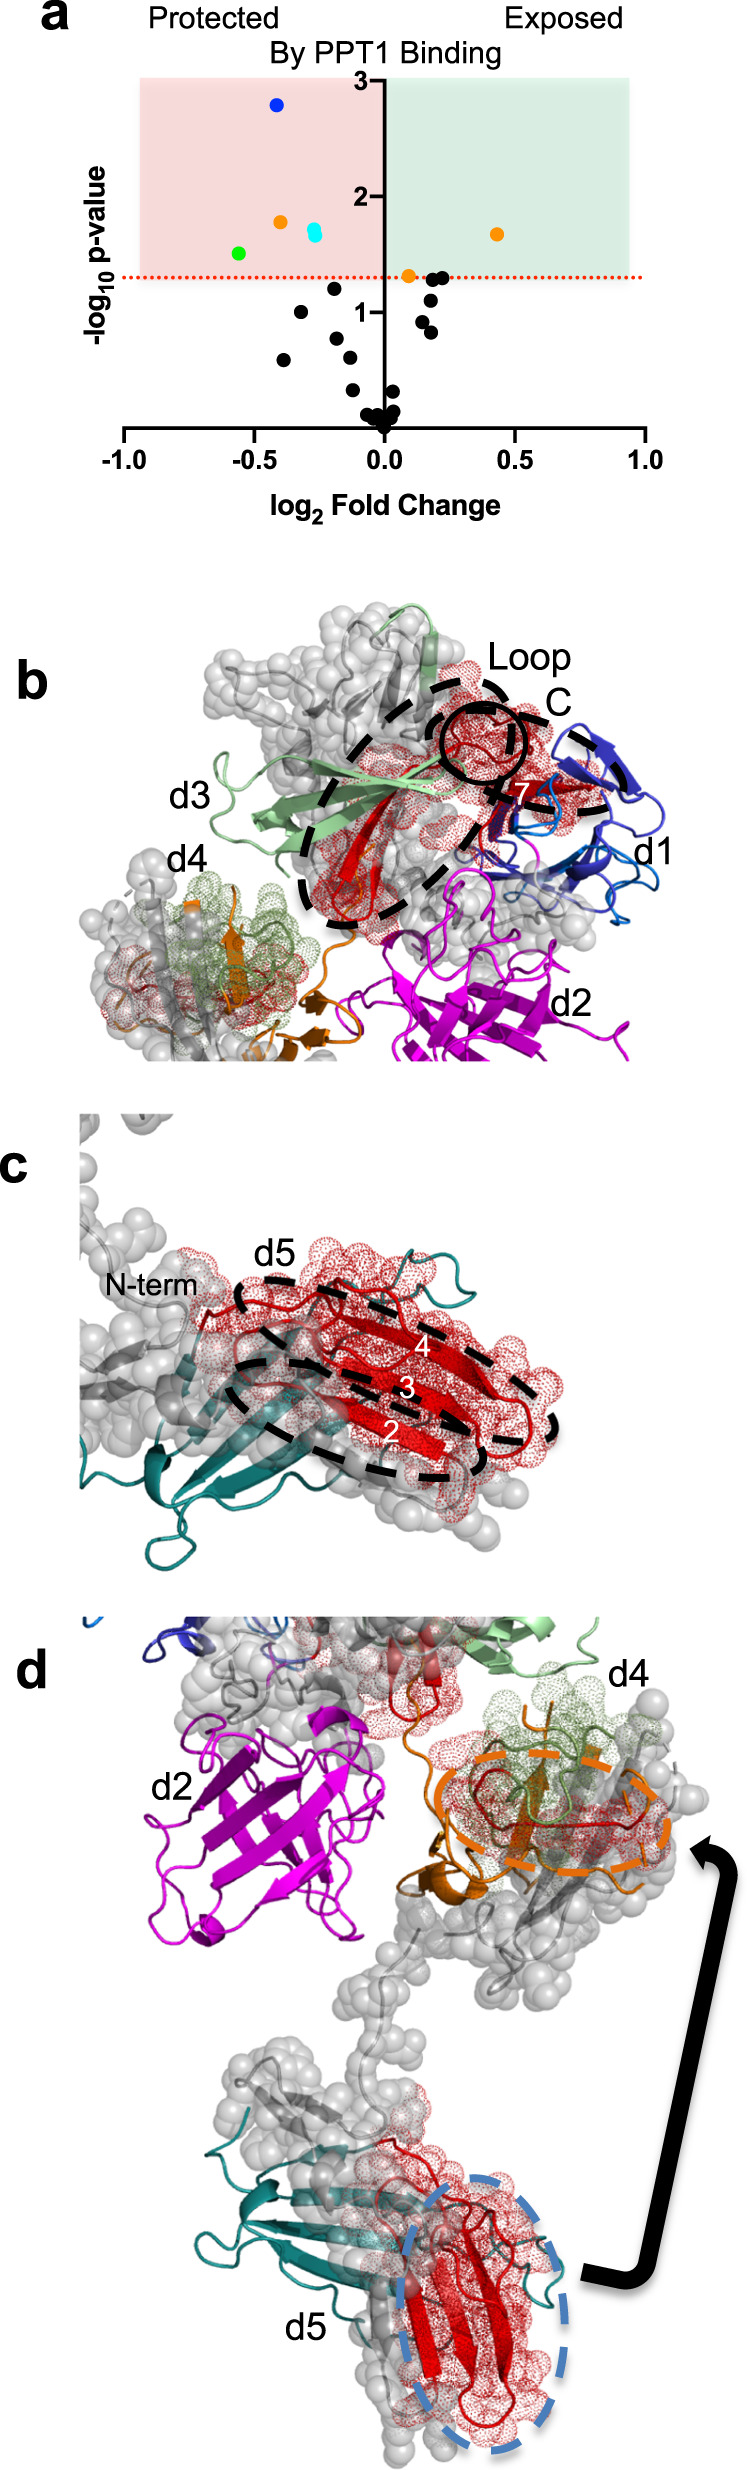
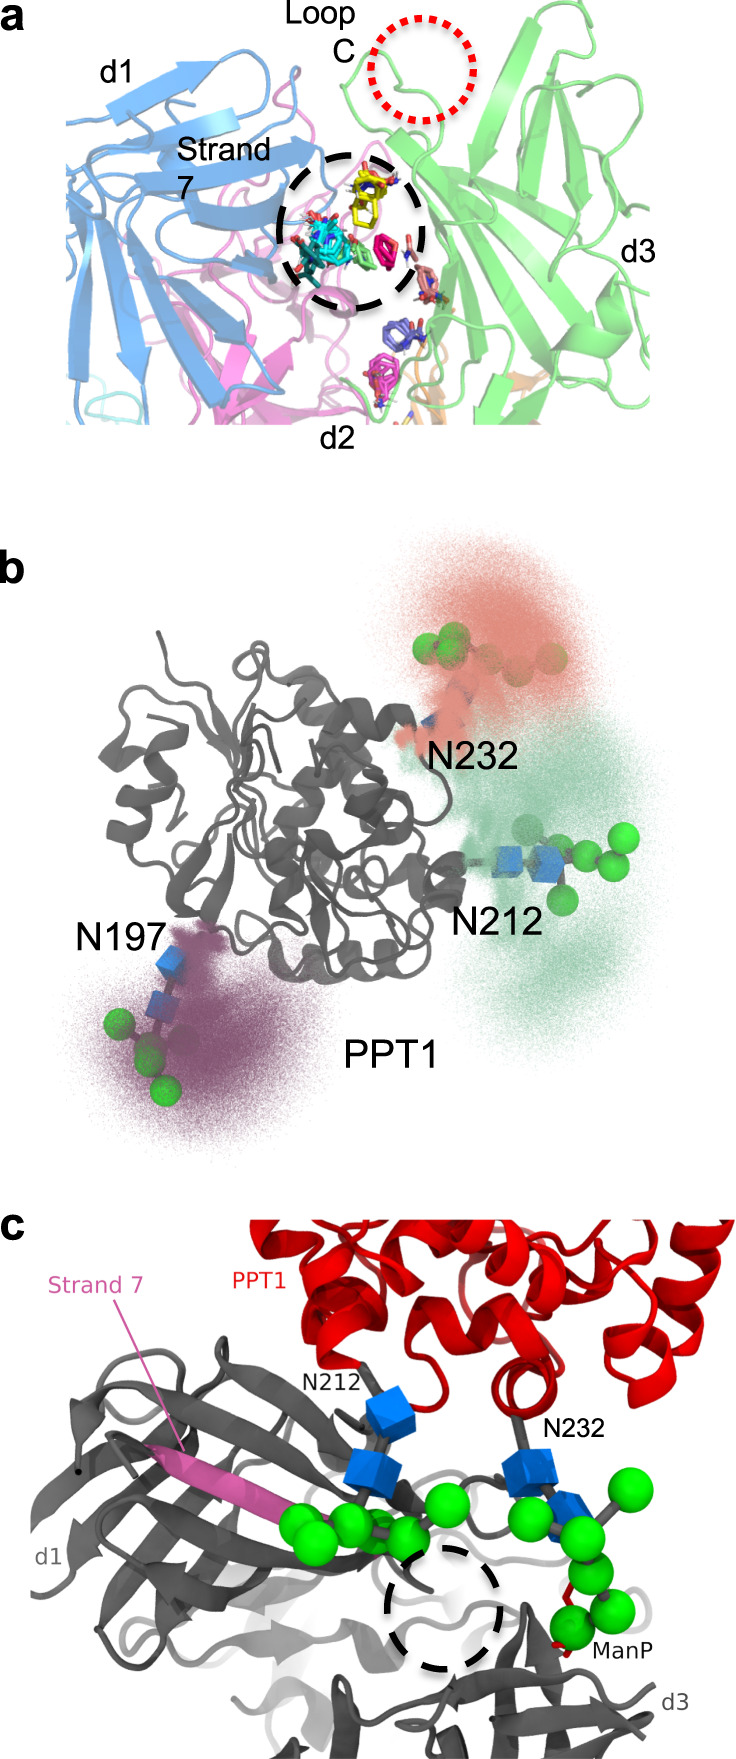
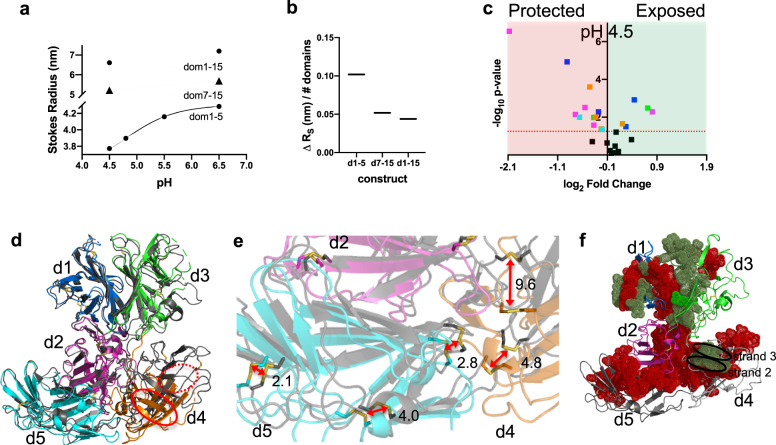
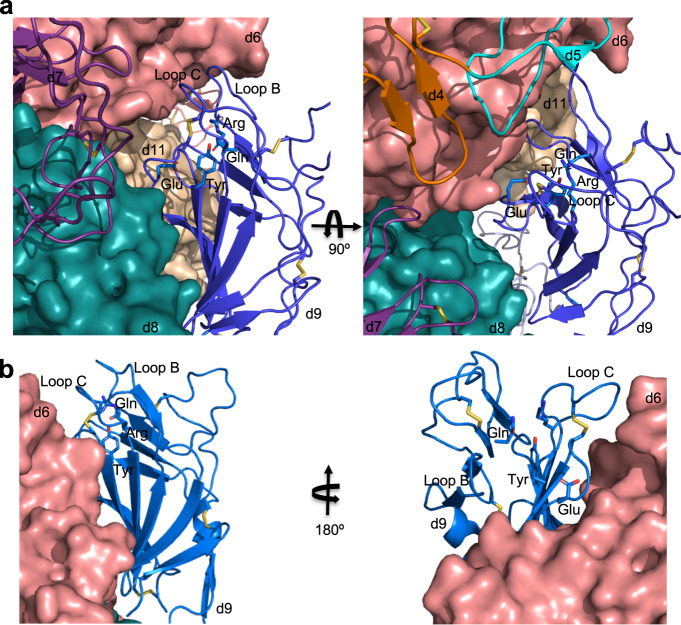
The cation-independent mannose 6-phosphate receptor (CI-MPR, IGF2 receptor or CD222), is a multifunctional glycoprotein required for normal development. Through the receptor's ability to bind unrelated extracellular and intracellular ligands, it participates in numerous functions including protein trafficking, lysosomal biogenesis, and regulation of cell growth. Clinically, endogenous CI-MPR delivers infused recombinant enzymes to lysosomes in the treatment of lysosomal storage diseases. Although four of the 15 domains comprising CI-MPR's extracellular region bind phosphorylated glycans on lysosomal enzymes, knowledge of how CI-MPR interacts with ~60 different lysosomal enzymes is limited. Here, we show by electron microscopy and hydroxyl radical protein footprinting that the N-terminal region of CI-MPR undergoes dynamic conformational changes as a consequence of ligand binding and different pH conditions. These data, coupled with X-ray crystallography, surface plasmon resonance and molecular modeling, allow us to propose a model explaining how high-affinity carbohydrate binding is achieved through allosteric domain cooperativity.


Conflict of interest statement

The authors declare no competing interests.

Figures

Fig. 1
Fig. 1. The structure of the N-terminal domains of CI-MPR in the presence and absence of ligand.
a Cartoon of the domain structure of CI-MPR, highlighting the multifunctionality of the protein. Relevant ligands are listed next to their known domain of interaction. Domains with no known function to date are colored gray. b Overlay of Cα atoms (r.m.s.d. of ~0.2 Å over 524 Cα atoms) of models of crystal structures solved at pH 5.5 (PDB 6P8I) and 7.0 (tan) (PDB 6V02). MRH domains are labeled (d1-d5) along with the N- and C-termini. The red circle marks the unoccupied known M6P binding site in domain 3, while the glycan of a crystallographic neighbor occupying the known binding site of domain 5 (PDB 6P8I) is circled in black. The covalently attached glycan at N591 is shown in stick representation. Approximate dimensions of the domains 1–5 model are given. Inset shows the 2fo-fc map (contoured to ~0.7σ) around N591 of a crystallographic neighbor. c Overlay of the Cα atoms of domain 1 of PDB 1SYO (M6P bound domain 3) (gray) with those of PDB 6P8I (unbound) (green). Residue S386 of loop C is labeled in the unbound (black spheres) and bound (red spheres) structures. The linker between domains 2 and 3 of PDB 6P8I is shown in black while that of 1SYO is shown in red. The rotated inset shows only domain 3 of each structure. The carbohydrate-binding sites are circled in red. The bound M6P (PDB 1SYO) is shown in yellow sticks. d A comparison of the known domain 3 structures bound to oligosaccharide of neighbor (pink, PDB 1Q25), M6P (protein by gray cartoon and M6P in yellow sticks, PDB 1SYO), or unbound (green, PDB 6P8I). Displacement of the atoms S386 (2.9 Å) and S387 (2.6 Å) of loop C in the absence of ligand is shown. The four residues essential for carbohydrate binding are labeled. e The change in regions of side-chain interactions between domain 3 and domains 1 and 2 upon ligand binding to domain 3 is circled in black.
Fig. 2
Fig. 2. Ab initio envelope models rendered as volumes and superimposed onto X-ray crystallographic models.
a X-ray model (PDB 6P8I) placed within envelope derived from SEC-SAXS data of domains 1–5 collected in the absence of b PPT1 (PDB 1EI9). The three Asn residues that are glycosylated are shown as spheres (circled in black). c The modified X-ray model of domains 1–5 (gray), representing domain 5 in the bound position with the PPT1 model (red) (PDB 1EI9) placed within the calculated ab initio envelope (rendered as a volume illustrating extra density along the most elongated axis). d Experimental scattering curve for domains 1–5 (black) overlaid with calculated scattering curves generated from X-ray model (PDB 6P8I, red) or MultiFoXS-generated model based on PDB 6P8I where either the linker between domains 4 and 5 (yellow) or linkers between both domains 3 and 4 and domains 4 and 5 (cyan) are allowed to be flexible. e MultiFoXS-4–5 (cyan line in d) derived model of domains 1–5 in the absence of ligand placed in the same envelope as in a showing relative movements (20 Å) of domains 4 (gray, PDB 6P8I, to orange) and 5 with N682 moving 37 Å (cyan, PDB 6P8I, to red). Corresponding χ2 value for the curve is shown in a and e.
Fig. 3
Fig. 3. Negative-stain electron microscopy of domains 1–5 of CI-MPR in the absence and presence of M6P.
a A survey of a negative-stain TEM image of the sample of CI-MPR domains 1–5 in the absence of 10-mM M6P. b Six representative images of reference-free class averages of the particles of CI-MPR domains 1–5 in the absence of 10-mM M6P. c Six representative class average images of the particles of CI-MPR domain 1–5 selected from a pool of 35 representative reference-free class averages in the presence of 10-mM M6P. d A survey of a negative-stain TEM image of the sample of CI-MPR domains 1–5 in the presence of 10-mM M6P. e Six representative images of reference-free class averages of the particles of CI-MPR domains 1–5 in the presence of 10-mM M6P. f Six representative class average images of the particles of CI-MPR domain 1–5 selected from a pool of 35 representative reference-free class averages in the presence of 10-mM M6P.
Fig. 4
Fig. 4. Ligand binding properties of domains 1–5 as assessed by SPR.
Sensorgrams of domains 1–5 truncated protein (10, 15, 20, 30, 40, 50, 60, 70, 80, 90, 100, 110, and 120 nM) flowing over GAA-phosphomonoester (a) or GAA phosphodiester (b) and PPT1 (c) surfaces. Inset graphs show Scatchard plots based on average RU value collected over 10-s time intervals at the end of the association phase for each concentration of domains 1–5 (red bar). The calculated KDs (−1/slope) values for two binding events are listed and n = 4 independent experiments (standard error of mean is reported). Results from the accompanying competitive inhibition study are displayed as double reciprocal plots (df) in which domains 1–5 protein (at 10, 15, 20, 30, 40, 50, 60, 70, 80, 90, 100, 110 or 120 nM concentration) was preincubated for 2 h with 0, 40, 80, or 100-nM PPT1 (as indicated in d) before being flowed over the three different lysosomal enzyme surfaces as indicated in ac.
Fig. 5
Fig. 5. FPOP analysis of domains 1–5 in the absence and presence of PPT1 at pH 6.5.
a FPOP comparison of domains 1–5 alone and in the presence of PPT1 reveals peptides protected (red shaded region and colored by domain: d1, blue; d2, magenta; d3, green; d4, orange; or d5, cyan) or exposed (green shaded region and colored by domain) upon binding, while most peptides (black circles) show no statistically significant (p ≤ 0.05) changes (unshaded region). b Comparison of peptides (dashed black ovals) (mapped onto SAXS-generated model of bound domain 3 and unbound domain 5) undergoing changes in oxidation in the absence and presence of PPT1 ligand (red mesh and ribbon, peptides more protected, green mesh and ribbon, peptides less protected in the presence of PPT1, gray spheres, no data available). Ligand binding loop C is circled. c Domain 5 peptides showing protection from oxidation in the presence of PPT1 mapped onto the model in b (dashed black ovals). β strands affected are labeled. d Peptides in domains 4 (orange dashed oval) and 5 (cyan dashed oval) showing changes in exposure and protection in the presence of PPT1 mapped onto the current model of domain 5 being ligand-free and domain 3 ligand bound. The arrow indicates the possible movement of domain 5, which would result in the protection of both peptides and produce an overall molecular shape consistent with SAXS data.
Fig. 6
Fig. 6. Possible secondary site of oligosaccharide interaction.
a Small molecule “hot spots” identified through the use of the FTMap server (http://ftmap.bu.edu/login.php) are shown (colored stick representation) on the model of domains 1–5 bound to a ligand in domain 3. Region of predicted small molecule interaction near secondary site proposed from analysis of FPOP data is circled in dashed black line. Loop C of the M6P binding site (circled in dashed red line) is labeled (domains are colored d1, blue; d2, magenta; d3, green). b Molecular dynamics simulations were used to map the extent of movement the 3 N-linked glycans of PPT1 can undergo (mannose moieties are represented by green spheres while blue boxes are used to represent GlcNAc). c PPT1 (PDB 1EI9) (red) structure is overlaid on the model of domains 1–5 (dark gray) with domain 3 bound and domain 5 in the unbound position with the oligosaccharide on N232 of PPT1 resting near Loop C (binding site) of domain 3. The oligosaccharide on N212 of PPT1 is located near strand 7 (magenta) of domain 1. Small molecule “hot spots” are circled in dashed black line. Mannose moieties are represented by green spheres while blue boxes are used to represent GlcNAc.
Fig. 7
Fig. 7. Domains 1–5 adopt a more compact conformation at pH 4.5 compared to pH 6.5.
a A plot of the calculated Stokes radius derived from SEC data collected under different pH conditions for domains 1–5, domains 7–15, and domains 1–15. b The observed changes in calculated Stokes radius (ΔRs) for domains 1–5, 7–15, and 1–15 normalized per number of domains in each construct. c FPOP analysis of domains 1–5 at pH 6.5 versus 4.5 revealing peptides protected (red shaded region) or exposed (green shaded region) (colored by domain: d1, blue; d2, magenta; d3, green; d4, orange; or d5, cyan) upon lowering of pH to that of the endosome. d The overlay of Cα atoms of domain 1 of N-terminal 5 domains of full-length CI-MPR of the cryo-EM structure determined at pH 4.5 (gray ribbon) (PDB 6UM1) with our domain 1–5 structure crystallized at pH 5.5 (PDB 6P8I) (domain 5 bound to the oligosaccharide of a crystallographic neighbor). Strands 2 and 3 of both domain 4 structures have been labeled and circled with either a solid red line (PDB 6P8I) or a dashed red line (6UM1) to illustrate displacement of domain 4. e Enlargement of the area in d showing the intersection of domains 2, 4, and 5. Displacement of sulfur atoms (reported in Å) of disulfide bonds (red arrows) between structures PDB 6UM1 and PDB 6P8I illustrating the change in orientation of domains at lower pH and in the absence of a bound CRD. f Mapping of FPOP data from c and Supplementary Fig. 6a onto domains 1–5 of pH 4.5 cryo-EM model (PDB 6UM1). Peptides showing a higher degree of protection at pH 4.5 versus 6.5 are mapped (red spheres) onto the SAXS-based model of domains 1–5 in the absence of ligands, while those showing less protection are mapped as green spheres. Model regions undergoing no statistically significant changes or lacking data are represented as ribbons. The lowering of the pH causes strand 2 of domain 4 to become less protected while the atoms of strand 3 (circled in black) become more protected under these conditions.
Fig. 8
Fig. 8. Occlusion of carbohydrate-binding site of domain 9 of endogenous bovine CI-MPR in the presence of IGF2 (PDB 6UM2) supporting hypothesis that CI-MPR ligand binding is allosterically regulated.
a Cartoon representation showing domain 9’s (blue) C-terminal β sheet’s interaction with the N-terminal β sheet of domain 8 (teal). The binding site of domain 9 faces into domain 6 (salmon) restraining loops B and C essential for ligand binding. The four essential carbohydrate-binding residues (sticks: Gln, Arg, Glu, and Arg) of domain 9 are shown. Adjacent domains (domains 6, 8, and 11) are represented as molecular surfaces. The second panel is rotated 90° downward along the x-axis relative to the first panel. b Cartoon representation illustrating the change of position in domain 9 of CI-MPR (PDB 6UM1) when exposed to pH 4.5 buffer conditions compared to pH 7.4 in the presence of IGF2 (a). For clarity, the second panel is rotated 180° along the y-axis relative to the original showing the change in solvent accessibility of the binding site at pH 4.5.

References

    1. Ghosh P, Dahms NM, Kornfeld S. Mannose 6-phosphate receptors: new twists in the tale. Nat. Rev. Mol. Cell Biol. 2003;4:202–212. - PubMed
    1. Kim JJ, Olson LJ, Dahms NM. Carbohydrate recognition by the mannose-6-phosphate receptors. Curr. Opin. Struct. Biol. 2009;19:534–542. - PMC - PubMed
    1. El-Shewy HM, Luttrell LM. Insulin-like growth factor-2/mannose-6 phosphate receptors. Vitam. Horm. 2009;80:667–697. - PubMed
    1. Blanchard F, et al. The mannose 6-phosphate/insulin-like growth factor II receptor is a nanomolar affinity receptor for glycosylated human leukemia inhibitory factor. J. Biol. Chem. 1998;273:20886–20893. - PubMed
    1. Morgan DO, et al. Insulin-like growth factor II receptor as a multifunctional binding protein. Nature. 1987;329:301–307. - PubMed

Publication types

MeSH terms