. 2020 Sep;585(7825):440-446.
doi: 10.1038/s41586-020-2710-1. Epub 2020 Sep 9.

TRIM37 controls cancer-specific vulnerability to PLK4 inhibition

Affiliations

TRIM37 controls cancer-specific vulnerability to PLK4 inhibition

Franz Meitinger et al. Nature. 2020 Sep.

Abstract

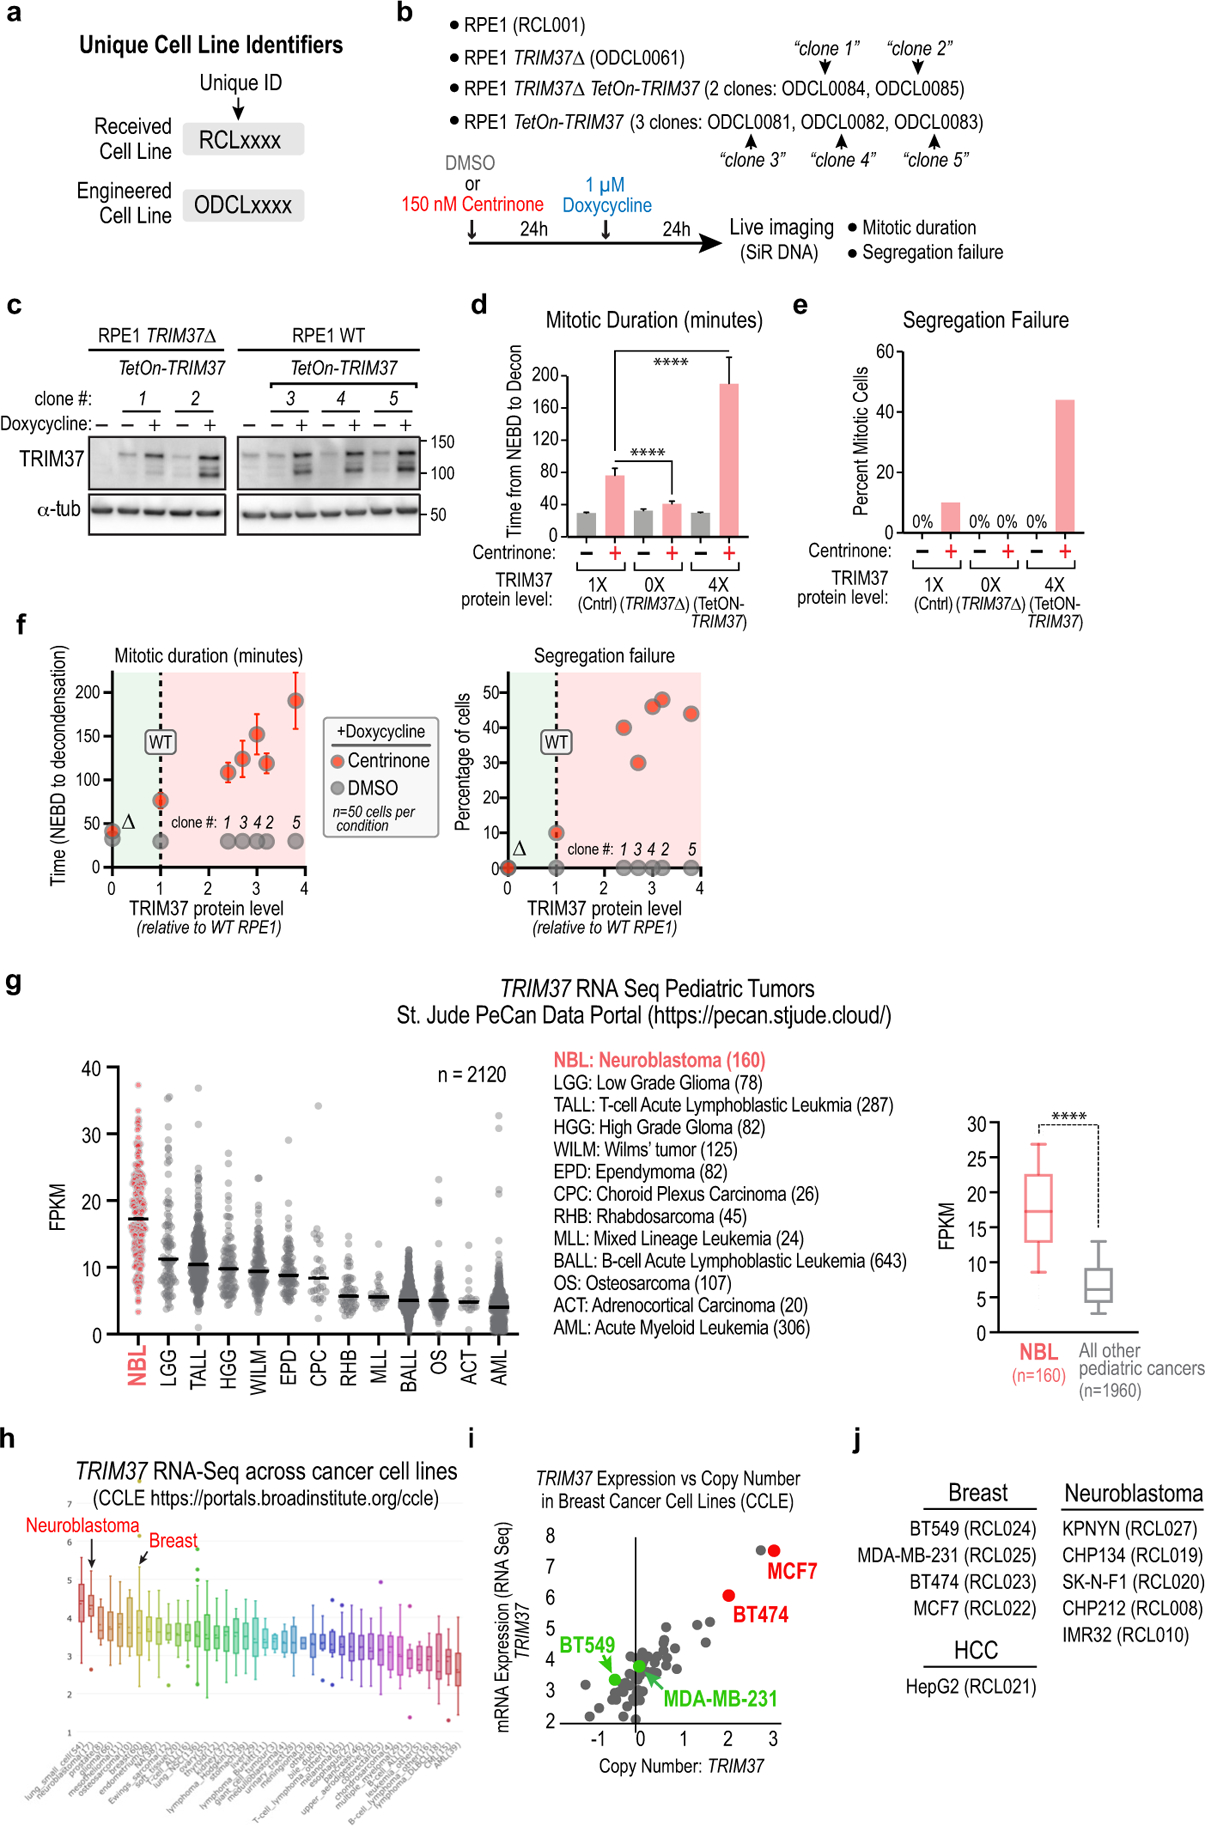
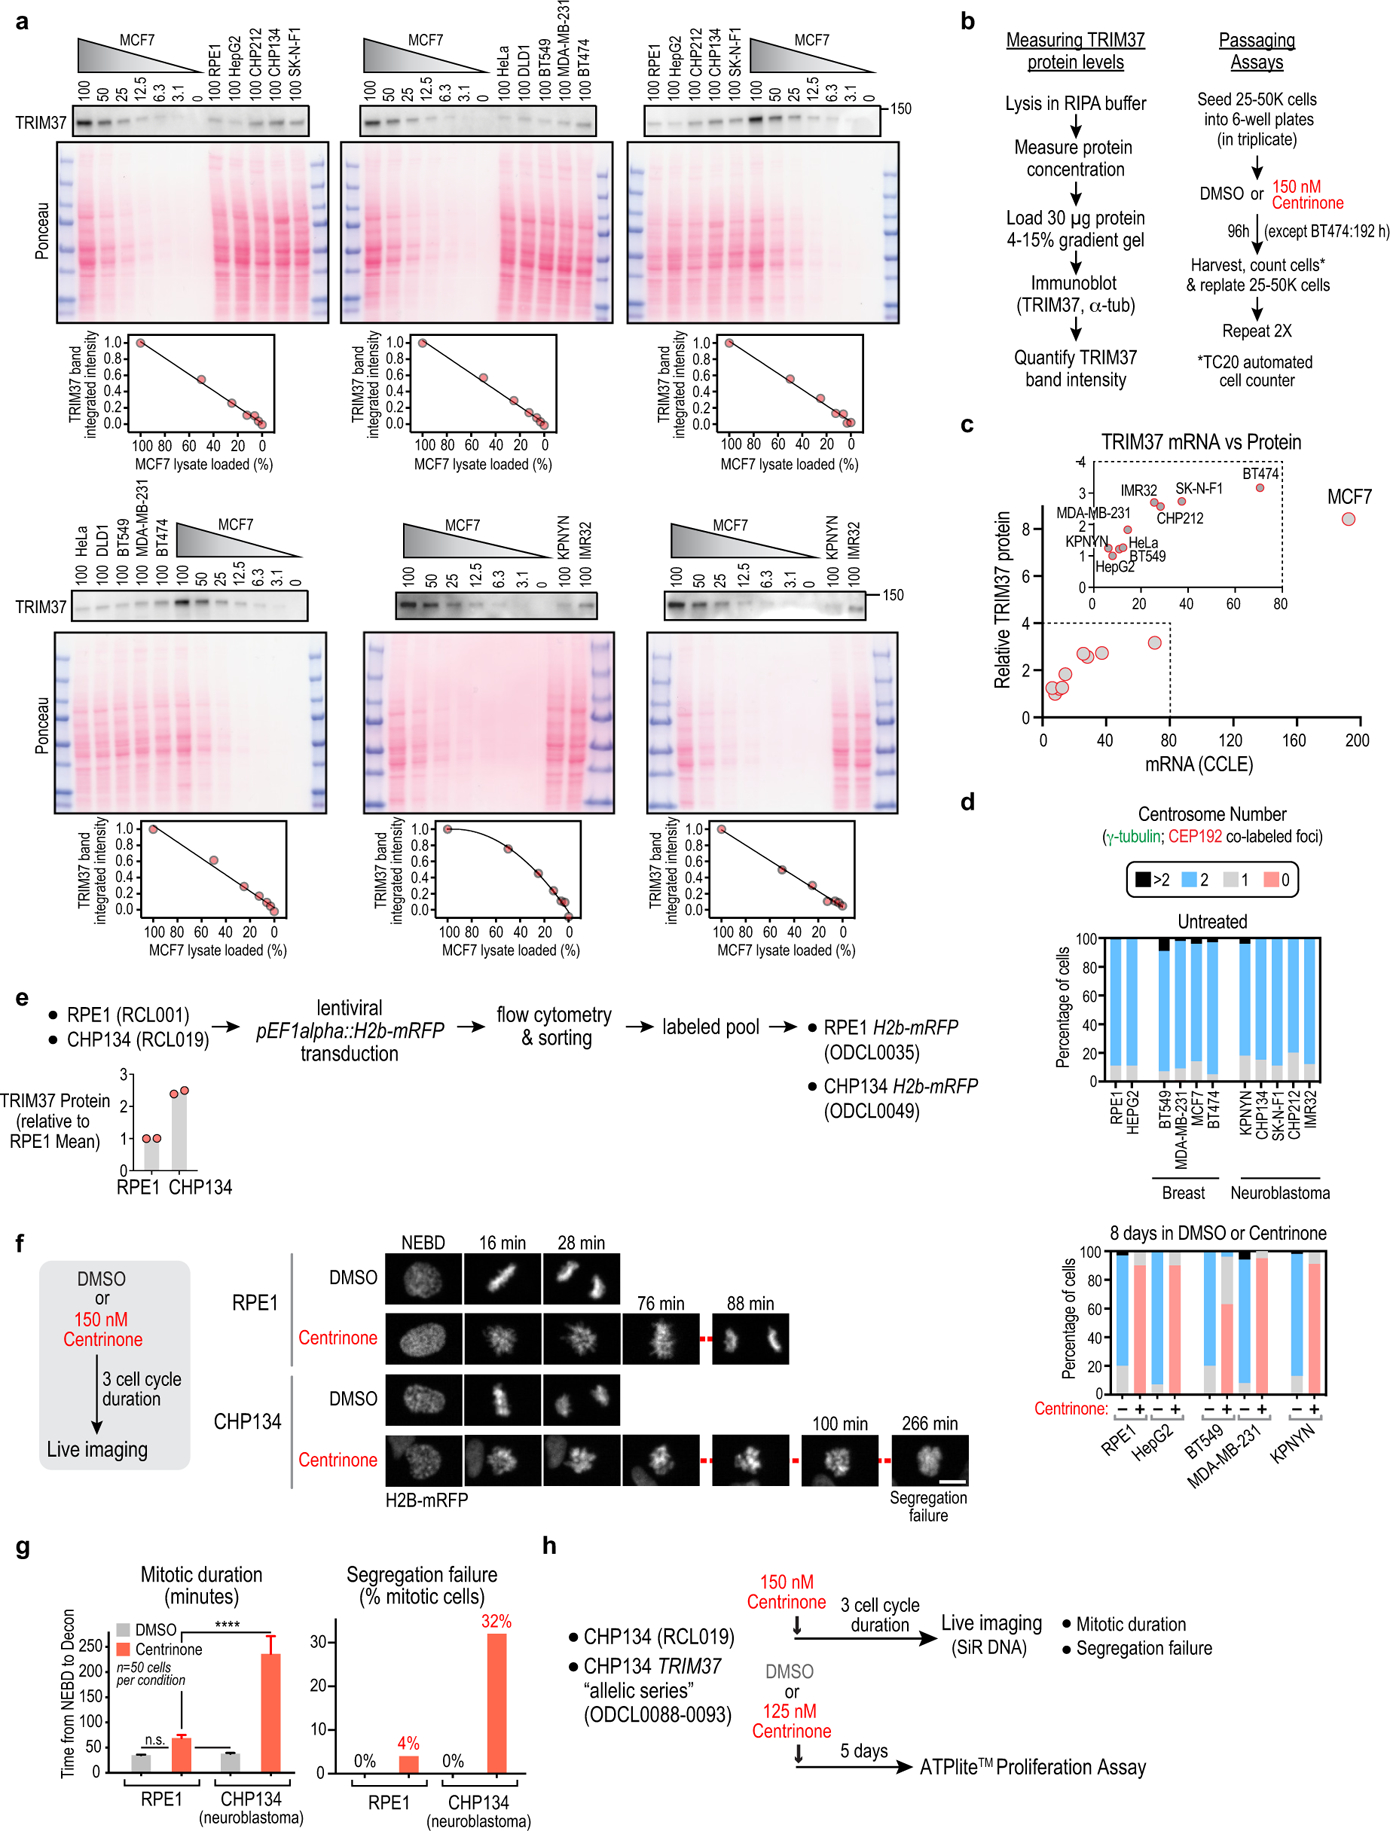
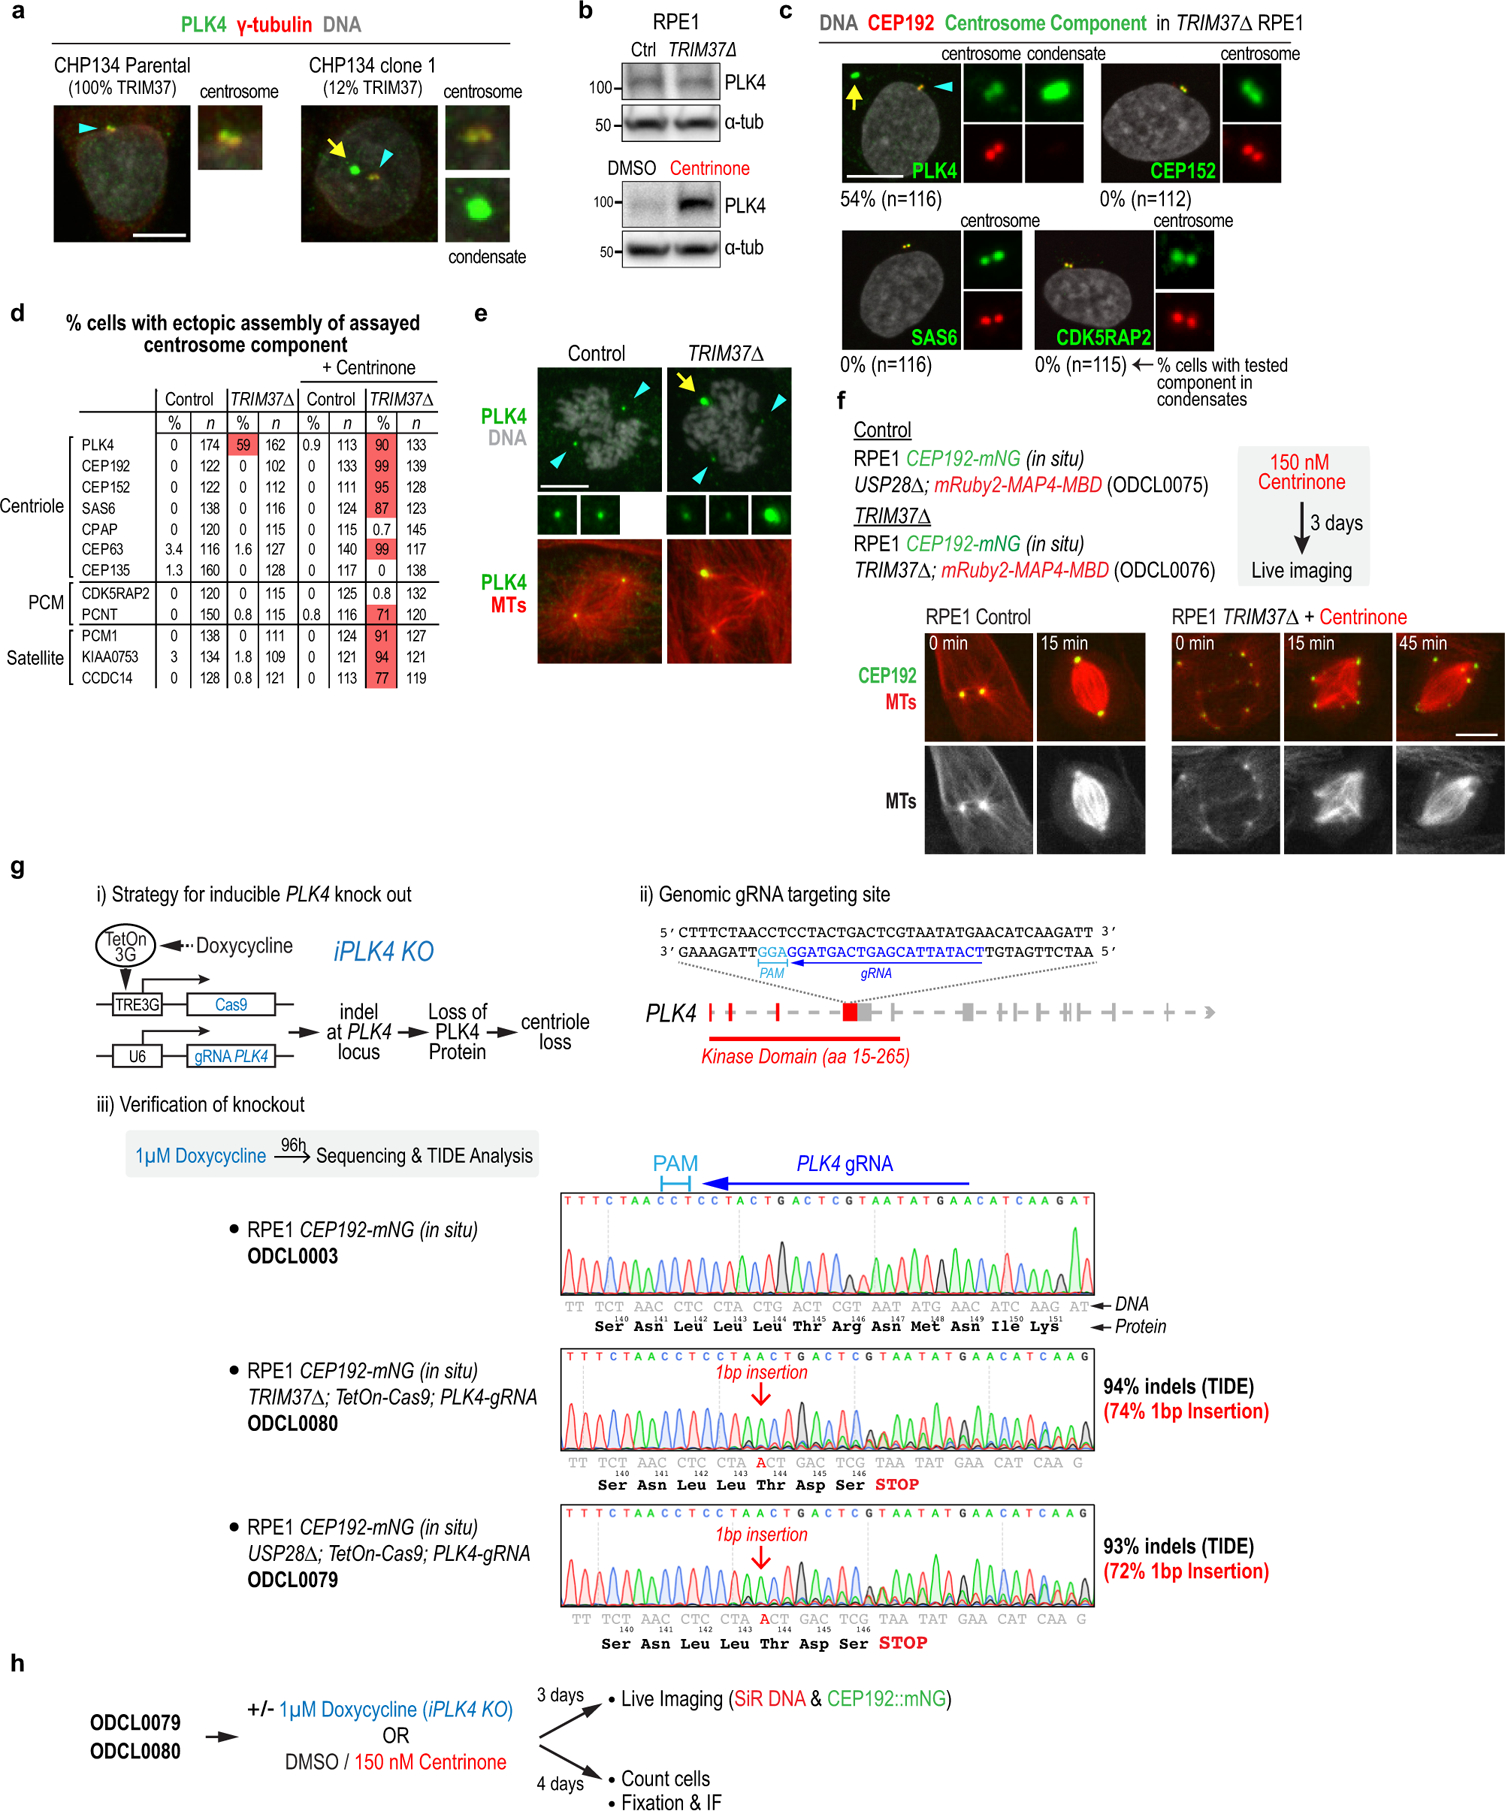
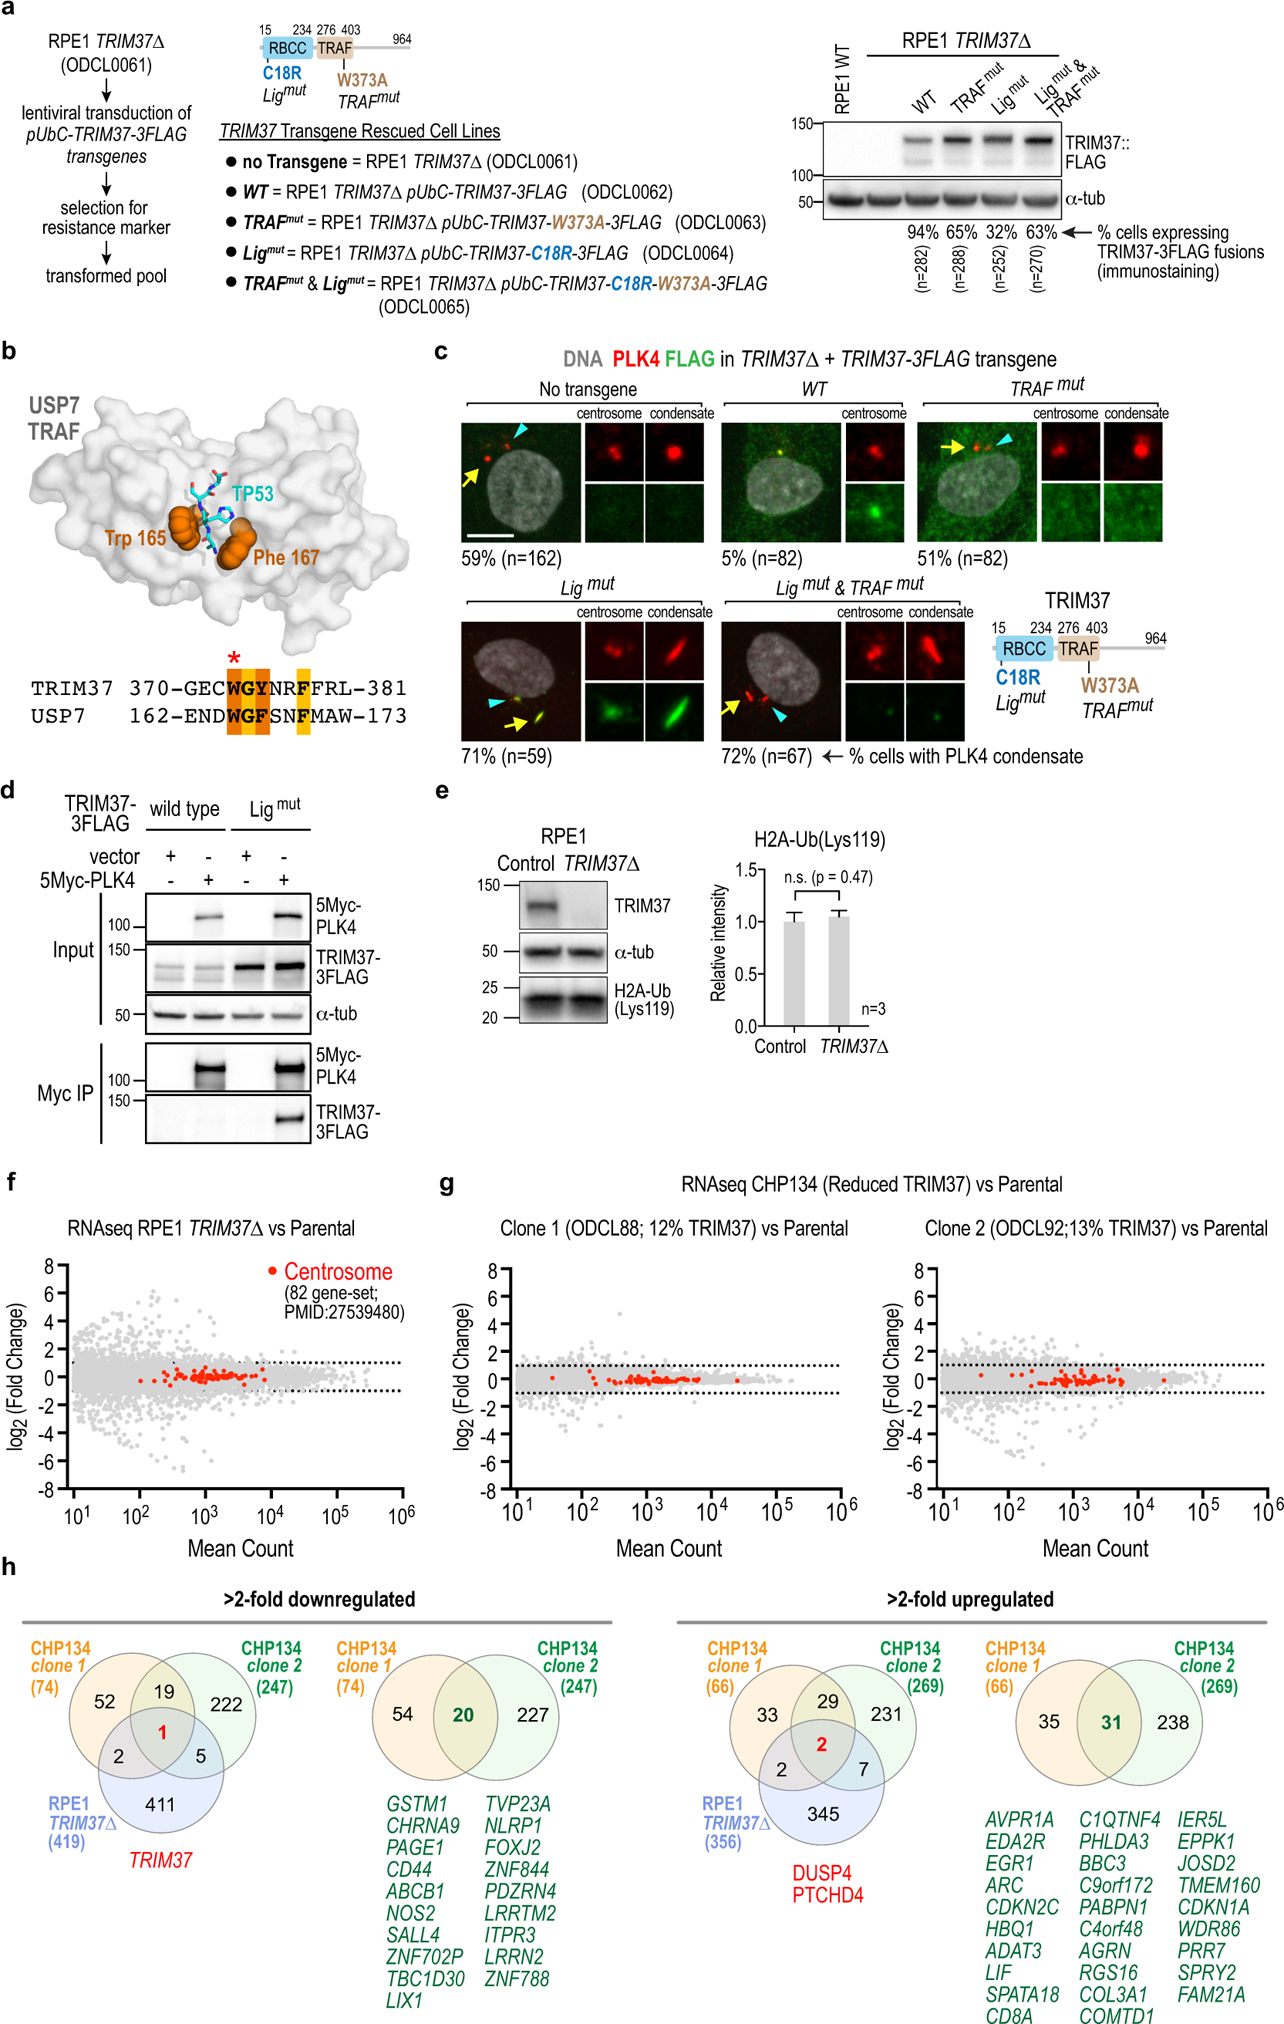
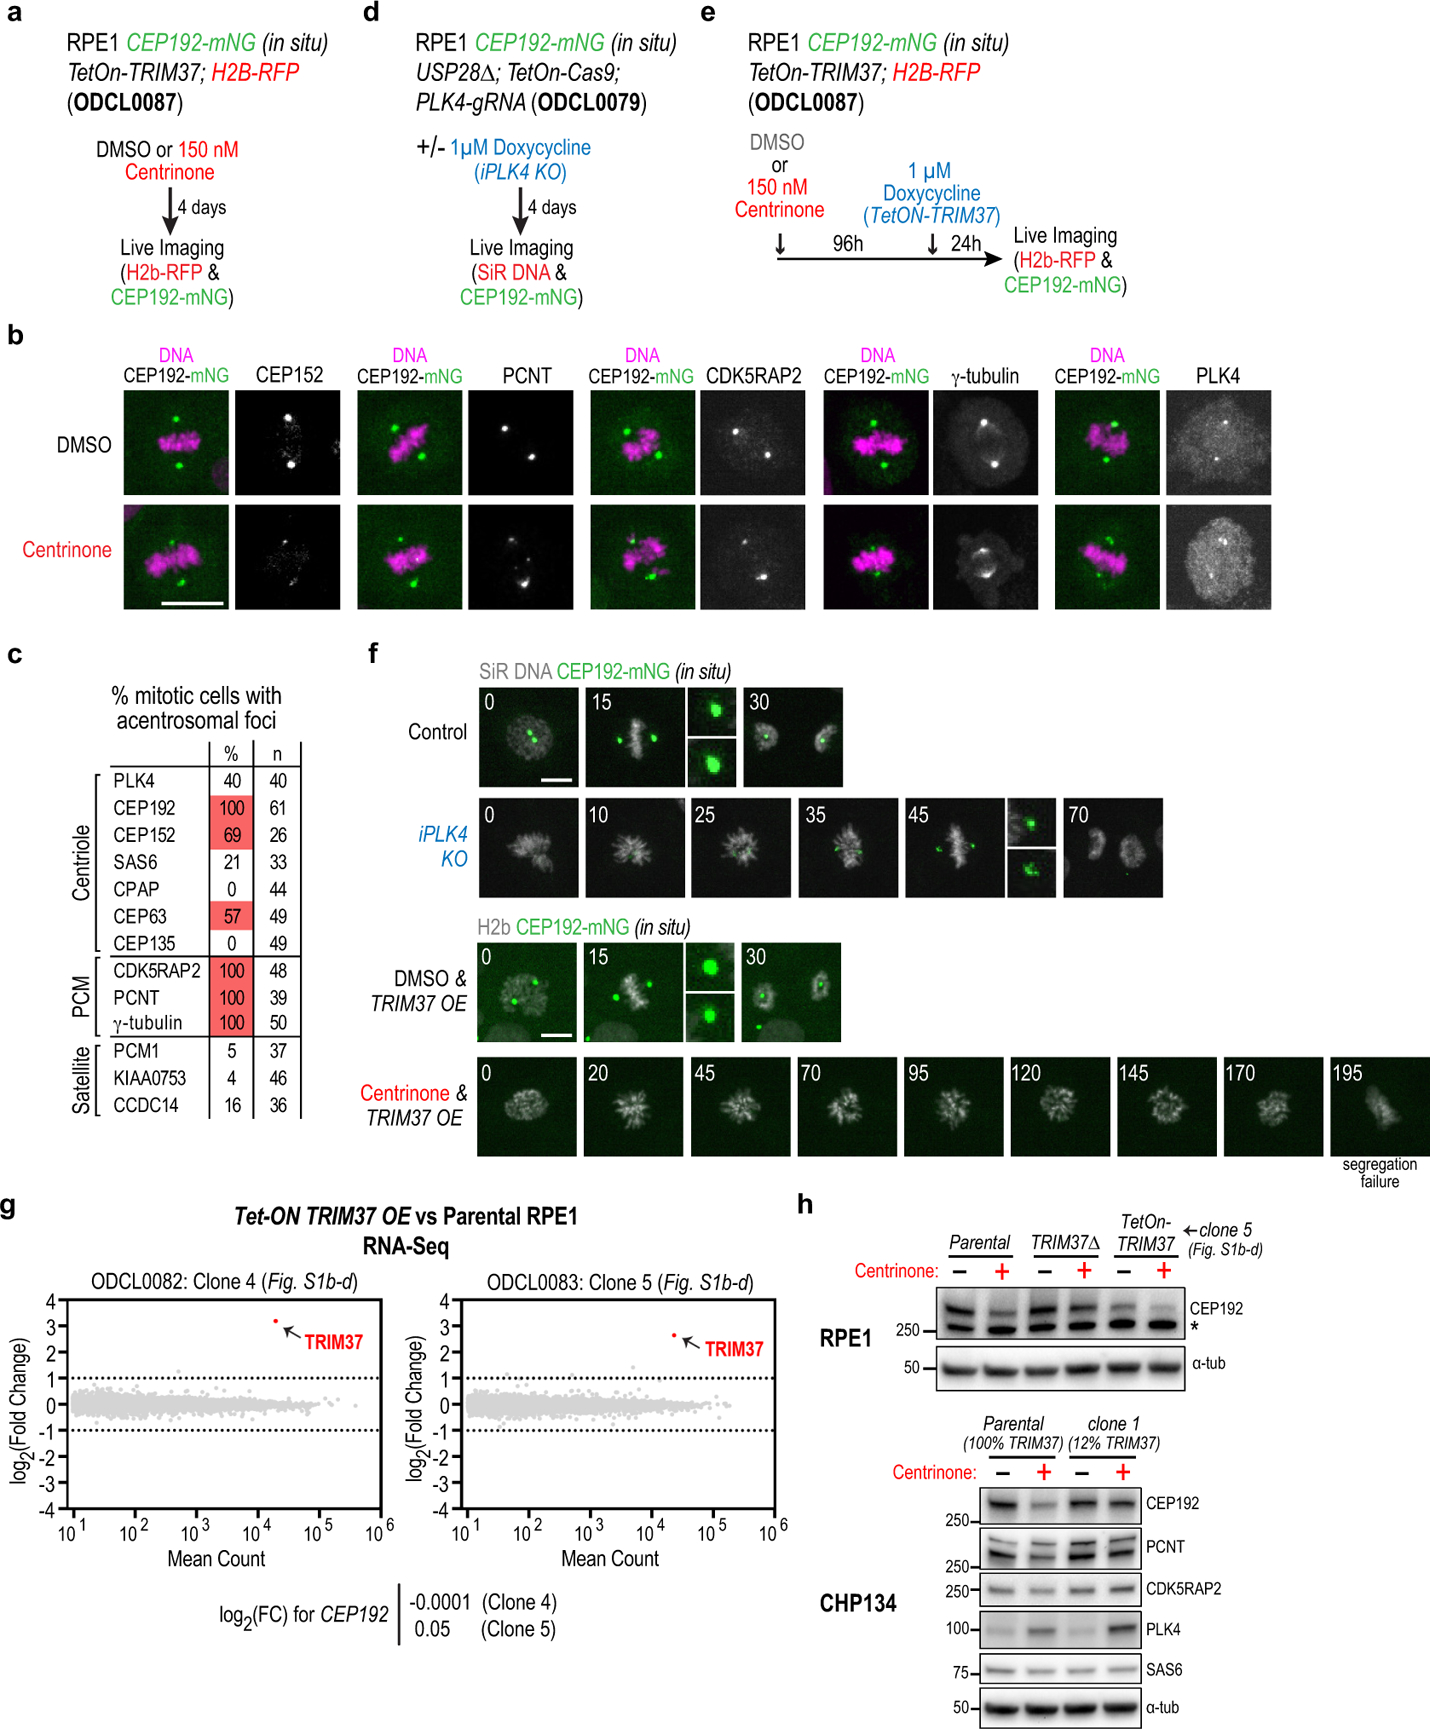
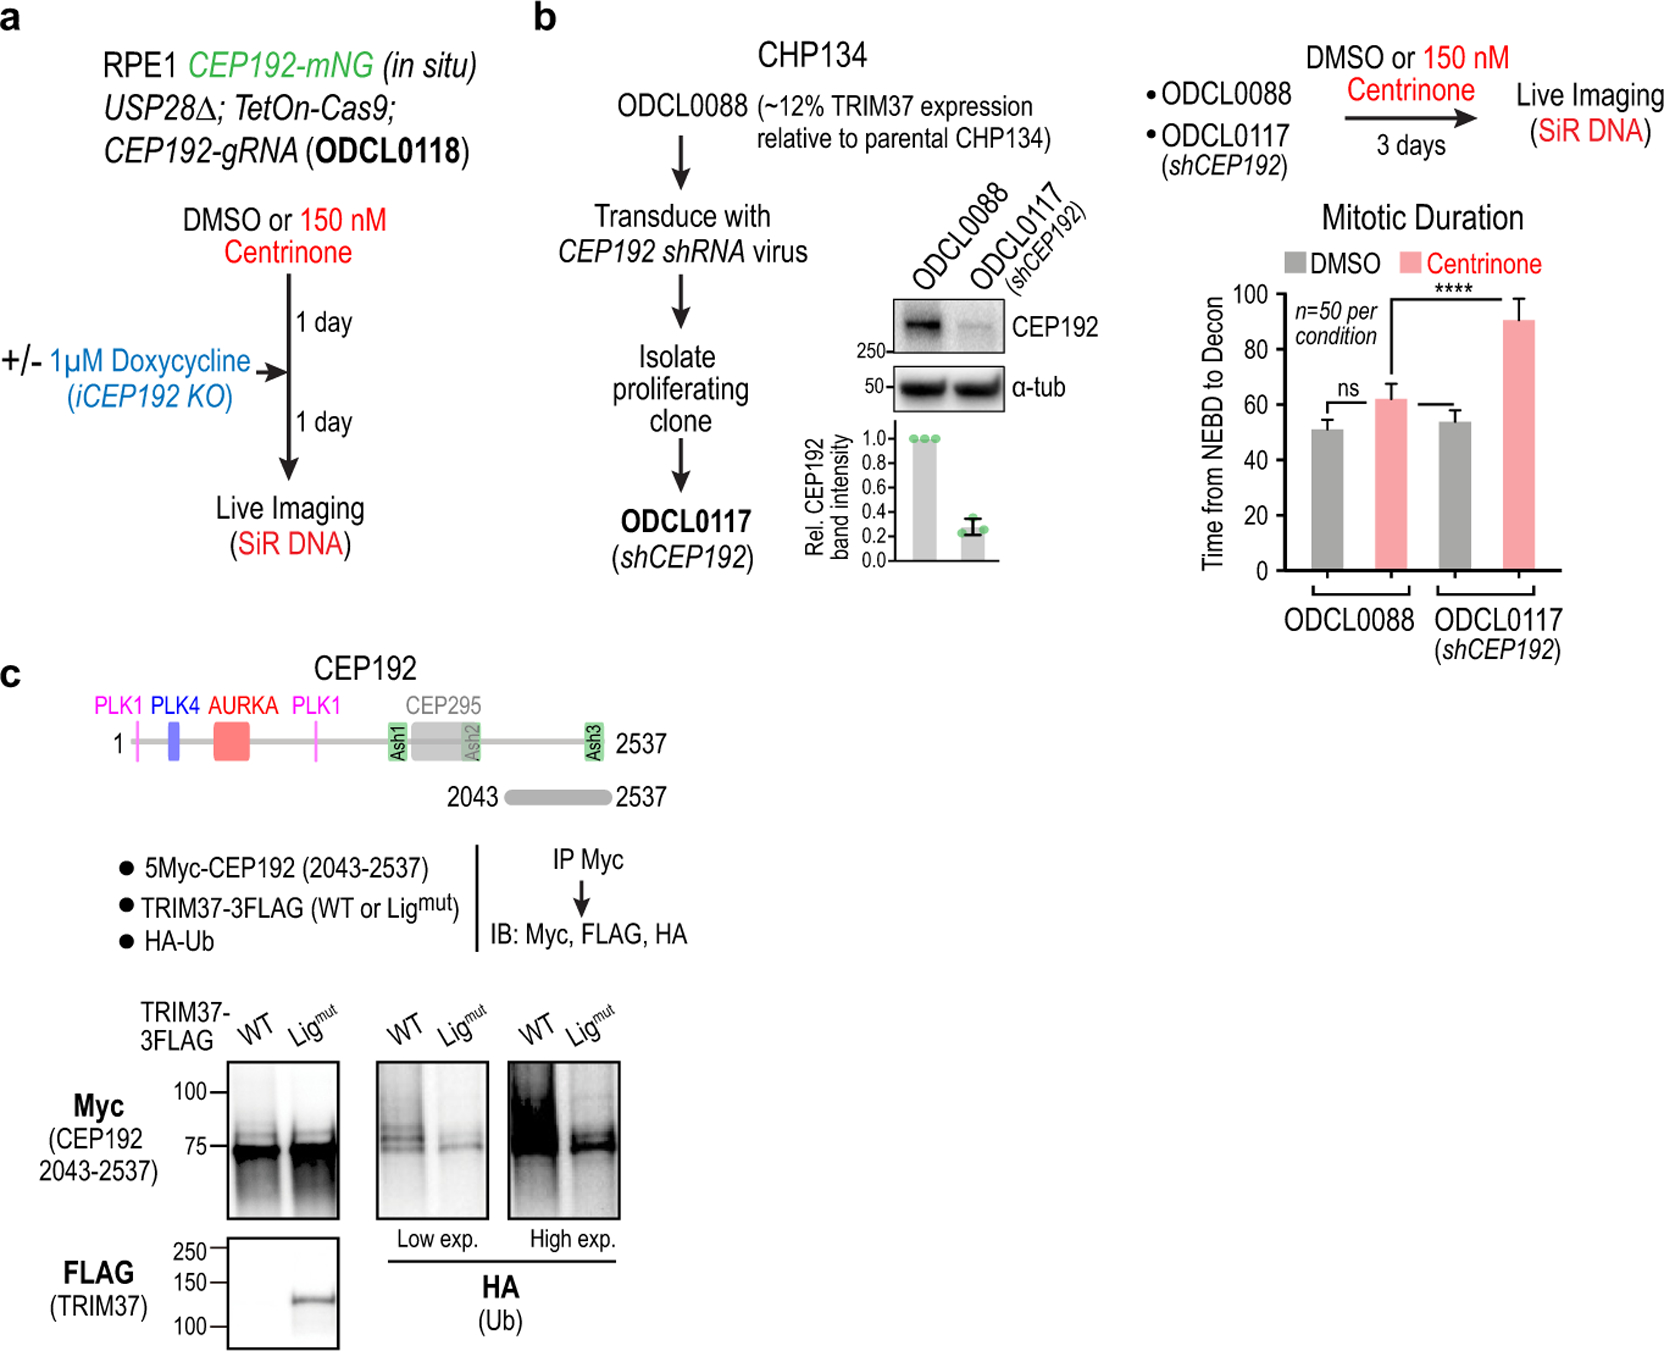
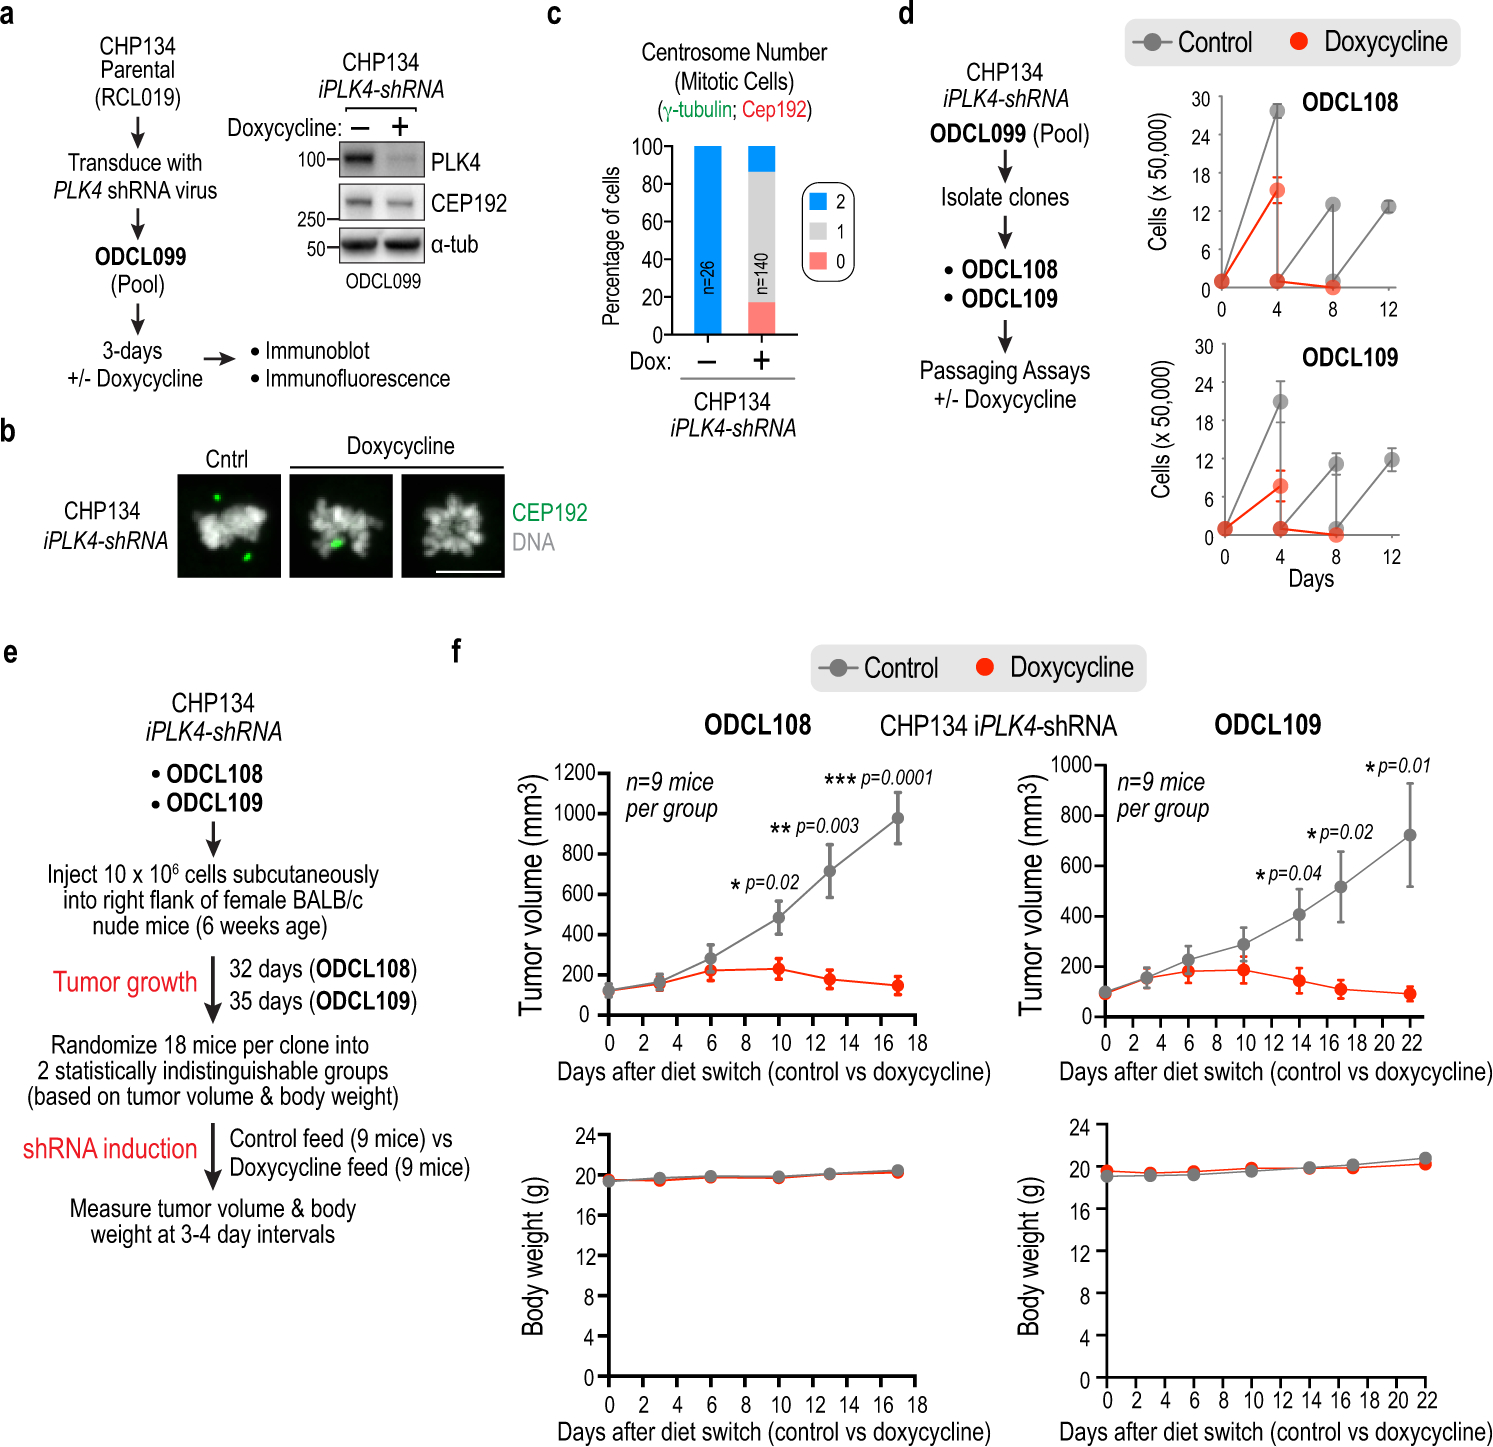
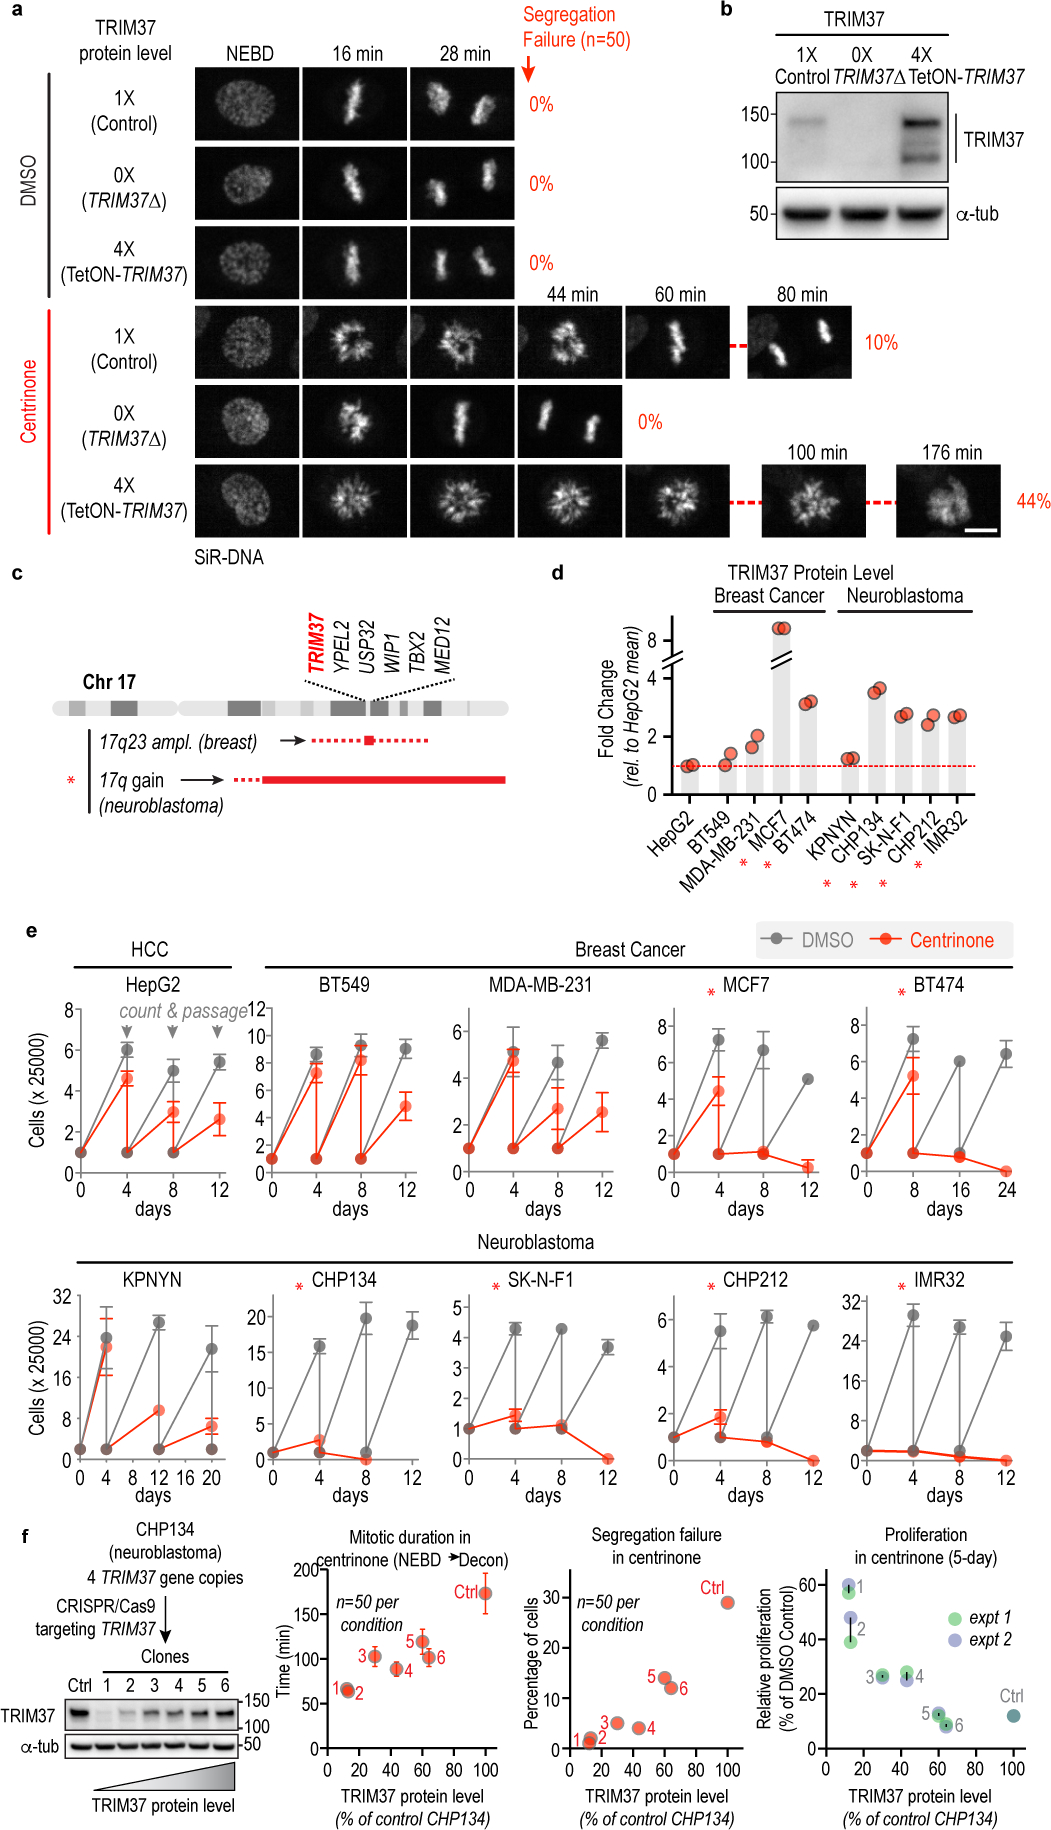
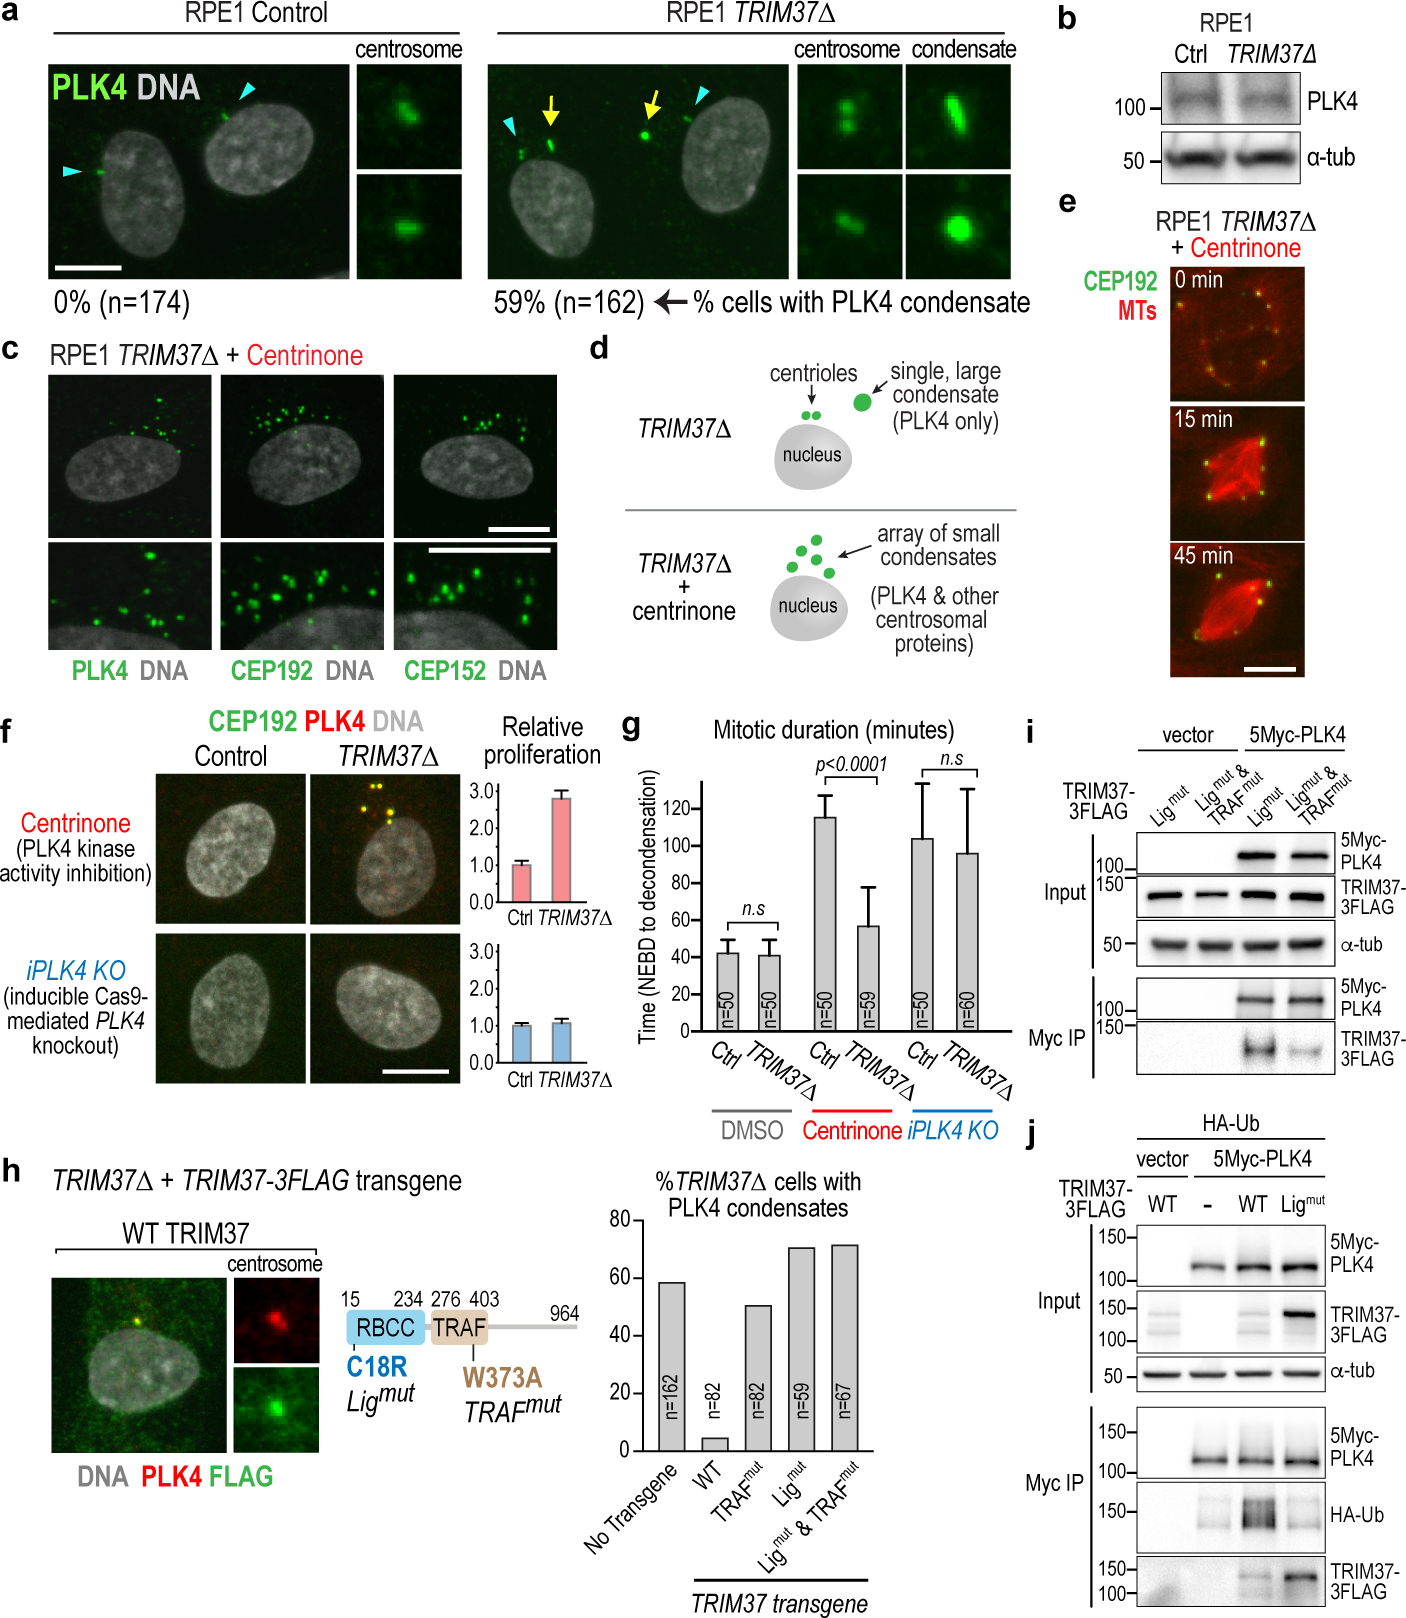
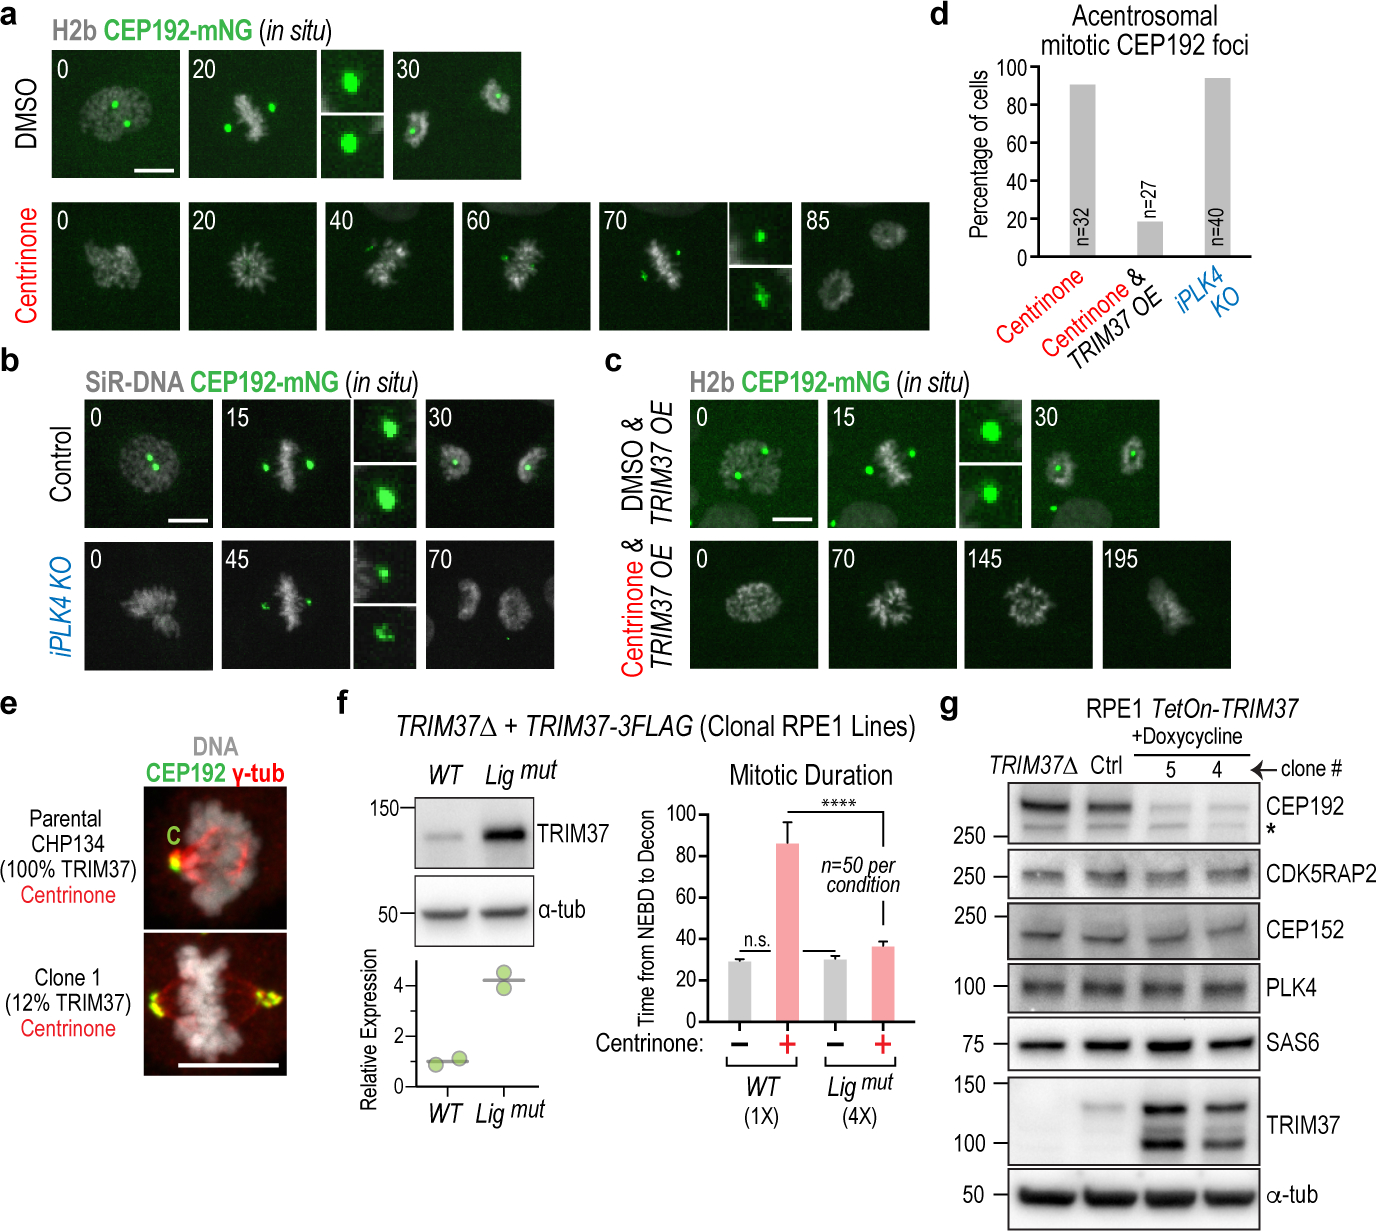
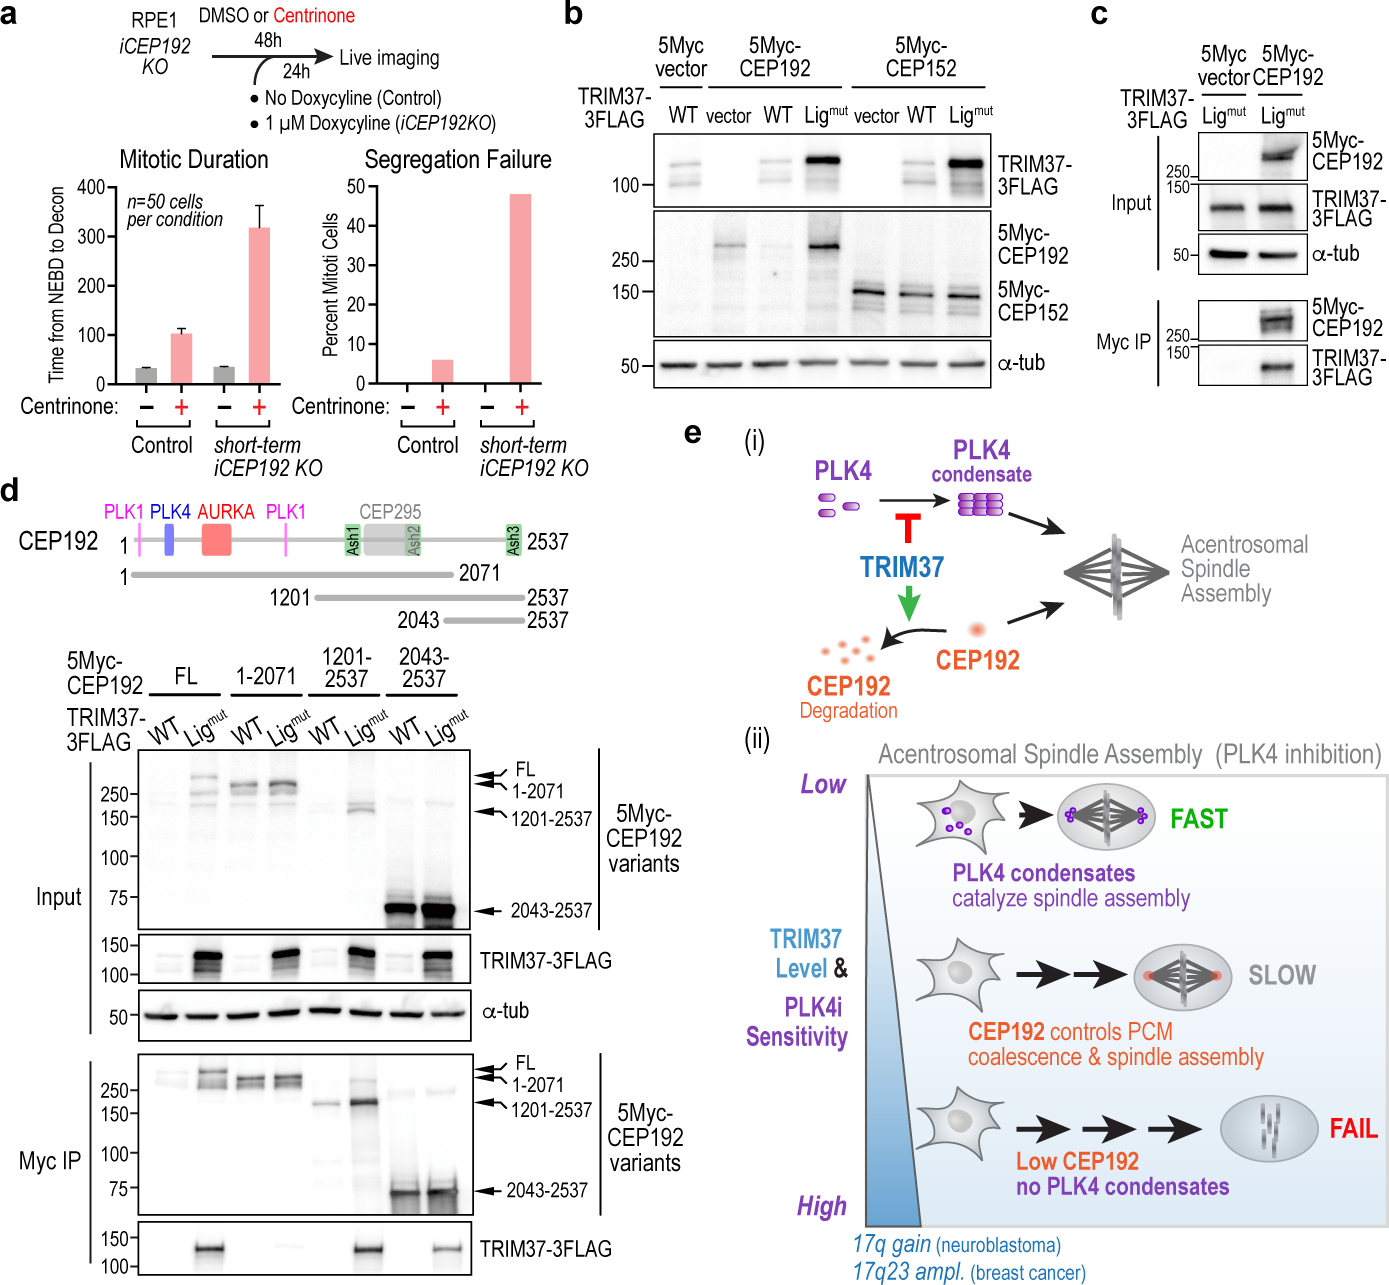
Centrosomes catalyse the formation of microtubules needed to assemble the mitotic spindle apparatus1. Centrosomes themselves duplicate once per cell cycle, in a process that is controlled by the serine/threonine protein kinase PLK4 (refs. 2,3). When PLK4 is chemically inhibited, cell division proceeds without centrosome duplication, generating centrosome-less cells that exhibit delayed, acentrosomal spindle assembly4. Whether PLK4 inhibitors can be leveraged as a treatment for cancer is not yet clear. Here we show that acentrosomal spindle assembly following PLK4 inhibition depends on levels of the centrosomal ubiquitin ligase TRIM37. Low TRIM37 levels accelerate acentrosomal spindle assembly and improve proliferation following PLK4 inhibition, whereas high TRIM37 levels inhibit acentrosomal spindle assembly, leading to mitotic failure and cessation of proliferation. The Chr17q region containing the TRIM37 gene is frequently amplified in neuroblastoma and in breast cancer5-8, rendering these cancer types highly sensitive to PLK4 inhibition. We find that inactivating TRIM37 improves acentrosomal mitosis because TRIM37 prevents PLK4 from self-assembling into centrosome-independent condensates that serve as ectopic microtubule-organizing centres. By contrast, elevated TRIM37 expression inhibits acentrosomal spindle assembly through a distinct mechanism that involves degradation of the centrosomal component CEP192. Thus, TRIM37 is an essential determinant of mitotic vulnerability to PLK4 inhibition. Linkage of TRIM37 to prevalent cancer-associated genomic changes-including 17q gain in neuroblastoma and 17q23 amplification in breast cancer-may offer an opportunity to use PLK4 inhibition to trigger selective mitotic failure and provide new avenues to treatments for these cancers.


Conflict of interest statement

COMPETING INTERESTS

K.O., A.D., A.K.S., R.L.D., and F.M. are inventors on a pending patent application from the Ludwig Institute for Cancer Research Ltd, application number PCT/US2018/026720. “TRIM37 levels predict sensitivity to PLK4 inhibition in cancer cells”.

Figures

Extended Data Figure 1.
Extended Data Figure 1.. Effect of varying TRIM37 levels on sensitivity to PLK4 inhibition and TRIM37 expression profile in patient-derived tumors and cancer cell lines.
(a) Unique cell line identifiers are used to describe the cell lines in each experiment. The RCL prefix refers to cell lines received from an external source, such as the American Type Culture Collection (ATCC). The ODCL prefix refers to cell lines engineered from received cell lines. (b) Cell line code and experimental protocol for the analysis of mitotic duration and chromosome segregation failure. Clone 5 is the Tet-ON TRIM37 cell line shown in Fig. 1a,b, which overexpresses TRIM37 ~4-fold relative to parental RPE1 cells. (c) Immunoblots of the RPE1 cell lines described in (b); transgene-encoded TetON-TRIM37 expression was induced for 24h. (d,e) Graphs plotting mitotic duration (d) and the frequency of chromosome segregation failure (e) following treatment with DMSO (−) versus centrinone (+) for the 3 analyzed cell lines shown in Fig. 1a,b; n= 50 for each condition. Error bars are 95% CI. (f) Live imaging-based analysis was used to measure mitotic duration and segregation failure for the cell lines described in (b); values are plotted versus TRIM37 protein level measured by semi-quantitative western blotting. Each cell line was treated with DMSO (grey) or centrinone (red) and doxycycline before live imaging – experimental scheme is shown in panel (b). 50 cells were analyzed per condition. Error bars are 95% CI. In DMSO, the analyzed cell lines exhibited normal mitotic duration and segregation fidelity regardless of TRIM37 protein level. By contrast, in centrinone, loss of TRIM37 reduced mitotic duration and segregation failure percentage (green shading) whereas increased TRIM37 protein levels led to a proportional increase in mitotic duration and segregation failure rate (red shading). (g) (left) Graph plotting TRIM37 mRNA level in 2120 pediatric tumors, representing 13 different cancer types (data is from the St. Jude PeCan Data Portal). All pediatric cancer types with >10 tumors analyzed are shown. Values for individual tumors (dots) and the median value (black lines) are plotted. The 3-letter codes to the right of the graph describe the 13 pediatric cancer types. Neuroblastoma tumors exhibit the highest TRIM37 expression. (right) Box-and-whiskers plot, comparing TRIM37 mRNA levels in neuroblastoma tumors to that all other pediatric cancer type tumors. The range represents 10–90th percentile of the data; the p-value shown is from an unpaired t-test. (h) Graph plotting TRIM37 mRNA levels across cancer cell lines described in the Cancer Cell Line Encyclopedia (CCLE; https://portals.broadinstitute.org/ccle). (i) mRNA expression versus copy number from CCLE data for breast cancer cell lines. Two cell lines with high TRIM37 copy number and expression (MCF7 and BT474; red), as well as two cell lines with normal copy number and expression (MDA-MB-231 and BT549; green) are marked. (j) List of breast cancer and neuroblastoma cell lines used for analysis in Fig. 1d–e. HepG2 is a hepatocellular carcinoma-derived cell line with similar TRIM37 expression to control RPE1 cells. For gel source data see Supplementary Figure 1.
Extended Data Figure 2.
Extended Data Figure 2.. Analysis of TRIM37 protein levels and centrinone efficacy in different cancer cell lines and comparison of mitosis in RPE1 and CHP134 neuroblastoma cells following centrinone treatment.
(a) Immunoblots used to quantify TRIM37 protein level across different cell lines. TRIM37 immunoblots are shown above the corresponding Ponceau-stained blots. MCF7 cells have the highest TRIM37 transcript levels and copy number in the CCLE (Extended Data Fig. 1i). Serial dilutions of MCF7 extract were loaded next to extracts from other cell lines on each blot and TRIM37 band intensities across a serial dilution of MCF7 cell extract were used to generate a standard curve (graphs below each blot); measured intensities for other cell line extracts were converted into relative expression values using the standard curve. TRIM37 protein level in HepG2 cells was set to 1 and values measured for other cell lines were plotted relative to the HepG2 level in Fig 1d. (b) Schematics of protocols used to measure TRIM37 protein levels (left) and conduct passaging-based proliferation analysis of cancer cell lines (right). (c) Comparison of TRIM37 mRNA and protein levels across cancer cell lines. mRNA levels are from the CCLE and were transformed from a logarithmic (base 2) to a linear scale. Protein levels are the mean value of two measurements conducted as in (a) and are plotted relative to the amount of TRIM37 in HepG2, a non-amplified cancer cell line. Inset graph excludes MCF7, which shows exceptionally high TRIM37 mRNA and protein levels. (d) Quantification of centrosome number in the indicated cell lines and conditions (n = 100 for each condition). Centrosomes were defined as co-localized foci of CEP192 and γ-tubulin in fixed interphase cells. In the absence of any treatments, there is mild centrosome amplification in the breast cancer cell lines and in one neuroblastoma cell line. Following 8-day centrinone treatment, a significant proportion of the cells from cell lines with relatively low sensitivity to centrinone lacked centrosomes. (e) Schematic of method used to generate a pool of cells expressing H2b-mRFP for each of the indicated cell lines. TRIM37 protein level relative to RPE1, measured by semi-quantitative immunoblotting. (f) Images are stills from timelapse sequences of H2b-RFP expressing mitotic RPE1 and CHP134 cells. Both cell lines exhibit rapid mitosis (~30 minutes) with no segregation failure in DMSO. Following centrinone treatment, CHP134 cells exhibited significantly more delayed mitosis and higher rates of segregation failure compared to RPE1 cells. Scale bar is 10 μm. (g) Quantification of mitotic duration and segregation failure comparing RPE1 and CHP134 cells. (h) Schematic of protocols used to analyze mitotic duration, segregation failure and viability of the CHP134-derived cell line panel with different levels of TRIM37 protein.
Extended Data Figure 3.
Extended Data Figure 3.. Analysis of TRIM37Δ cells, rescue with TRIM37 variants and generation of inducible PLK4 knockout.
(a) PLK4 condensate formation in CHP134 neuroblastoma cells with reduced TRIM37 expression. Parental CHP134 cells, which have 4 copies of the TRIM37 gene, were compared to clone 1 (Fig. 1f; ~12% TRIM37 expression relative to parental CHP134). PLK4 condensates were observed in 23% of the clone 1 cells with reduced TRIM37 expression but in none of the parental cells (n=100 for each). (b) Immunoblots in RPE1 cells comparing the effect on PLK4 protein levels of TRIM37 deletion (top) versus inhibition of PLK4 kinase activity using centrinone (bottom). PLK4 protein levels were elevated ~ 7-fold by following kinase activity inhibition (7.4 ± 1.1 mean±SD, n=3) confirming that the detected band corresponds to PLK4. The TRIM37Δ blot is the same as in Fig. 2b. (c) Immunofluorescence images of the indicated centrosomal components in TRIM37Δ cells. Scale bar, 10 μm. (d) Summary of immunofluorescence analysis in interphase cells. (e) Immunofluorescence image showing microtubule organization by a PLK4 condensate in a mitotic TRIM37Δ cell. Scale bar, 10 μm. (f) (top) Schematic of the protocol used to conduct live imaging of CEP192 and microtubules. (bottom) Images of control and centrinone-treated TRIM37Δ cells with in situ mNG-tagged CEP192 and a transgene that expresses a red fluorescent microtubule-binding domain. Times in minutes after NEBD are noted on each panel. Scale bar, 10 μm. The merged TRIM37Δ images are the same as those shown in Fig. 2e. (g) Description and validation of inducible PLK4 knockout engineered in TRIM37Δ and control (USP28Δ) cells. USP28Δ cells were used as the control because inactivation of USP28 prevents p53 activation and G1 arrest that is observed as a consequence of delayed mitosis following centrosome loss in RPE1 cells. Note that USP28Δ has no effect on the mitotic consequences of centrosome loss and enables comparison with TRIM37Δ cells, which prevent p53 activation following centrinone treatment by accelerating mitosis in the absence of centrosomes. The gRNA sequence used to target PLK4 exon 5 is depicted and the efficacy of the inducible knockout in both cell lines was validated by inducing Cas9 expression using doxycycline for 4 days, followed by sequencing and TIDE analysis. Sequence traces show high frequency of indels, with a 1 bp insertion being the most common outcome. (h) Schematic of protocol used to compare centrinone treatment to inducible PLK4 knockout in Fig. 2f,g. For gel source data see Supplementary Figure 1.
Extended Data Figure 4.
Extended Data Figure 4.. Generation of TRIM37 variants and analysis of the effect of TRIM37 loss on H2a ubiquitination and transcription.
(a) (left) Method used to generate cell lines for testing rescue with transgenes encoding wildtype and mutant variants of TRIM37. Schematic of TRIM37 shows the point mutants engineered in the ligase and TRAF domains. (right) Blot shows expression of transgene-encoded TRIM37 variants in the pools selected for marker resistance; percentage of cells expressing the indicated fusions is shown below the blot. (b) Structural homology-based strategy used to engineer the TRIM37 TRAF domain mutant. Diagram illustrates the USP7 TRAF domain (gray surface) bound to a p53 peptide (cyan stick) with key binding residues W165 and F167 in orange spheres (PDB:3MQR). Sequences below show similarity between TRIM37 and USP7 in the peptide binding pocket; the conserved tryptophan (W165 in USP7; W373 in TRIM37) was mutated to alanine to generate the TRIM37 TRAF mutant. (c) Images illustrating the effect of expressing WT TRIM37 or engineered variants disrupting ligase activity or TRAF domain interactions in TRIM37Δ cells. (d) Interaction analysis employing co-expression of TRIM37 and PLK4 followed by PLK4 immunoprecipitation. Wild-type (WT) TRIM37 is expressed at significantly lower levels than ligase-mutant (C18R) TRIM37, suggesting that TRIM37 autoregulates its own stability. The low expression of WT TRIM37 led us to use ligase-mutant TRIM37 for the interaction analysis shown in Fig. 2i. (e) (left) Immunoblot of H2A-Ub(Lys119), comparing control and TRIM37Δ RPE1 cells. α-tubulin serves as a loading control. (right) Quantification of band intensities indicates that TRIM37 does not reduce ubiquitination of Lys119 in histone H2A. (f) RNA-Seq analysis comparing parental and TRIM37Δ RPE1 cells. A previously defined set of 82 genes encoding centrosomal components is marked in red to highlight lack of change in their mRNA levels. (g) RNA-Seq analysis comparing parental CHP134 cells to two clones with significantly lower expression of TRIM37. The two clones shown are clone 1 and clone 2 in Fig. 1f. The centrosome 82-gene set is highlighted in red. (h) Lists of >2-fold downregulated or upregulated genes. Each of the 3 test lines (RPE1 TRIM37Δ, CHP134 clone 1, CHP134 clone 2) was compared to the parental line in order to identify genes with statistically significant >2-fold changes. Cross-comparison of all 3 test lines and of the 2 CHP134 clones is summarized in the Venn diagrams; gene names for shared differentially expressed genes are shown below each Venn diagram. For gel source data see Supplementary Figure 1.
Extended Data Figure 5.
Extended Data Figure 5.. Effect of TRIM37 overexpression on coalescence of pericentriolar material and acentrosomal mitosis.
(a) Schematic of protocol used to analyze the effect of centrinone treatment on CEP192 mitotic dynamics by live imaging, shown in Fig. 3a. (b) Immunofluorescence images of centrosome components in DMSO versus centrinone-treated mitotic RPE1 cells. Scale bar, 10 μm. (c) Summary of immunofluorescence analysis showing which centrosome components were detected in the foci at the poles of acentrosomal spindles in centrinone-treated cells. (d) Schematic of protocol used to inducibly knock out PLK4 and monitor CEP192 dynamics in mitosis by live imaging, shown in Fig. 3b. (e) Schematic of protocol used to overexpress TRIM37 and monitor CEP192 dynamics in mitosis by live imaging, shown in Fig. 3c. Note that this is the same cell line used for the analysis shown in Fig. 3a (no dox induction); the analysis in these two conditions was conducted in parallel. (f) Additional panels from the timelapse image sequences shown in Fig. 3b and 3c for the inducible PLK4 knockout and TRIM37 overexpression, respectively. Times in minutes after NEBD are noted on each panel. (g) RNA-Seq analysis comparing two clones overexpressing TRIM37 to parental RPE1 cells. Elevated TRIM37 transcript levels are evident in both clones. No significant changes in the global transcriptome were otherwise observed. (h) Evidence that centrosomes protect CEP192 from TRIM37-dependent degradation. (top) Immunoblots of the indicated RPE1 cell lines with and without centrinone treatment. In cells overexpressing TRIM37, centrinone treatment further reduces CEP192 levels; by contrast, in TRIM37Δ cells, centrinone treatment only modestly affected CEP192 levels. Note that RNA-Seq analysis indicated no significant change in CEP192 transcript levels between cell lines with varying levels of TRIM37. (bottom) Immunoblots of CHP134 parental cells and a derived clone with ~12% expression of TRIM37. Centrinone strongly reduced CEP192 in the parental cells but not in the clone with reduced TRIM37 expression. α-tubulin serves as a loading control in both blots. For gel source data see Supplementary Figure 1.
Extended Data Figure 6.
Extended Data Figure 6.. Evidence that CEP192 is the target of TRIM37 that accounts for enhanced sensitivity to PLK4 inhibition
(a) Schematic for partial CEP192 inhibition using a short-term inducible knockout, followed by live imaging of mitosis. (b) Evidence in CHP134 cells that CEP192 is a functionally significant target of TRIM37. A CHP134 clonal cell line with reduced TRIM37 expression (~12% relative to parental CHP134 cells) was stably transduced with a CEP192 shRNA that reduced expression by ~75% (immunoblot and quantification below). Live imaging of mitosis showed that while reduction of CEP192 levels had no significant effect on the duration of mitosis in DMSO-treated cells, it significantly extended mitotic duration in centrinone-treated cells. (c) Evidence that the C-terminus of CEP192 is ubiquitinated in a TRIM37-dependent manner. The experiment shown in Fig. 4d included co-transfection of HA-tagged ubiquitin. Shown here is the HA-ubiquitin blot (together with FLAG and Myc blots) of the immunoprecipitated C-terminal fragment that binds TRIM37. Ubiquitination of this fragment was enhanced in the presence of WT relative to ligase-mutant TRIM37. The FLAG blot shown is the same as in Fig. 4d; the Myc blot is a different exposure of the blot shown in Fig. 4d. The other CEP192 fragments are not shown because their stability was affected by co-expression with WT but not ligase-mutant TRIM37, which makes comparisons of ubiquitination profiles difficult. For gel source data see Supplementary Figure 1.
Extended Data Figure 7.
Extended Data Figure 7.. Inducible PLK4 shRNA-based CHP134 xenograft tumor analysis.
(a) (left) Schematic illustrating the generation and characterization of a CHP134 pool with stably integrated inducible PLK4 (iPLK4) shRNA. Following viral transduction, 3 day-induction of the shRNA with doxycycline, immunoblotting and immunofluorescence was used to assess PLK4 depletion and centrosome loss. (right) Immunoblot shows depletion of PLK4 as well as reduction of CEP192, as is also observed with centrinone; this reduction was dependent on high TRIM37 expression in CHP134 cells, as it was not observed following induction of PLK4 shRNA in a CHP134-derived line with ~10% TRIM37 expression (not shown). (b) Immunofluorescence images showing loss of centrosomes, detected using CEP192, following induction of PLK4 shRNA. Scale bar, 10 μm. (c) Quantification of centrosome number after 3-day induction of PLK4 shRNA. Longer induction was associated with extensive lethality, as is also observed with centrinone treatment of CHP134 cells. (d) (left) Schematic of isolation of CHP134 clones with stably integrated iPLK4 shRNA from the pool described in (a-c). (right) Results of passaging-based analysis showing that both clones exhibited rapid cessation of proliferation following induction of the shRNA. (e) Schematic of the workflow for tumor xenograft analysis with the two CHP134 iPLK4-shRNA clones. Tumors were generated in female BALB/c nude mice, and the shRNA was induced by switching to a doxycycline-containing diet. Tumor volume and body weight were measured over time after induction. (f) Time course of tumor growth in BALB/c nude mice for the two CHP134 PLK4 shRNA clonal lines following induction of shRNA (Doxycyline) versus no induction (Control). Error bars are SEM. Statistical significance was evaluated using unpaired t-tests. For gel source data see Supplementary Figure 1.
Figure 1.
Figure 1.. TRIM37 levels determine mitotic outcomes and cancer-specific sensitivity to PLK4 inhibition.
(a) Still images from timelapse sequences showing chromosomes in RPE1 cells with normal (1X), no (0X, TRIM37Δ) or 4-fold increased (4X) TRIM37 protein levels after treatment with DMSO or centrinone. Scale bar, 10 μm. Rates of chromosome segregation failure for the same conditions are also indicated. (b) Immunoblot shows TRIM37 in the 3 analyzed lines; α-tubulin serves as a loading control. (c) Schematic of the chromosome 17q region containing TRIM37 that is amplified in specific cancer contexts. (d) Graph shows TRIM37 protein level, measured by semi-quantitative immunoblotting, for the indicated breast cancer and neuroblastoma cell lines. (e) Passaging-based proliferation analysis for the indicated cell lines treated with DMSO (grey) or centrinone (red). (f) (left) Immunoblot of CHP134 clones in which CRISPR/Cas9-based inactivation of 1 or more of the 4 TRIM37 gene copies was used to vary TRIM37 protein levels. α-tubulin serves as a loading control. (right) Graphs plot mitotic duration, chromosome segregation failure frequency, and proliferation in centrinone as a function of TRIM37 protein level in the engineered CHP134 cell lines. Error bars in mitotic duration are 95% CI. For gel source data see Supplementary Figure 1.
Figure 2.
Figure 2.. TRIM37 prevents the formation of PLK4 condensate-based ectopic microtubule-organizing centers.
(a) Immunofluorescence images localizing PLK4 in interphase RPE1 cells. PLK4 localizes to centrioles (cyan arrowheads) and to a single ectopic condensate (yellow arrows) in TRIM37Δ cells. (b) Immunoblot showing PLK4 protein levels are not altered in TRIM37Δ cells. (c) Immunofluorescence images of TRIM37Δ cells that lack centrioles due to treatment with centrinone showing centrosome components in an array of small condensates. (d) Schematic highlighting differences between the single large condensate in TRIM37Δ cells with centrioles (top) and the small condensates in cells that lack centrioles due to treatment with centrinone (bottom). (e) Images of centrinone-treated TRIM37Δ cells with in situ mNG-tagged CEP192 and transgene-expressed red fluorescent microtubule-binding domain. Times are minutes after NEBD. (f) Control or TRIM37Δ RPE1 cells with in situ-tagged CEP192 treated with centrinone to inhibit PLK4 activity (top) or after inducibly knocking out PLK4 (bottom). Immunofluorescence (left) and plots of relative proliferation (right) show that foci formation and improved proliferation of centrinone-treated TRIM37Δ cells require PLK4 protein. Error bars are SD (n=3). (g) Mitotic duration analysis of the conditions in (f). Error bars are 95% CI. (h) (left) Images showing localization to the centrosome of FLAG-tagged WT TRIM37 expressed in TRIM37Δ RPE1 cells. (middle) schematic summarizing the ligase and TRAF domain TRIM37 mutations. (right) Graph plotting percent of cells with condensates after expression in TRIM37Δ cells of FLAG-tagged WT or mutant TRIM37 proteins. (i) Interaction analysis of TRIM37 variants with PLK4 following co-expression and PLK4 immunoprecipitation. Low expression of wild-type TRIM37 prompted use of ligase-mutant TRIM37 in this analysis. (j) TRIM37 ligase activity-dependent ubiquitination of PLK4, observed following co-expression. α-tubulin serves as a loading control for the input in (i) and (j). Scale bars are 10 μm. For gel source data see Supplementary Figure 1.
Figure 3.
Figure 3.. Acentrosomal spindle assembly and pericentriolar material coalescence is suppressed by elevated TRIM37 in PLK4-inhibited cells.
(a) Images of mitosis in DMSO or centrinone-treated RPE1 cells expressing in situ mNG-tagged CEP192. Acentrosomal spindle assembly in centrinone-treated cells is accompanied by CEP192 coalescence into foci at the spindle poles. Times are minutes after NEBD. (b) Images of mitosis in control and PLK4 knockout cells expressing in situ mNG-tagged CEP192, showing that formation of foci at the spindle poles does not require PLK4 protein. Times are minutes after NEBD. (c) Images of mitosis in TRIM37-overexpressing cells with in situ mNG-tagged CEP192 following treatment with DMSO or centrinone. Elevated TRIM37 expression suppresses coalescence of pericentriolar material components and frequently results in cells exiting mitosis without segregating their chromosomes. Times are minutes after NEBD. (d) Frequency of CEP192 coalescence to form mitotic foci for the indicated conditions. (e) Images of centrinone-treated mitotic CHP134 neuroblastoma parental cells or a clone with reduced TRIM37 expression (Fig. 1f). Acentrosomal foci are only at spindle poles following TRIM37 reduction in this TRIM37-amplified cell line. C: centrosome. (f) Ligase activity is required for elevated TRIM37 to increase sensitivity to PLK4 inhibition. (left) WT or ligase-inactive TRIM37 were expressed in TRIM37Δ RPE1 cells and clonal lines isolated; WT TRIM37 was expressed at a level comparable to endogenous TRIM37 (not shown); ligase-inactive TRIM37 was expressed at a ~4-fold higher level. (right) 4-fold overexpression of ligase-inactive TRIM37 suppresses, rather than enhances, mitotic defects in centrinone. (g) Effect of elevated TRIM37 expression on the indicated centrosomal components. CEP192 levels declined significantly whereas other tested components were not significantly affected. Asterisk marks a background band. α-tubulin serves as a loading control in (f) and (g). Scale bars are 10 μm. For gel source data see Supplementary Figure 1.
Figure 4.
Figure 4.. Elevated TRIM37 leads to a reduction in CEP192 that confers enhanced sensitivity to PLK4 inhibition.
(a) (top) Approach for partial CEP192 inhibition using a short-term inducible knockout. (bottom) Graphs plot mitotic duration and percent segregation failure. Short-term inducible CEP192 knockout does not affect mitosis in DMSO-treated cells but significantly enhances mitotic defects in centrinone-treated cells. (b) Co-expression with WT or ligase-inactive TRIM37 shows that CEP192, but not CEP152, protein levels are controlled by TRIM37 ligase activity. α-tubulin serves as a loading control. (c) Interaction analysis showing that co-expressed ligase-inactive TRIM37 associates with CEP192. α-tubulin serves as an input loading control. (d) Schematic highlights key interaction sites in CEP192. Input blot shows effects of co-expressed TRIM37 (wildtype or ligase-inactive) on stability of CEP192 fragments; immunoprecipitation blot assesses association with ligase-mutant TRIM37. α-tubulin serves as an input loading control. Note that when CEP192 is unable to interact with TRIM37 due to deletion of its C- terminus (1–2071), levels are not affected by TRIM37 WT co-expression. (e) Model depicting how TRIM37 exerts bi-directional control over acentrosomal mitosis following PLK4 inhibition. (i) Two ligase activity-dependent functions of TRIM37 are to prevent PLK4 self-assembly into condensates that nucleate microtubules and to target CEP192 for degradation. (ii) When TRIM37 levels are low, PLK4 forms condensates that catalyze robust acentrosomal spindle assembly. When TRIM37 levels are normal, TRIM37 prevents PLK4 from forming condensates; after mitotic entry, foci containing pericentriolar material components coalesce concomitant with slow acentrosomal spindle assembly. When TRIM37 levels are high, CEP192 levels are reduced and there are no PLK4 condensates—consequently, acentrosomal spindle assembly fails. Amplification of the genomic region containing TRIM37 in neuroblastoma and a subset of breast cancers highlights the potential for synthetic lethality with PLK4 inhibition in specific cancer contexts. For gel source data see Supplementary Figure 1.

Comment in

  • Selectively triggering mitotic failure.
    Crunkhorn S. Crunkhorn S. Nat Rev Drug Discov. 2020 Nov;19(11):755. doi: 10.1038/d41573-020-00165-2. Nat Rev Drug Discov. 2020. PMID: 32943764 No abstract available.

Similar articles

Cited by

References

    1. Petry S Mechanisms of Mitotic Spindle Assembly. Annu Rev Biochem 85, 659–683, doi:10.1146/annurev-biochem-060815-014528 (2016). - DOI - PMC - PubMed
    1. Nigg EA & Holland AJ Once and only once: mechanisms of centriole duplication and their deregulation in disease. Nat Rev Mol Cell Biol 19, 297–312, doi:10.1038/nrm.2017.127 (2018). - DOI - PMC - PubMed
    1. Zitouni S, Nabais C, Jana SC, Guerrero A & Bettencourt-Dias M Polo-like kinases: structural variations lead to multiple functions. Nat Rev Mol Cell Biol 15, 433–452, doi:10.1038/nrm3819 (2014). - DOI - PubMed
    1. Wong YL et al. Cell biology. Reversible centriole depletion with an inhibitor of Polo-like kinase 4. Science 348, 1155–1160, doi:10.1126/science.aaa5111 (2015). - DOI - PMC - PubMed
    1. Bulavin DV et al. Amplification of PPM1D in human tumors abrogates p53 tumor-suppressor activity. Nat Genet 31, 210–215, doi:10.1038/ng894 (2002). - DOI - PubMed

Publication types

MeSH terms