. 2020 Sep;585(7825):447-452.
doi: 10.1038/s41586-020-2690-1. Epub 2020 Sep 9.

Targeting TRIM37-driven centrosome dysfunction in 17q23-amplified breast cancer

Affiliations

Targeting TRIM37-driven centrosome dysfunction in 17q23-amplified breast cancer

Zhong Y Yeow et al. Nature. 2020 Sep.

Abstract

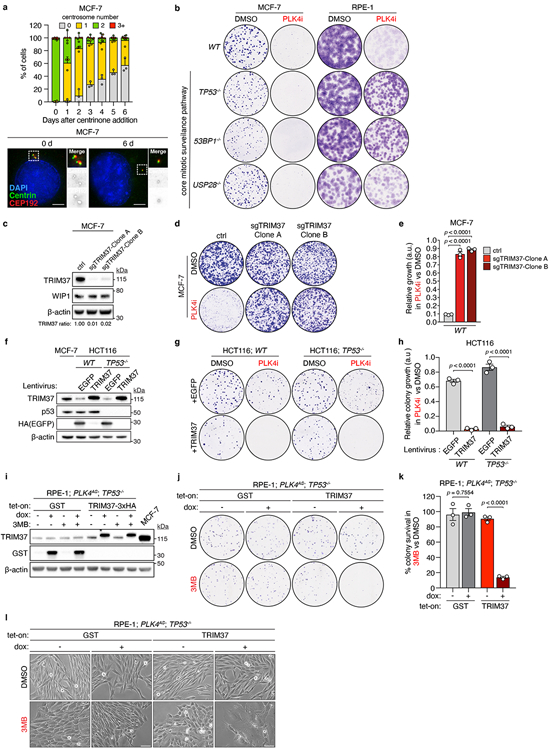
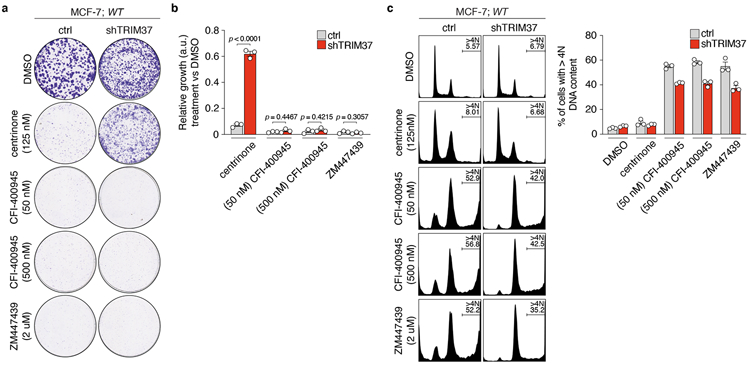
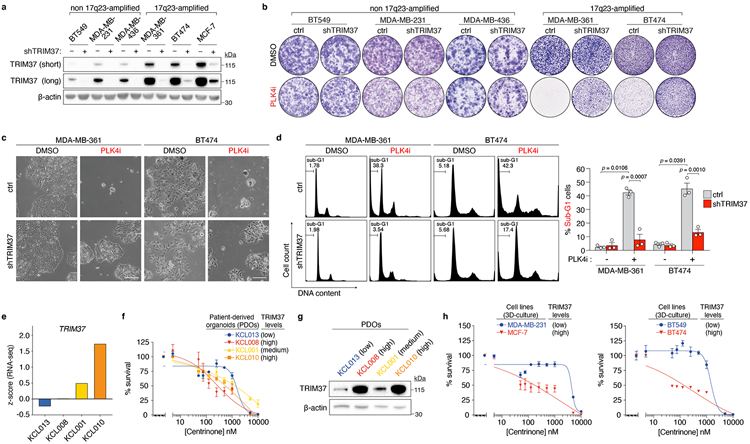
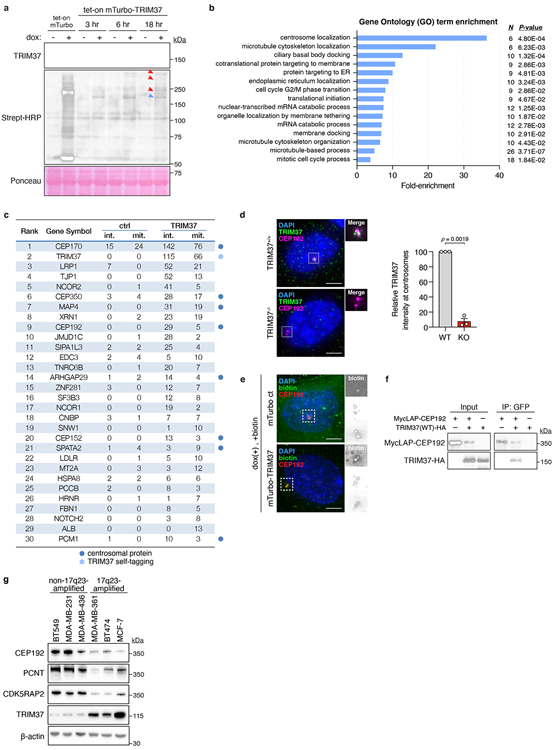
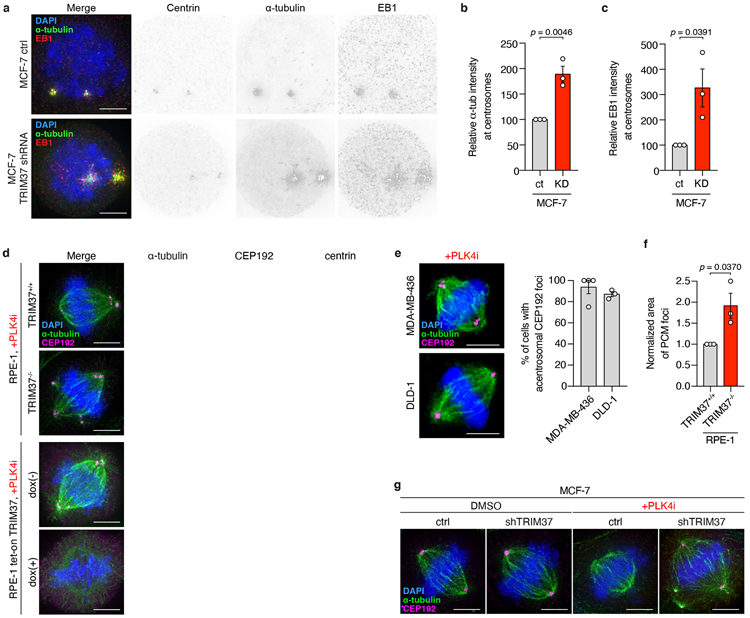
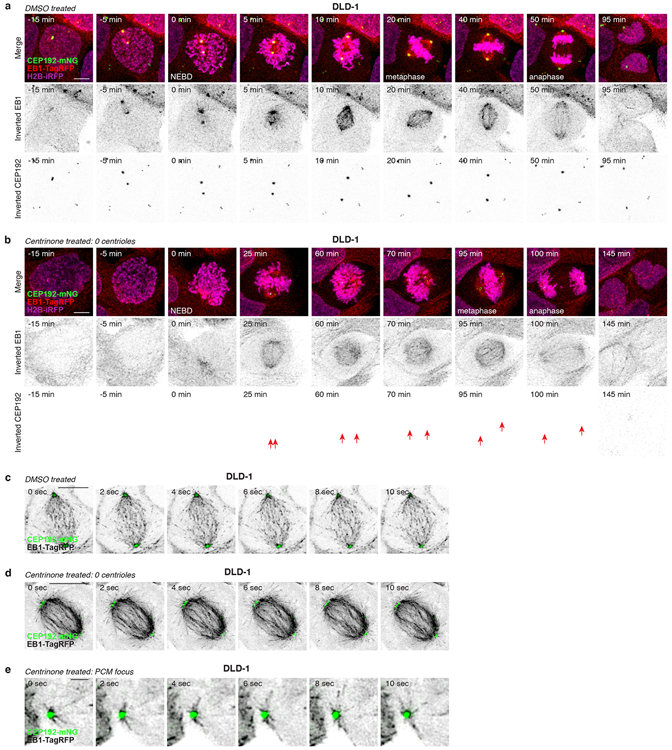
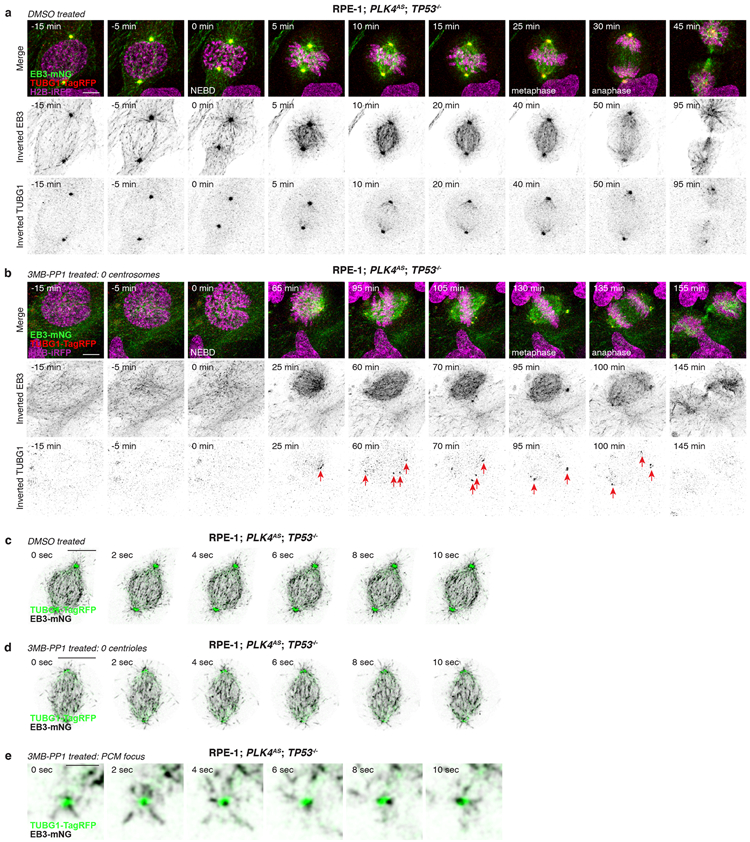
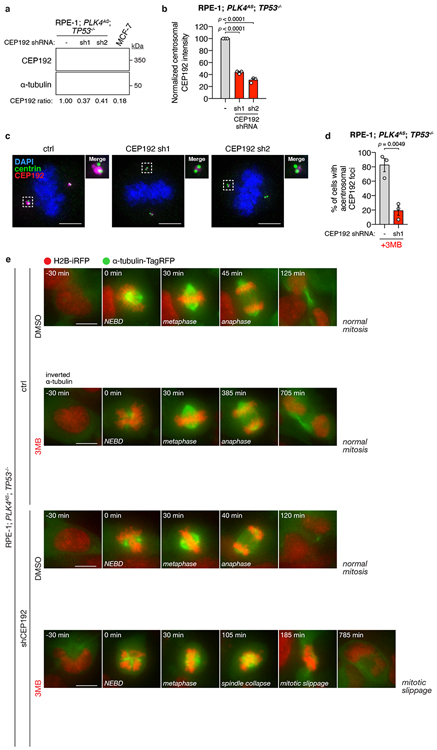
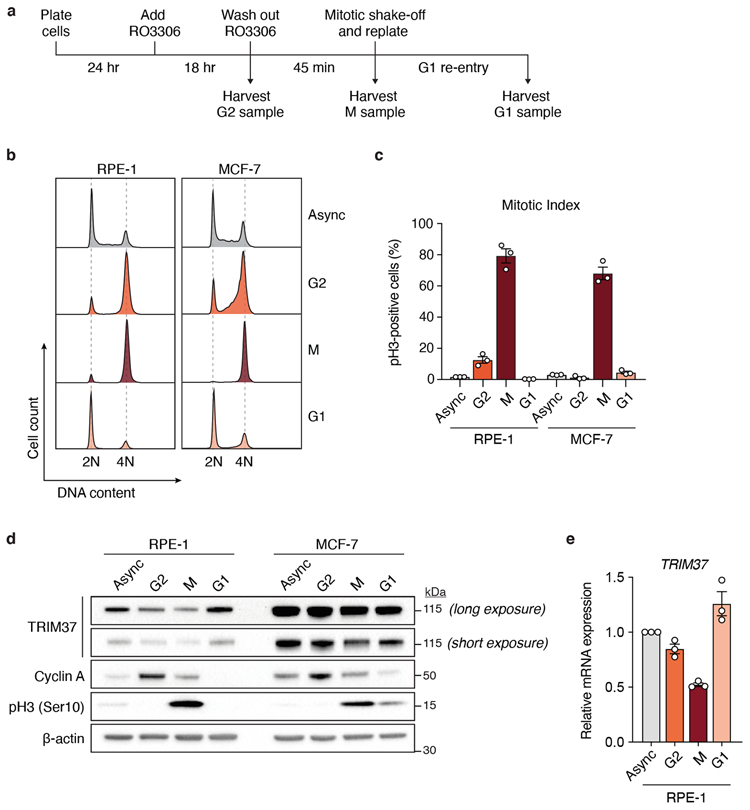
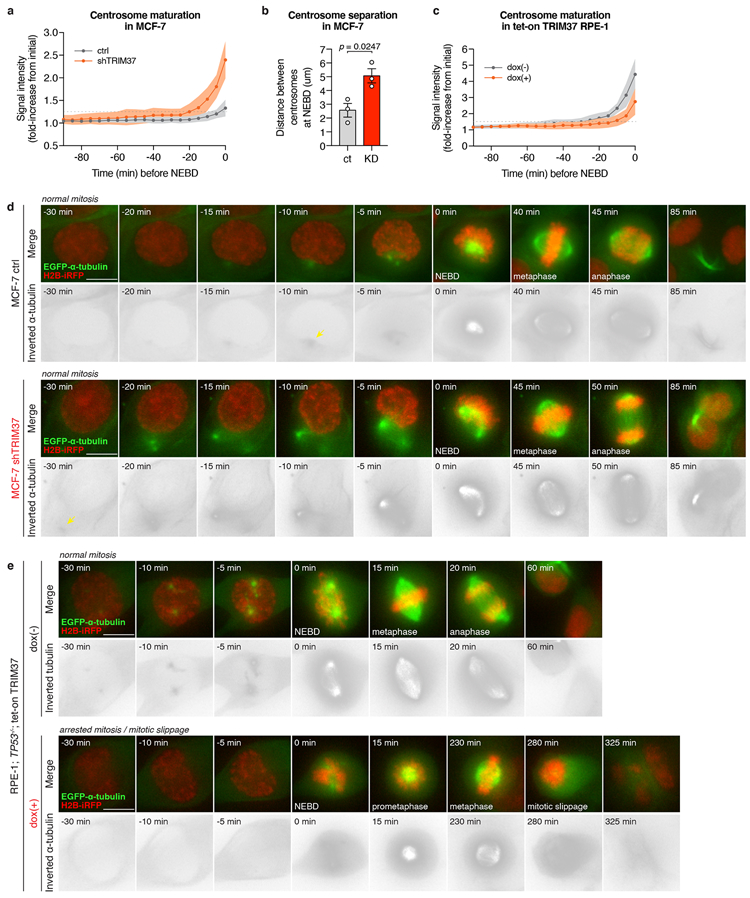
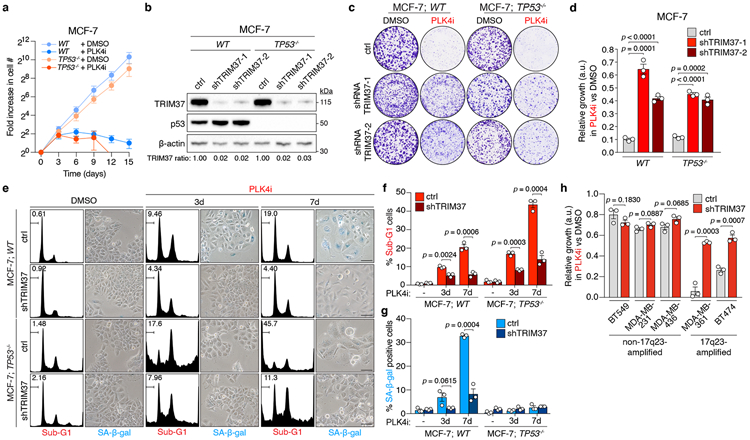
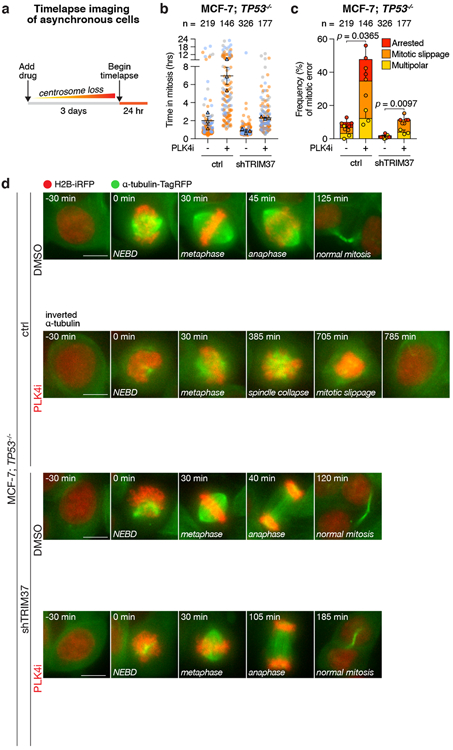
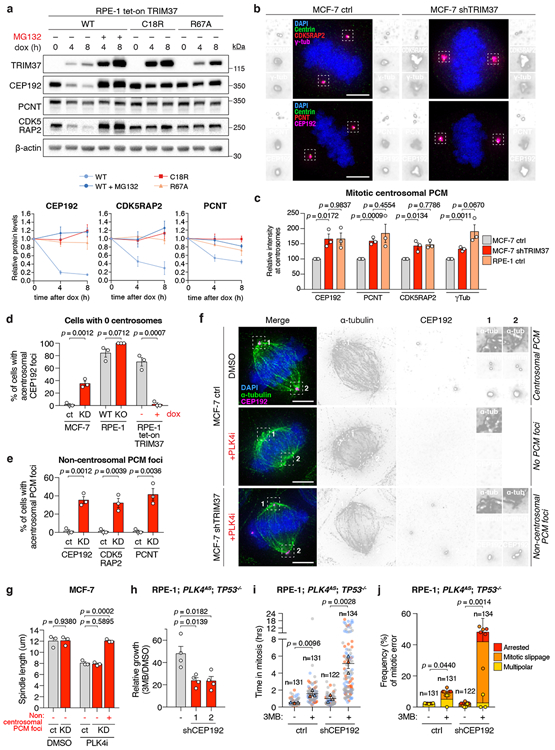
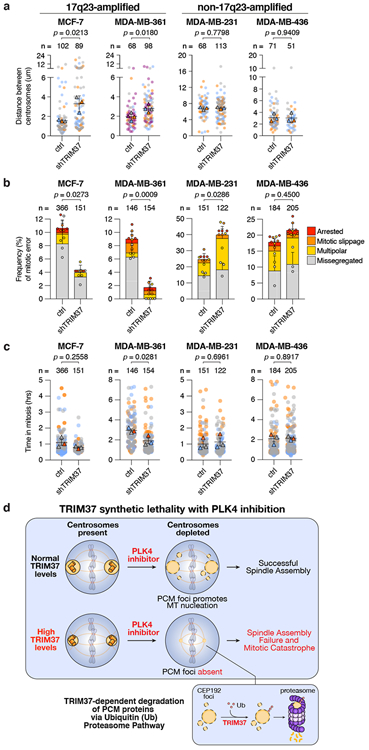
Genomic instability is a hallmark of cancer, and has a central role in the initiation and development of breast cancer1,2. The success of poly-ADP ribose polymerase inhibitors in the treatment of breast cancers that are deficient in homologous recombination exemplifies the utility of synthetically lethal genetic interactions in the treatment of breast cancers that are driven by genomic instability3. Given that defects in homologous recombination are present in only a subset of breast cancers, there is a need to identify additional driver mechanisms for genomic instability and targeted strategies to exploit these defects in the treatment of cancer. Here we show that centrosome depletion induces synthetic lethality in cancer cells that contain the 17q23 amplicon, a recurrent copy number aberration that defines about 9% of all primary breast cancer tumours and is associated with high levels of genomic instability4-6. Specifically, inhibition of polo-like kinase 4 (PLK4) using small molecules leads to centrosome depletion, which triggers mitotic catastrophe in cells that exhibit amplicon-directed overexpression of TRIM37. To explain this effect, we identify TRIM37 as a negative regulator of centrosomal pericentriolar material. In 17q23-amplified cells that lack centrosomes, increased levels of TRIM37 block the formation of foci that comprise pericentriolar material-these foci are structures with a microtubule-nucleating capacity that are required for successful cell division in the absence of centrosomes. Finally, we find that the overexpression of TRIM37 causes genomic instability by delaying centrosome maturation and separation at mitotic entry, and thereby increases the frequency of mitotic errors. Collectively, these findings highlight TRIM37-dependent genomic instability as a putative driver event in 17q23-amplified breast cancer and provide a rationale for the use of centrosome-targeting therapeutic agents in treating these cancers.


Figures

Extended Data Figure 1 (related to Figure 1).
Extended Data Figure 1 (related to Figure 1).. TRIM37 overexpression in HCT116 and RPE-1 cells recapitulates synthetic lethality with centrosome loss.
(A) Top, centrosome number distribution in interphase MCF-7 cells at various times after addition of 125 nM centrinone. Mean ± s.e.m. Bottom, representative images of centrosome staining (centrioles labelled by Centrin, and PCM labelled by CEP192). Data, n = 3, biological replicates, each comprising >100 cells. (B) Representative data of a 14 day clonogenic survival assay of MCF-7 and RPE-1 cells with the indicated genotypes treated with DMSO (control) or 125 nM centrinone (PLK4i). n = 3, biological replicates. (C) Immunoblot showing TRIM37 protein levels in two WT MCF-7 clones stably expressing control or a TRIM37-targeting sgRNA. β-Actin, loading control. Representative data; n = 3, biological replicates. For gel source data, see Supplementary Figure 1. (D) Representative data of a 10 day clonogenic survival of indicated MCF-7 cell lines treated with DMSO (control) or 125 nM centrinone (PLK4i). (E) Quantification of n = 3, biological replicates in (D). P values, unpaired two-tailed t-test. Mean ± s.e.m. (F) Immunoblot of lysates prepared from WT and TP53−/− HCT116 cells expressing a control (EGFP) or TRIM37 transgene. MCF-7 cells were used as a reference for TRIM37 protein overexpression in a 17q23-amplified cell line. β-Actin, loading control. Representative data; n = 3, biological replicates. For gel source data, see Supplementary Figure 1. (G) Representative data of a 14 day clonogenic survival assay of HCT116 cells treated with DMSO (control) or 125 nM centrinone (PLK4i). (H) Quantification of n = 3, biological replicates in (G). P values, unpaired two-tailed t-test. Mean ± s.e.m. (I) Immunoblot showing doxycycline-induced GST or TRIM37 expression in RPE-1; PLK4AS; TP53−/− cells. β-Actin, loading control. Representative data; n = 3, biological replicates. For gel source data, see Supplementary Figure 1. (J) Representative data of a 14 day colony survival assay of RPE-1; PLK4AS; TP53−/− cells expressing doxycycline-inducible GST (control) or TRIM37 transgenes, treated with DMSO (control) or 3MB-PP1. AS, analogue sensitive. (K) Quantification of n = 3, biological replicates in (J). P values, unpaired two-tailed t-test. Mean ± s.e.m. (L) Representative images of RPE-1; PLK4AS; TP53−/− cells in (J). Scale bars, 100 μm.
Extended Data Figure 2.
Extended Data Figure 2.. Inhibitor selectivity for PLK4, and not other kinases, is required for the synthetic lethal killing of cells overexpressing TRIM37.
(A) Representative data of a 10 day clonogenic survival of indicated MCF-7 cell lines treated with DMSO (control), centrinone, CFI-400945 or ZM447439. (B) Quantification of (A), n = 3, biological replicates. P values, unpaired two-tailed t-test. Mean ± s.e.m. (C) Left, representative flow cytometric analysis of DNA content in MCF-7 cells treated with DMSO (control), centrinone, CFI-400945 or ZM447439 for 3 days. Right, quantification of the percentage of cells with >4N DNA content (polyploidy). n = 3, biological replicates. Mean ± s.e.m.
Extended Data Figure 3 (related to Figure 1).
Extended Data Figure 3 (related to Figure 1).. Additional characterization of TRIM37 expression and synthetic lethality in breast cancer cell lines and patient-derived organoids (PDOs).
(A) Immunoblot showing TRIM37 protein levels in the indicated 17q23-amplified cell lines (MDA-MB-361, BT474, MCF-7) and non-17q23-amplified cell lines (BT549, MDA-MB-231, MDA-MB-436) expressing control, or TRIM37-targeting, shRNA. β-Actin, loading control. Representative data; n = 3, biological replicates. For gel source data, see Supplementary Figure 1. (B) Clonogenic survival of 17q23-amplified and non-17q23-amplified cell lines treated with DMSO (control) or 125 nM centrinone (PLK4i). Representative data; n = 3, biological replicates. (C) Images of DMSO or PLK4i-treated MDA-MB-361 and BT474 cells expressing control, or TRIM37-targeting, shRNA. Scale bars, 200 μm. Representative data; n = 3, biological replicates. (D) Left, Representative flow cytometric DNA content analysis in DMSO or PLK4i-treated MDA-MB-361 and BT474 cells. Percentages of sub-G1 events are indicated. Right, percentage of sub-G1 cells across n = 3, biological replicates. P values, unpaired two-tailed t-test. Mean ± s.e.m. (E) TRIM37 gene expression in PDOs. Gene expression is reported as a z-score derived from RNA-Seq datasets across n = 22, independent biological samples. (F) Viability of patient-derived breast tumour organoids following a 14 day exposure to the indicated concentrations of centrinone. Data from n = 2 biological replicates are shown. Mean ± s.e.m. (G) Immunoblot showing TRIM37 protein levels in PDOs. β-Actin, loading control. Data from n = 1, biological replicate. For gel source data, see Supplementary Figure 1. (H) Viability of 3D-cultures of the indicated cell lines following a 14 day exposure to the indicated concentrations of centrinone. Left panel, n = 2, biological replicates, Mean ± s.e.m. Right panel, n = 4, technical replicates, Mean ± s.e.m.
Extended Data Figure 4 (related to Figure 3).
Extended Data Figure 4 (related to Figure 3).. TRIM37 localises to centrosomes, where it interacts with, and regulates the abundance of PCM proteins.
(A) Immunoblot showing TRIM37 and biotinylated proximity interactors. Ponceau-stained blot indicates loading. Data is from a single experiment performed in duplicate. For gel source data, see Supplementary Figure 1. (B) Gene ontology analysis of mass spectrometry data. (C) Thresholded mass spectrometry results displaying the top 30 proximity interactors by spectral count. Interactors were filtered to isolate those with >2x more peptides in the mTurbo-TRIM37 sample compared to control. (D) Left, immunofluorescence of TRIM37 in TRIM37+/+ and TRIM37−/− RPE-1 cells. Scale bars, 5 μm. Right, quantification of TRIM37 intensity at the centrosome in RPE-1 cells. n = 3, biological replicates, each comprising >40 cells. P values, unpaired two-tailed t-test. Mean ± s.e.m. (E) Immunofluorescence of biotin-labelled proteins in mTurbo cell lines. Representative data; n = 3. Scale bars, 5 μm. (F) Co-immunoprecipitation showing the interaction of TRIM37 with CEP192. Representative data; n = 3, biological replicates. For gel source data, see Supplementary Figure 1. (G) Immunoblot showing the levels of TRIM37 and PCM components in non-17q23-amplified versus 17q23-amplified cell lines. β-Actin, loading control. Representative data; n = 3, biological replicates. For gel source data, see Supplementary Figure 1.
Extended Data Figure 5 (related to Figure 3).
Extended Data Figure 5 (related to Figure 3).. TRIM37 suppresses microtubule nucleation by the centrosome and supresses the formation of non-centrosomal PCM foci.
(A) Microtubule regrowth following nocodazole washout in control and TRIM37-shRNA expressing MCF-7 mitotic cells. Representative images from (B). n = 3, biological replicates. Scale bars, 5 μm. (B) Quantification of microtubule regrowth following nocodazole washout in control and TRIM37-shRNA expressing MCF-7 mitotic cells. n = 3, biological replicates, each with >25 cells. P values, unpaired two-tailed t-test. Mean ± s.e.m. (C) Quantification of centrosomal EB1 intensity following nocodazole washout in control and TRIM37-shRNA expressing MCF-7 mitotic cells. n = 3, biological replicates, each with >25 cells. P values, unpaired two-tailed t-test. Mean ± s.e.m. (D) Representative images of mitotic PCM foci in acentrosomal RPE-1 cells described in Figure 3d. n = 3, biological replicates. Scale bars, 5 μm. (E) Left, representative images of mitotic PCM foci in acentrosomal MDA-MB-436 and DLD-1 cells. Scale bars, 5 μm. Right, Quantification of mitotic PCM foci in centrinone-treated MDA-MB-436 and DLD-1 cells that lacked centrosomes. n = >3, biological replicates, each comprising ≥84 cells for DLD-1 cells and ≥ 6 cells for MDA-MB-436 cells. Mean ± s.e.m. (F) Quantification of CEP192 foci area in RPE-1 TRIM37+/+ vs TRIM37−/− cells in (D). n = 3, biological replicates, each comprising >20 cells. P values, unpaired two-tailed t-test. Mean ± s.e.m. (G) Representative images for spindle length analysis in indicated MCF-7 cells described in Figure 3g. n = 3, biological replicates. Scale bars, 5 μm.
Extended Data Figure 6 (related to Figure 3).
Extended Data Figure 6 (related to Figure 3).. Non-centrosomal PCM foci nucleate microtubules and contribute to spindle assembly in DLD-1 cells.
(A) Representative time-lapse images of mitosis in control DLD-1 cells. n = 3, biological replicates. Scale bar, 5 μm. (B) Representative time-lapse images of PCM foci formation during mitosis in acentrosomal DLD-1 cells. Scale bar, 5 μm. n = 3, biological replicates. Arrows indicate PCM foci. (C) Representative time-lapse images of microtubule nucleation from centrosomes in the mitotic spindle of control DLD-1 cells. n = 3, biological replicates. Scale bar, 5 μm. (D) Representative time-lapse images of microtubule nucleation from PCM foci incorporated into the mitotic spindle of acentrosomal DLD-1 cells. n = 3, biological replicates. Scale bar, 5 μm. (E) Representative time-lapse images of microtubule nucleation from a PCM focus prior to its incorporation into the mitotic spindle of the acentrosomal cell shown in (D). n = 3, biological replicates. Scale bar, 1 μm.
Extended Data Figure 7 (related to Figure 3).
Extended Data Figure 7 (related to Figure 3).. Non-centrosomal PCM foci nucleate microtubules and contribute to spindle assembly in RPE-1 cells.
(A) Representative time-lapse images of mitosis in control RPE-1; PLK4AS; TP53−/− cells. n = 3, biological replicates. Scale bar, 5 μm. (B) Representative time-lapse images of PCM foci formation during mitosis in acentrosomal RPE-1; PLK4AS; TP53−/− cells. n = 3, biological replicates. Scale bar, 5 μm. Arrows indicate PCM foci. (C) Representative time-lapse images of microtubule nucleation from centrosomes in the mitotic spindle of control RPE-1; PLK4AS; TP53−/− cells. n = 3, biological replicates. Scale bars, 5 μm. (D) Representative time-lapse images of microtubule nucleation from PCM foci incorporated into the mitotic spindle of acentrosomal RPE-1; PLK4AS; TP53−/− cells. n = 3, biological replicates. Scale bar, 5 μm. (E) Representative time-lapse images of microtubule nucleation from a PCM focus prior to its incorporation into the mitotic spindle in acentrosomal RPE-1; PLK4AS; TP53-/−. n = 3, biological replicates. Scale bar, 1 μm.
Extended Data Figure 8 (related to Figure 3).
Extended Data Figure 8 (related to Figure 3).. Depletion of CEP192 in RPE-1 cells recapitulates the synthetic lethal mitotic phenotypes observed in high-TRIM37 expressing cells.
(A) Immunoblot showing the CEP192 levels in indicated control and CEP192-depleted RPE-1; PLK4AS; TP53−/− cells. α-tubulin, loading control. For gel source data, see Supplementary Figure 1. (B) Quantification of mitotic centrosomal CEP192 signal in the same cells as described in (A). n = 3, biological replicates, each comprising >30 cells. P values, unpaired two-tailed t-test. Mean ± s.e.m. (C) Representative images of centrosomal CEP192 in the same cells as described in (A). Scale bars, 5 μm. (D) Quantification of the percentage of 3MB-PP1 treated RPE-1; PLK4AS; TP53−/− cells with acentrosomal mitotic CEP192 PCM foci. n = 3, biological replicates, each comprising >30 cells. P values, unpaired two-tailed t-test. Mean ± s.e.m. (E) Representative time-lapse images of mitotic progression in DMSO or 3MB-treated control and CEP192-depleted RPE-1; PLK4AS; TP53−/− cells. Cells are labelled with H2B-iRFP and tagRFP-tubulin. n = 3, biological replicates.
Extended Data Figure 9 (related to Figure 4).
Extended Data Figure 9 (related to Figure 4).. Cell cycle regulation of TRIM37 expression.
(A) Schematic of the experimental protocol used for cell cycle synchronisation. Samples were subjected to dual flow cytometry staining of phospho-Histone Ser10 (pH3) to mark mitotic cells and propidium iodide (PI) to determine synchronisation efficiency. M, mitotic phase. (B) Flow cytometric DNA content analysis of samples harvested according to (A). Left, RPE-1; Right, MCF-7. Async, asynchronous. (C) Mitotic index of cell cycle samples as determined by the percentage of pH3-positive cells with 4N DNA content. n = 3, biological replicates. Mean ± s.e.m. (D) Immunoblot showing endogenous TRIM37, cyclin A and pH3 in samples analysed in (B). β-actin, loading control. For gel source data, see Supplementary Figure 1. (E) RT-qPCR analysis indicating relative TRIM37 mRNA expression in RPE-1 cells analysed in (B). Data was normalised to TRIM37 mRNA expression in asynchronous cells. n = 3, biological replicates. Mean ± s.e.m.
Extended Data Figure 10 (related to Figure 4).
Extended Data Figure 10 (related to Figure 4).. TRIM37 overexpression delays centrosome maturation in G2/M phase
(A) Quantification of centrosomal α-tubulin intensity from time-lapse movies of dividing MCF-7 cells expressing either control or TRIM37-targeting shRNA. Quantitation of >20 cells. Mean ± s.e.m. (B) Quantification of the distance between the two centrosomes at NEBD in MCF-7 cells. n = 3, biological replicates, each comprising >12 cells. P values, unpaired two-tailed t-test. Mean ± s.e.m. (C) Quantification of centrosomal α-tubulin intensity from time-lapse movies of dividing RPE-1 tet-on TRIM37 cells. Quantitation of >20 cells. Mean ± s.e.m. (D) Representative time-lapse images of centrosome maturation in MCF-7 cells. n = 3, biological replicates. Scale bars, 5 μm. (E) Representative time-lapse images of centrosome maturation in RPE-1 tet-on TRIM37 cells. n = 3, biological replicates. Scale bars, 5 μm.
Figure 1.
Figure 1.. PLK4 inhibition is synthetic lethal with TRIM37 amplification
(A) Fold increase in cell number after centrinone (125 nM) addition. n = 3, biological replicates. Mean ± s.e.m. (B) Immunoblot showing TRIM37 protein levels in WT and TP53−/− MCF-7 cells stably expressing a control or one of two independent TRIM37-targeting shRNAs. β-Actin, loading control. Representative data; n = 3, biological replicates. For gel source data, see Supplementary Figure 1. (C) Representative data of a 10 day clonogenic survival of indicated MCF-7 cell lines treated with DMSO (control) or centrinone (PLK4i, 125 nM). (D) Quantification of (C), n = 3, biological replicates. P values, unpaired two-tailed t-test. Mean ± s.e.m. (E) MCF-7 cells treated with DMSO (control) or centrinone (PLK4i, 125 nM) were analysed for DNA content, and stained for senescence-associated β-galactosidase expression. Representative data of n = 3, biological replicates. Scale bars, 100 μm. (F) Percentage of sub-G1 cells from (E). n = 3, biological replicates. P values, unpaired two-tailed t-test. Mean ± s.e.m. (G) Quantification of the percentage of SA-β-gal positive cells from (E). n = 3, biological replicates, each comprising ≥ 200 cells. P values, unpaired two-tailed t-test. Mean ± s.e.m. biological replicates. P values, paired two-tailed t-test. Mean ± s.e.m. AS, analogue sensitive. (H) Quantification of clonogenic survival data for 17q23-amplified and non-17q23-amplified breast cancer cells transduced with a TRIM37-shRNA or vector control and treated with DMSO (control) or centrinone (PLK4i, 125 nM). n = 3 biological replicates. P values, unpaired two-tailed t-test. Mean ± s.e.m.
Figure 2.
Figure 2.. PLK4 inhibition triggers mitotic catastrophe in TRIM37 amplified cancer cells
(A) Experimental schematic. (B) Quantification of mitotic duration in control TP53−/− MCF-7 cells compared to those expressing a TRIM37-shRNA. Cells were treated with DMSO (control) or centrinone (PLK4i, 125 nM) for 3 days prior to imaging. Triangles represent the mean for each biological replicate; coloured circles show individual data points from each of the replicates. Data acquired across n = 3, biological replicates, each with >40 cells. Mean ± s.e.m. (C) Quantification of mitotic phenotypes from (B) in control TP53−/− MCF-7 cells compared to those expressing a TRIM37-shRNA. Data acquired across n = 3, biological replicates, each with >40 cells. P values, unpaired two-tailed t-test. Mean ± s.e.m. (D) Representative time-lapse images of mitotic progression in DMSO or centrinone (125 nM)-treated TP53−/− MCF-7 cells expressing vector control or TRIM37-shRNA. Representative data; n = 3, biological replicates. Cells are labelled with H2B-iRFP and TagRFP-α-tubulin. Scale bars, 5 μm.
Figure 3.
Figure 3.. PCM sequestration by TRIM37 drives mitotic catastrophe in acentrosomal cells
(A) Top, immunoblot showing PCM levels following overexpression of wild-type TRIM37(WT), RING domain mutant TRIM37(C18R), or ubiquitin-transfer defective mutant TRIM37(R67A). For gel source data, see Supplementary Figure 1. Bottom, normalised PCM levels relative to 0 h, representative of n = 3, biological replicates. Mean ± s.e.m. (B) Centrosomal PCM levels in mitotic control or TRIM37-depleted cells. Representative images, n = 3, biological replicates. Scale bars, 5 μm. (C) Quantification of centrosomal PCM signal in mitotic cells. n = 3, biological replicates. P values, unpaired two-tailed t-test. Mean ± s.e.m. (D) Quantification of mitotic CEP192 foci in centrinone-treated cells lacking centrosomes. n = 3, biological replicates, each comprising >30 cells. P values, unpaired two-tailed t-test. Mean ± s.e.m. (E) Quantification of mitotic PCM foci in centrinone-treated cells lacking centrosomes. n = 3, biological replicates, each comprising >30 cells. P values, unpaired two-tailed t-test. Mean ± s.e.m. (F) Representative images for (E). Scale bars, 5 μm. (G) Quantification of mitotic spindle length in control and TRIM37-shRNA expressing cells. n = 3, biological replicates, each comprising >10 cells. P values, unpaired two-tailed t-test. Mean ± s.e.m. (H) Relative growth of 3MB-PP1-treated control or CEP192-shRNA expressing cells. n = 4, biological replicates. P values, unpaired two-tailed t-test. Mean ± s.e.m. (I) Mitotic duration in of the cells described in (H) expressing H2B-EGFP and TagRFP-tubulin. Cells were grown in DMSO or 3MB-PP1 for 3 days prior to imaging. Triangles, mean for each biological replicate; coloured circles, individual data points from each replicate. n = 3, biological replicates, each comprising >30 cells. P values, unpaired two-tailed t-test. Mean ± s.e.m. (J) Frequency of mitotic errors quantified in the same samples as described in (I). n = 3, biological replicates, each comprising >30 cells. P values, unpaired two-tailed t-test. Mean ± s.e.m.
Figure 4.
Figure 4.. TRIM37 overexpression delays centrosome separation in late G2 phase and promotes mitotic errors
(A) Quantification of the distance between the two centrosomes at NEBD in control MCF-7, MDA-MB-361, MDA-MB-231, and MDA-MB-436 cells compared to those expressing a TRIM37-shRNA. Data acquired across n = ≥3, biological replicates, each with 8 - 45 cells. P values, unpaired two-tailed t-test. Mean ± s.e.m. (B) Quantification of mitotic phenotypes in control MCF-7, MDA-MB-361, MDA-MB-231, and MDA-MB-436 cells compared to those expressing a TRIM37-shRNA. Data acquired across n = 3, biological replicates, each with >40 cells. P values, unpaired two-tailed t-test. Mean ± s.e.m. (C) Quantification of mitotic duration in control MCF-7, MDA-MB-361, MDA-MB-231, and MDA-MB-436 cells compared to those expressing a TRIM37-shRNA. Triangles represent the mean for each biological replicate; coloured circles show individual data points from each of the replicates. Data acquired across n = 3, biological replicates, each with >40 cells. P values, unpaired two-tailed t-test. Mean ± s.e.m. (D) A model illustrating the synthetic lethal effect of PLK4 inhibition with TRIM37 overexpression in 17q23-amplified breast cancer cells.

Comment in

  • Selectively triggering mitotic failure.
    Crunkhorn S. Crunkhorn S. Nat Rev Drug Discov. 2020 Nov;19(11):755. doi: 10.1038/d41573-020-00165-2. Nat Rev Drug Discov. 2020. PMID: 32943764 No abstract available.

References

    1. Burrell RA, McGranahan N, Bartek J & Swanton C The causes and consequences of genetic heterogeneity in cancer evolution. Nature 501, 338–345, doi:10.1038/nature12625 (2013). - DOI - PubMed
    1. Kalimutho M et al. Patterns of Genomic Instability in Breast Cancer. Trends in pharmacological sciences 40, 198–211, doi:10.1016/j.tips.2019.01.005 (2019). - DOI - PubMed
    1. Lord CJ & Ashworth A PARP inhibitors: Synthetic lethality in the clinic. Science 355, 1152–1158, doi:10.1126/science.aam7344 (2017). - DOI - PMC - PubMed
    1. Curtis C et al. The genomic and transcriptomic architecture of 2,000 breast tumours reveals novel subgroups. Nature 486, 346, doi:10.1038/nature10983 https://www.nature.com/articles/nature10983#supplementary-information (2012). - DOI - PMC - PubMed
    1. Dawson S-J, Rueda OM, Aparicio S & Caldas C A new genome-driven integrated classification of breast cancer and its implications. The EMBO journal 32, 617–628, doi:10.1038/emboj.2013.19 (2013). - DOI - PMC - PubMed

Publication types

MeSH terms