

Genetic Variation of Nine Chicken Breeds Collected from Different Altitudes Revealed by Microsatellites
- PMID: 32908404
- PMCID: PMC7477183
- DOI: 10.2141/jpsa.0160033
Genetic Variation of Nine Chicken Breeds Collected from Different Altitudes Revealed by Microsatellites
Abstract
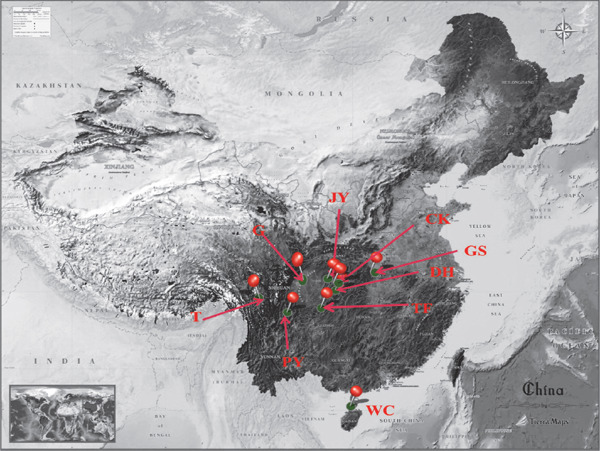
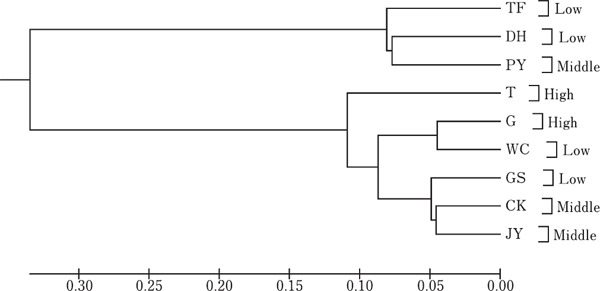
Genetic polymorphisms of 19 microsatellites were investigated in nine local chicken breeds collected from low, middle and high altitudes areas in China (total number was 256) and their population genetic diversity and population structure were analyzed. All breeds were assigned into three groups, including the high (Tibetan chicken (T) and Grey chicken (G), their altitudes were above 1000 m); middle (Chengkou mountainous chicken (CK), Jiuyuan chicken (JY) and Pengxian yellow chicken (PY), their altitudes were between 500 and 1000 m), and low groups (Da ninghe chicken (DH), Tassel first chicken (TF), Gushi chicken (GS) and Wenchang chicken (WC), their altitudes were below 500 m). We found 780 genotypes and 324 alleles via the 19 microsatellites primers, and the results showed that the mean number of alleles (Na ) was 17.05; the average polymorphism information content (PIC) was 0.767; the mean expected heterozygosity (He) was 0.662; as for observed heterozygosity (Ho ), it was 0.647. The AMOVA results indicated the genetic variation mainly existed within individuals among populations (80%). There was no genetic variation among the three altitude groups (0%). The mean inbreeding coefficient among individuals within population (FIS ) was 0.031 and the mean gene flow (Nm ) was 1.790. The mean inbreeding coefficient among populations within a group (FST ) was 0.157. All loci deviated Hardy-Weinberg equilibrium. The genetic distance ranged from 0.090 to 0.704. Generally, genetic variations were mainly made up of the variations among populations and within individuals. There were rich gene diversities in the populations for the detected loci. Meanwhile, frequent genes exchange existed among the populations. This can lead to extinction of the peripheral species, such as the Tibetan chicken breed.
Keywords: altitude; chicken; genetic variation; microsatellite; population structure.
2017, Japan Poultry Science Association.
Figures
Similar articles
-
Analysis of genetic diversity and phylogenetic relationships among red jungle fowls and Chinese domestic fowls.Sci China C Life Sci. 2008 Jun;51(6):560-8. doi: 10.1007/s11427-008-0076-y. Epub 2008 May 17. Sci China C Life Sci. 2008. PMID: 18488177
-
Investigating genetic diversity and population phylogeny of five Chongqing local chicken populations autosomal using microsatellites.Anim Biotechnol. 2022 Nov;33(6):1190-1197. doi: 10.1080/10495398.2021.1880421. Epub 2021 Feb 26. Anim Biotechnol. 2022. PMID: 33635178
-
[Analysis of genetic diversity of preserved population of native chicken breeds by microsatellites and file foundation of markers].Yi Chuan. 2004 Nov;26(6):859-64. Yi Chuan. 2004. PMID: 15640117 Chinese.
-
Genetic diversity of Saudi native chicken breeds segregating for naked neck and frizzle genes using microsatellite markers.Asian-Australas J Anim Sci. 2018 Dec;31(12):1871-1880. doi: 10.5713/ajas.18.0041. Epub 2018 May 31. Asian-Australas J Anim Sci. 2018. PMID: 29879833 Free PMC article.
-
Evaluation of genetic diversity in Chinese indigenous chicken breeds using microsatellite markers.Sci China C Life Sci. 2006 Aug;49(4):332-41. doi: 10.1007/s11427-006-2001-6. Sci China C Life Sci. 2006. PMID: 16989278
Cited by
-
Polymorphisms in the Egl nine homolog 3 (EGLN3) and Peroxisome proliferator activated receptor-alpha (PPARα) genes and their correlation with hypoxia adaptation in Tibetan chickens.PLoS One. 2018 Mar 15;13(3):e0194156. doi: 10.1371/journal.pone.0194156. eCollection 2018. PLoS One. 2018. PMID: 29543898 Free PMC article.
-
Genetic Diversity and Population Structure Analysis of Luhua chickens Based on Genome-Wide Markers.Animals (Basel). 2025 Jul 14;15(14):2071. doi: 10.3390/ani15142071. Animals (Basel). 2025. PMID: 40723534 Free PMC article.
References
-
- Gämperle E, Schneller JJ. Phenotypic and isozyme variation in Cystopteris fragilis (Pteridophyta) along an altitudinal gradient in Switzerland. Flora - Morphology Distribution Functional Ecology of Plants, 197: 203-213. 2002.
-
- Nei MF, Tajima F, Tateno Y. Accuracy of estimated phylogenetic trees from molecular data. II. Gene frequency data. Journal of Molecular Evolution, 19: 153-170. 1983. - PubMed
LinkOut - more resources
Full Text Sources
Research Materials
Miscellaneous