

Genetic analysis redraws the management boundaries for the European sprat
- PMID: 32908594
- PMCID: PMC7463317
- DOI: 10.1111/eva.12942
Genetic analysis redraws the management boundaries for the European sprat
Abstract
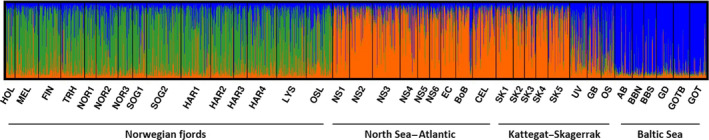
Sustainable fisheries management requires detailed knowledge of population genetic structure. The European sprat is an important commercial fish distributed from Morocco to the Arctic circle, Baltic, Mediterranean, and Black seas. Prior to 2018, annual catch advice on sprat from the International Council for the Exploration of the Sea (ICES) was based on five putative stocks: (a) North Sea, (b) Kattegat-Skagerrak and Norwegian fjords, (c) Baltic Sea, (d) West of Scotland-southern Celtic Seas, and (e) English Channel. However, there were concerns that the sprat advice on stock size estimates management plan inadequately reflected the underlying biological units. Here, we used ddRAD sequencing to develop 91 SNPs that were thereafter used to genotype approximately 2,500 fish from 40 locations. Three highly distinct and relatively homogenous genetic groups were identified: (a) Norwegian fjords; (b) Northeast Atlantic including the North Sea, Kattegat-Skagerrak, Celtic Sea, and Bay of Biscay; and (c) Baltic Sea. Evidence of genetic admixture and possibly physical mixing was detected in samples collected from the transition zone between the North and Baltic seas, but not between any of the other groups. These results have already been implemented by ICES with the decision to merge the North Sea and the Kattegat-Skagerrak sprat to be assessed as a single unit, thus demonstrating that genetic data can be rapidly absorbed to align harvest regimes and biological units.
Keywords: SNPs; Sprattus sprattus; ddRADseq; fisheries; management; population structure.
© 2020 The Authors. Evolutionary Applications published by John Wiley & Sons Ltd.
Conflict of interest statement
None declared
Figures


Similar articles
-
Genetic response to human-induced habitat changes in the marine environment: A century of evolution of European sprat in Landvikvannet, Norway.Ecol Evol. 2021 Jan 18;11(4):1691-1718. doi: 10.1002/ece3.7160. eCollection 2021 Feb. Ecol Evol. 2021. PMID: 33613998 Free PMC article.
-
Hydroids (Cnidaria, Hydrozoa) from Mauritanian Coral Mounds.Zootaxa. 2020 Nov 16;4878(3):zootaxa.4878.3.2. doi: 10.11646/zootaxa.4878.3.2. Zootaxa. 2020. PMID: 33311142
-
Mitochondrial phylogeography of the European sprat (Sprattus sprattus L., Clupeidae) reveals isolated climatically vulnerable populations in the Mediterranean Sea and range expansion in the northeast Atlantic.Mol Ecol. 2008 Sep;17(17):3873-88. doi: 10.1111/j.1365-294X.2008.03872.x. Epub 2008 Jul 17. Mol Ecol. 2008. PMID: 18643878
-
The biology and fisheries of European hake, Merluccius merluccius, in the north-east Atlantic.Adv Mar Biol. 2010;58:97-154. doi: 10.1016/B978-0-12-381015-1.00002-2. Adv Mar Biol. 2010. PMID: 20959157 Review.
-
Viral haemorrhagic septicaemia virus in marine fish and its implications for fish farming--a review.J Fish Dis. 2005 Sep;28(9):509-29. doi: 10.1111/j.1365-2761.2005.00654.x. J Fish Dis. 2005. PMID: 16266325 Review.
Cited by
-
Genetic investigation of population structure in Atlantic chub mackerel, Scomber colias Gmelin, 1789 along the West African coast.PeerJ. 2024 Sep 5;12:e17928. doi: 10.7717/peerj.17928. eCollection 2024. PeerJ. 2024. PMID: 39247552 Free PMC article.
-
Genetics in the Ocean's Twilight Zone: Population Structure of the Glacier Lanternfish Across Its Distribution Range.Evol Appl. 2024 Nov 6;17(11):e70032. doi: 10.1111/eva.70032. eCollection 2024 Nov. Evol Appl. 2024. PMID: 39513049 Free PMC article.
-
Aquaculture-driven evolution of the salmon louse mtDNA genome.Evol Appl. 2023 Jun 28;16(7):1328-1344. doi: 10.1111/eva.13572. eCollection 2023 Jul. Evol Appl. 2023. PMID: 37492153 Free PMC article.
-
Limited Parallelism in Genetic Adaptation to Brackish Water Bodies in European Sprat and Atlantic Herring.Genome Biol Evol. 2024 Jul 3;16(7):evae133. doi: 10.1093/gbe/evae133. Genome Biol Evol. 2024. PMID: 38918882 Free PMC article.
-
Genetic response to human-induced habitat changes in the marine environment: A century of evolution of European sprat in Landvikvannet, Norway.Ecol Evol. 2021 Jan 18;11(4):1691-1718. doi: 10.1002/ece3.7160. eCollection 2021 Feb. Ecol Evol. 2021. PMID: 33613998 Free PMC article.
References
-
- Allendorf, F. W. , England, P. R. , Luikart, G. , Ritchie, P. A. , & Ryman, N. (2008). Genetic effects of harvest on wild animal populations. Trends in Ecology & Evolution, 23, 327–337. - PubMed
-
- Asplin, L. , Johnsen, I. A. , Sandvik, A. D. , Albretsen, J. , Sundfjord, V. , Aure, J. , & Boxaspen, K. K. (2014). Dispersion of salmon lice in the Hardangerfjord. Marine Biology Research, 10, 216–225.
LinkOut - more resources
Full Text Sources
