

Seascape genomics as a new tool to empower coral reef conservation strategies: An example on north-western Pacific Acropora digitifera
- PMID: 32908595
- PMCID: PMC7463334
- DOI: 10.1111/eva.12944
Seascape genomics as a new tool to empower coral reef conservation strategies: An example on north-western Pacific Acropora digitifera
Abstract
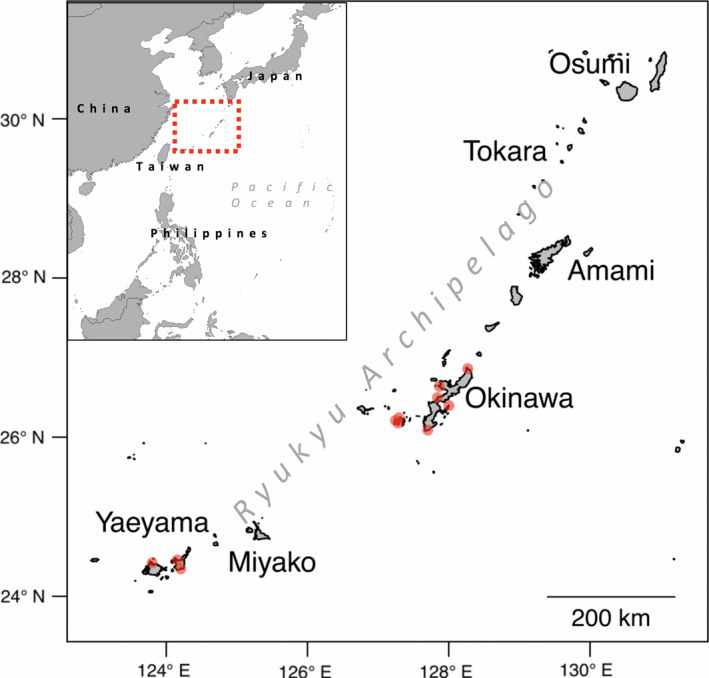
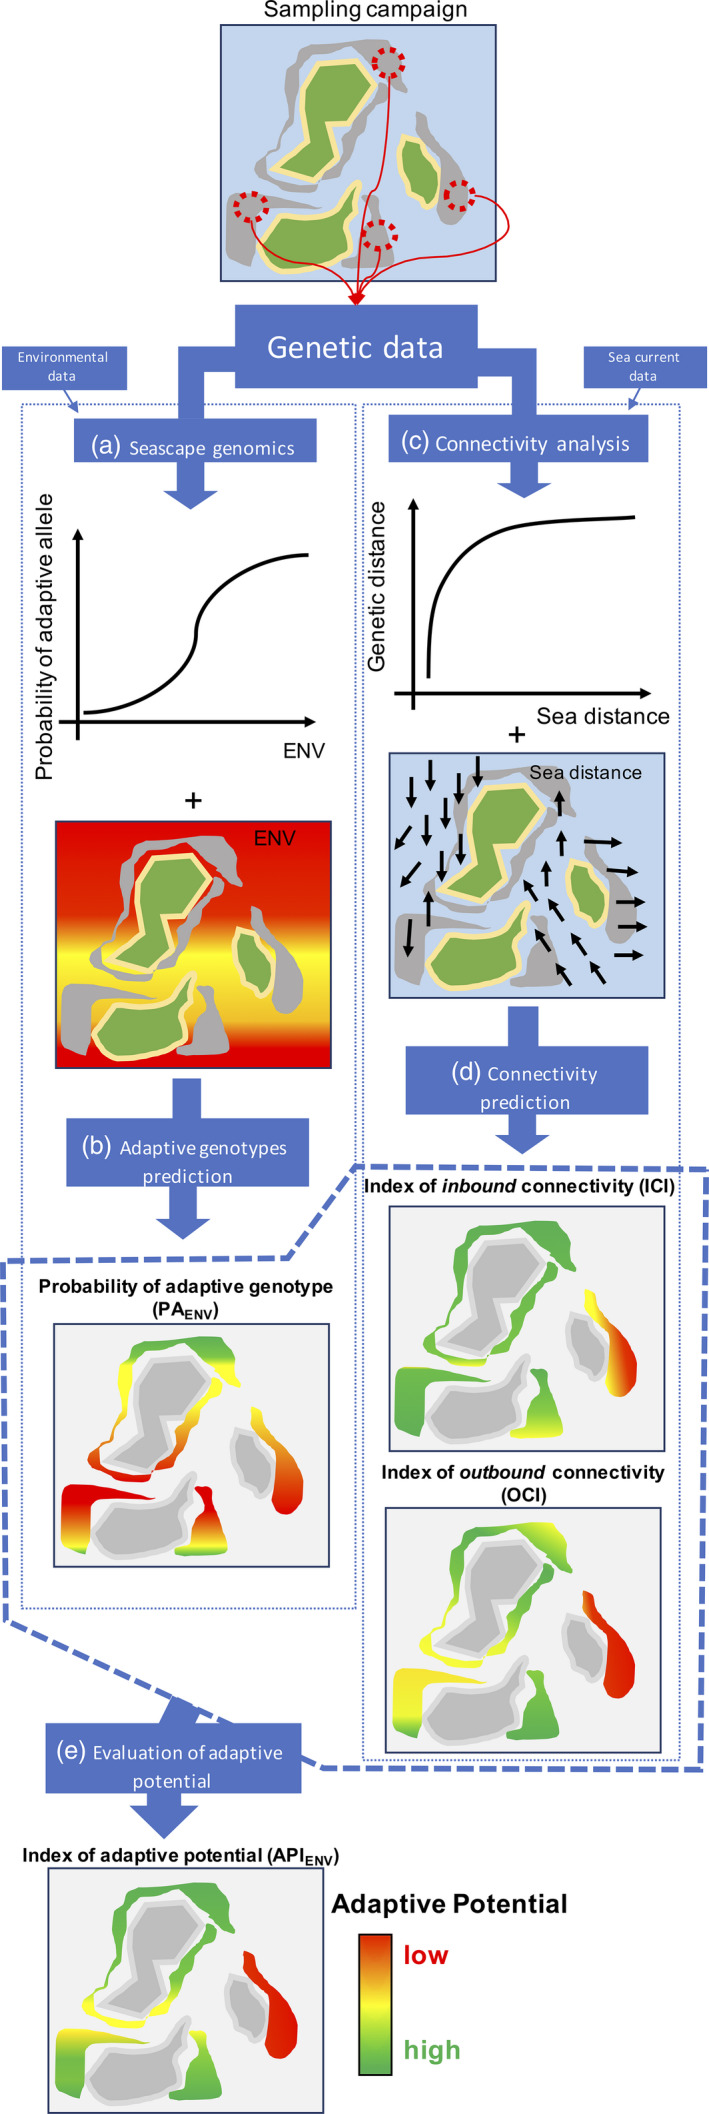
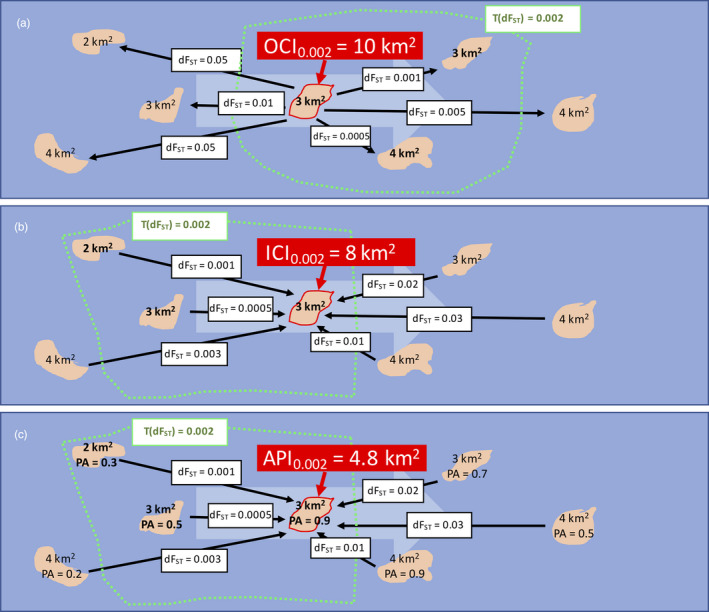
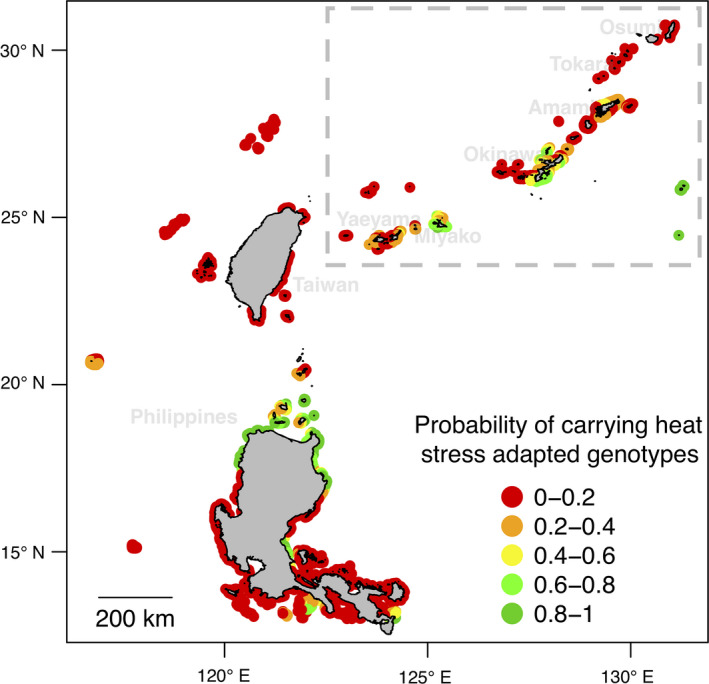
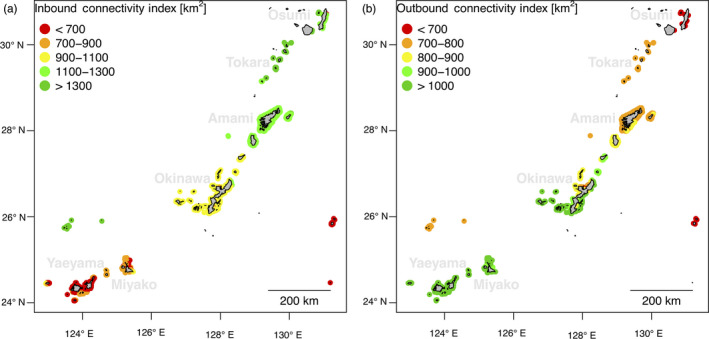
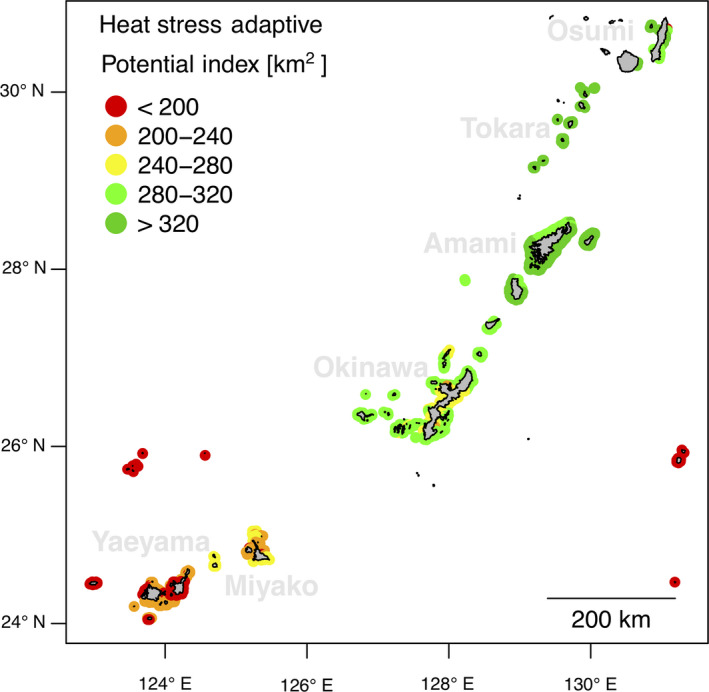
Coral reefs are suffering a major decline due to the environmental constraints imposed by climate change. Over the last 20 years, three major coral bleaching events occurred in concomitance with anomalous heatwaves, provoking a severe loss of coral cover worldwide. The conservation strategies for preserving reefs, as they are implemented now, cannot cope with global climatic shifts. Consequently, researchers are advocating for preservation networks to be set-up to reinforce coral adaptive potential. However, the main obstacle to this implementation is that studies on coral adaption are usually hard to generalize at the scale of a reef system. Here, we study the relationships between genotype frequencies and environmental characteristics of the sea (seascape genomics), in combination with connectivity analysis, to investigate the adaptive potential of a flagship coral species of the Ryukyu Archipelago (Japan). By associating genotype frequencies with descriptors of historical environmental conditions, we discovered six genomic regions hosting polymorphisms that might promote resistance against heat stress. Remarkably, annotations of genes in these regions were consistent with molecular roles associated with heat responses. Furthermore, we combined information on genetic and spatial distances between reefs to predict connectivity at a regional scale. The combination of these results portrayed the adaptive potential of this population: we were able to identify reefs carrying potential heat stress adapted genotypes and to understand how they disperse to neighbouring reefs. This information was summarized by objective, quantifiable and mappable indices covering the whole region, which can be extremely useful for future prioritization of reefs in conservation planning. This framework is transferable to any coral species on any reef system and therefore represents a valuable tool for empowering preservation efforts dedicated to the protection of coral reefs in warming oceans.
Keywords: Acropora digitifera; Ryukyu Archipelago; climate change; conservation genomics; coral bleaching; coral reefs; local adaptation; seascape genomics.
© 2020 The Authors. Evolutionary Applications published by John Wiley & Sons Ltd.
Figures
Similar articles
-
Coral cover surveys corroborate predictions on reef adaptive potential to thermal stress.Sci Rep. 2020 Nov 12;10(1):19680. doi: 10.1038/s41598-020-76604-2. Sci Rep. 2020. PMID: 33184366 Free PMC article.
-
Population connectivity and genetic offset in the spawning coral Acropora digitifera in Western Australia.Mol Ecol. 2022 Jul;31(13):3533-3547. doi: 10.1111/mec.16498. Epub 2022 Jun 5. Mol Ecol. 2022. PMID: 35567512 Free PMC article.
-
Seascape genomics reveals candidate molecular targets of heat stress adaptation in three coral species.Mol Ecol. 2021 Apr;30(8):1892-1906. doi: 10.1111/mec.15857. Epub 2021 Mar 18. Mol Ecol. 2021. PMID: 33619812 Free PMC article.
-
Operationalizing resilience for adaptive coral reef management under global environmental change.Glob Chang Biol. 2015 Jan;21(1):48-61. doi: 10.1111/gcb.12700. Epub 2014 Sep 5. Glob Chang Biol. 2015. PMID: 25196132 Free PMC article. Review.
-
Finding genes and pathways that underlie coral adaptation.Trends Genet. 2024 Mar;40(3):213-227. doi: 10.1016/j.tig.2024.01.003. Epub 2024 Feb 6. Trends Genet. 2024. PMID: 38320882 Review.
Cited by
-
Evolutionary Genomics of Two Co-occurring Congeneric Fore Reef Coral Species on Guam (Mariana Islands).Genome Biol Evol. 2025 Jan 6;17(1):evae278. doi: 10.1093/gbe/evae278. Genome Biol Evol. 2025. PMID: 39834241 Free PMC article.
-
A Seascape Genomics Perspective on Restrictive Genetic Connectivity Overcoming Signals of Local Adaptations in the Green Abalone (Haliotis fulgens) of the California Current System.Ecol Evol. 2025 Feb 4;15(2):e70913. doi: 10.1002/ece3.70913. eCollection 2025 Feb. Ecol Evol. 2025. PMID: 39911416 Free PMC article.
-
Harnessing Multiscale Topographic Environmental Variables for Regional Coral Species Distribution Models.Ecol Evol. 2025 Apr 23;15(4):e71292. doi: 10.1002/ece3.71292. eCollection 2025 Apr. Ecol Evol. 2025. PMID: 40270802 Free PMC article.
-
Small-scale genetic structure of coral populations in Palau based on whole mitochondrial genomes: Implications for future coral resilience.Evol Appl. 2023 Jan 5;16(2):518-529. doi: 10.1111/eva.13509. eCollection 2023 Feb. Evol Appl. 2023. PMID: 36793699 Free PMC article.
-
Environmental Drivers of Genetic Divergence in Two Corals From the Florida Keys.Evol Appl. 2025 Jun 29;18(7):e70126. doi: 10.1111/eva.70126. eCollection 2025 Jul. Evol Appl. 2025. PMID: 40589611 Free PMC article.
References
-
- Ateweberhan, M. , Feary, D. A. , Keshavmurthy, S. , Chen, A. , Schleyer, M. H. , & Sheppard, C. R. C. (2013). Climate change impacts on coral reefs: Synergies with local effects, possibilities for acclimation, and management implications. Marine Pollution Bulletin, 74(2), 526–539. - PubMed
-
- Balkenhol, N. , Dudaniec, R. Y. , Krutovsky, K. V. , Johnson, J. S. , Cairns, D. M. , Segelbacher, G. , … Joost, S. (2017). Landscape genomics: Understanding relationships between environmental heterogeneity and genomic characteristics of populations (pp. 261–322). Cham: Springer.
-
- Baums, I. B. (2008). A restoration genetics guide for coral reef conservation. Molecular Ecology, 17(12), 2796–2811. - PubMed
-
- Bay, R. A. , & Palumbi, S. R. (2014). Multilocus adaptation associated with heat resistance in reef‐building corals. Current Biology, 24(24), 2952–2956. - PubMed
Associated data
LinkOut - more resources
Full Text Sources
