. 2020 Aug 18:2020:2825037.
doi: 10.1155/2020/2825037. eCollection 2020.

A Novel Metabolic Connectome Method to Predict Progression to Mild Cognitive Impairment

Affiliations

A Novel Metabolic Connectome Method to Predict Progression to Mild Cognitive Impairment

Min Wang et al. Behav Neurol. .

Abstract

Objective: Glucose-based positron emission tomography (PET) imaging has been widely used to predict the progression of mild cognitive impairment (MCI) into Alzheimer's disease (AD) clinically. However, existing discriminant methods are unsubtle to reveal pathophysiological changes. Therefore, we present a novel metabolic connectome-based predictive modeling to predict progression from MCI to AD accurately.

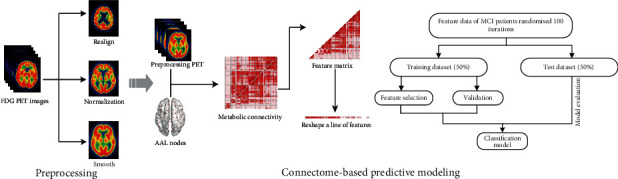
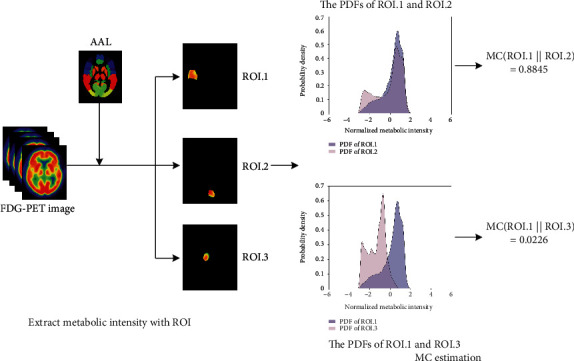
Methods: In this study, we acquired fluorodeoxyglucose PET images and clinical assessments from 420 MCI patients with 36 months follow-up. Individual metabolic network based on connectome analysis was constructed, and the metabolic connectivity in this network was extracted as predictive features. Three different classification strategies were implemented to interrogate the predictive performance. To verify the effectivity of selected features, specific brain regions associated with MCI conversion were identified based on these features and compared with prior knowledge.

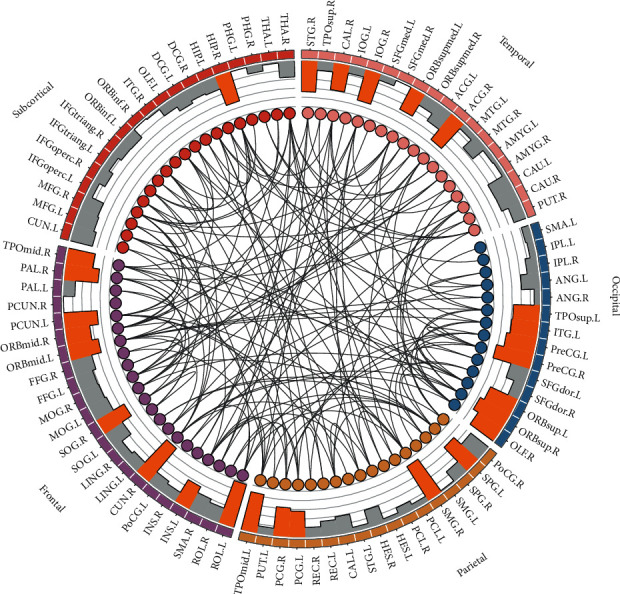
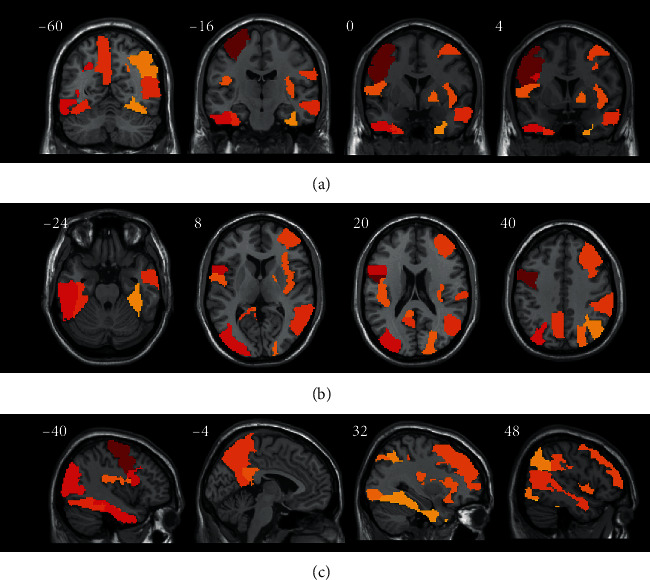
Results: As a result, 4005 connectome features were obtained, and 153 in which were selected as efficient features. Our proposed feature extraction method had achieved 85.2% accuracy for MCI conversion prediction (sensitivity: 88.1%; specificity: 81.2%; and AUC: 0.933). The discriminative brain regions associated with MCI conversion were mainly located in the precentral gyrus, precuneus, lingual, and inferior frontal gyrus.

Conclusion: Overall, the results suggest that our proposed individual metabolic connectome method has great potential to predict whether MCI patients will progress to AD. The metabolic connectome may help to identify brain metabolic dysfunction and build a clinically applicable biomarker to predict the MCI progression.


Conflict of interest statement

The authors declare that they have no conflicts of interest.

Figures

Figure 1
Figure 1
The overall framework of the proposed metabolic connectome-based predictive modeling (CPM) approach in this study.
Figure 2
Figure 2
The framework for the estimation of metabolic connectivity (MC) between pairwise regions from individual FDG-PET image. Firstly, the FDG-PET image was divided into 90 ROIs, and the metabolic intensity values of voxels with random ROI were extracted. Then, kernel density estimation was employed to estimate the probability density function (PDF) of each ROI. Lastly, the KLSE algorithm was implemented to measure the metabolic correlation by the similarity among PDFs.
Figure 3
Figure 3
The brain metabolic connectivity associated with MCI conversion. The nodes in the circle represent 90 brain regions (ROIs). The different colors of nodes on the circle represent different anatomical classifications of brain regions (purple: frontal, orange: parietal, blue: occipital, pink: temporal, and red: subcortical). The black lines within nodes represent functional connectivity between ROIs selected with sufficient discriminative ability and associated with AD progression. The yellow histogram bars represent the hubs with more metabolic connectivity and the grey bars with little discriminative ability.
Figure 4
Figure 4
Topographic representations of connectome approach. The hubs regions were acquired from the training dataset using the LASSO approach in 100 iterations and were associated with the conversion from MCI to AD. The overlays are depicted in neurological coronal (a), transverse (b), and sagittal (c) orientations, respectively. Coordinates are displayed in MNI standard space.

Similar articles

Cited by

References

    1. Alzheimer's Association. 2019 Alzheimer's disease facts and figures. Alzheimer's & Dementia. 2019;15(3):321–387. doi: 10.1016/j.jalz.2019.01.010. - DOI - PubMed
    1. Dubois B., Hampel H., Feldman H. H., et al. Preclinical Alzheimer's disease: definition, natural history, and diagnostic criteria. Alzheimer's & Dementia. 2016;12(3):292–323. doi: 10.1016/j.jalz.2016.02.002. - DOI - PMC - PubMed
    1. Olsson B., Lautner R., Andreasson U., et al. Csf and blood biomarkers for the diagnosis of Alzheimer's disease: a systematic review and meta-analysis. The Lancet Neurology. 2016;15(7):673–684. doi: 10.1016/S1474-4422(16)00070-3. - DOI - PubMed
    1. Ong K., Villemagne V. L., Bahar-Fuchs A., et al. 18F-florbetaben Aβ imaging in mild cognitive impairment. Alzheimer's Research & Therapy. 2013;5(1) doi: 10.1186/alzrt158. - DOI - PMC - PubMed
    1. Kalheim L. F., Selnes P., Bjørnerud A., Coello C., Vegge K., Fladby T. Amyloid dysmetabolism relates to reduced glucose uptake in white matter hyperintensities. Frontiers in Neurology. 2016;7 doi: 10.3389/fneur.2016.00209. - DOI - PMC - PubMed

Substances