. 2020 Aug 22:2020:2862701.
doi: 10.1155/2020/2862701. eCollection 2020.

Bioinformatics Analysis of Key Genes and circRNA-miRNA-mRNA Regulatory Network in Gastric Cancer

Affiliations

Bioinformatics Analysis of Key Genes and circRNA-miRNA-mRNA Regulatory Network in Gastric Cancer

Yiting Tian et al. Biomed Res Int. .

Abstract

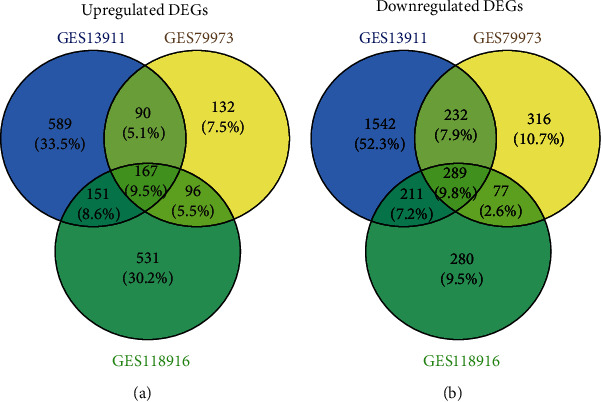
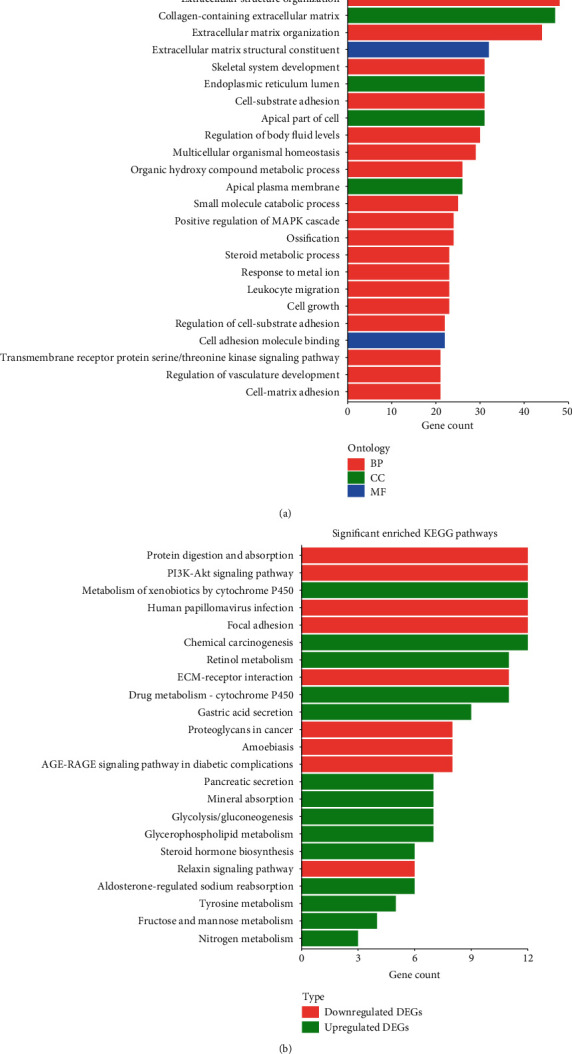
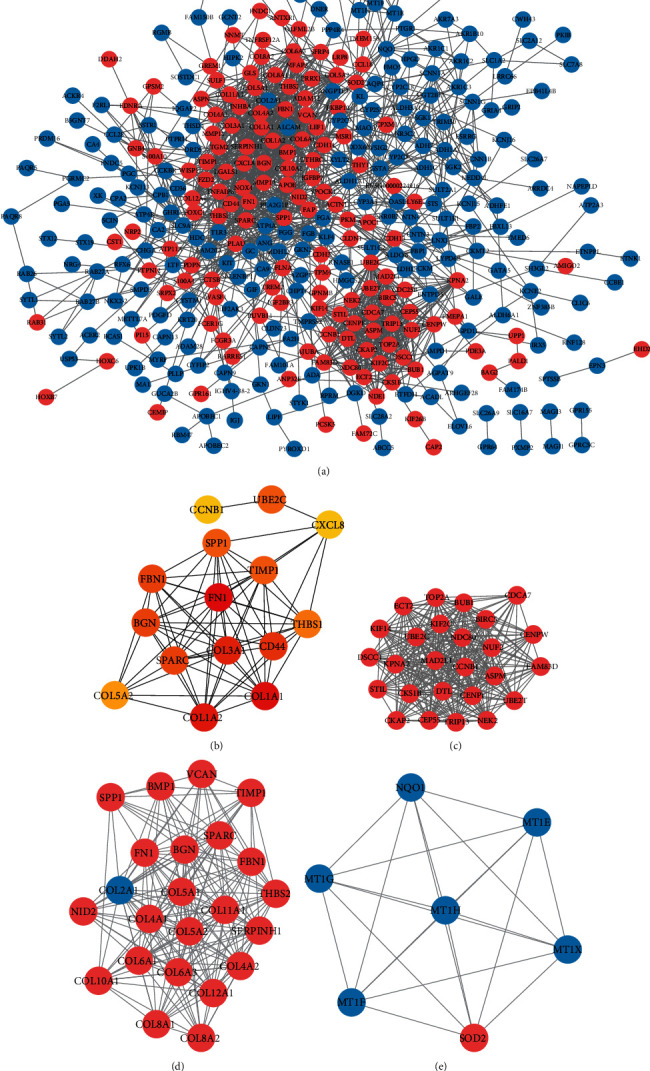
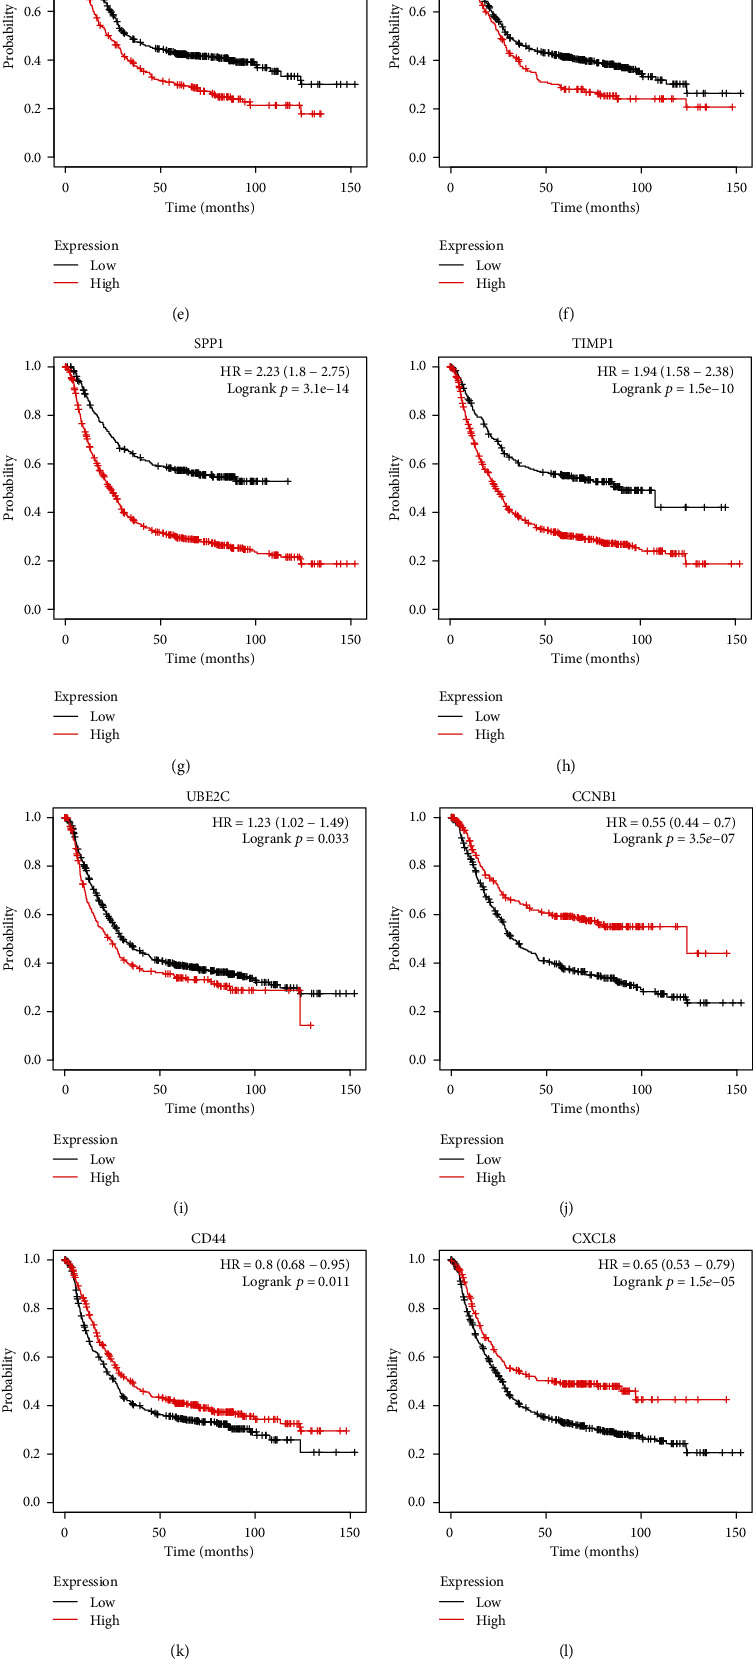
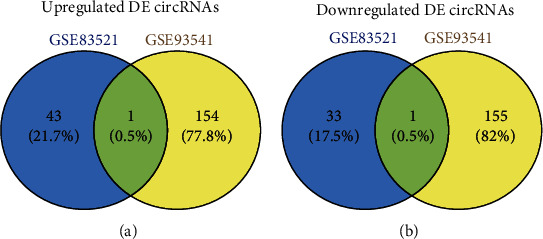
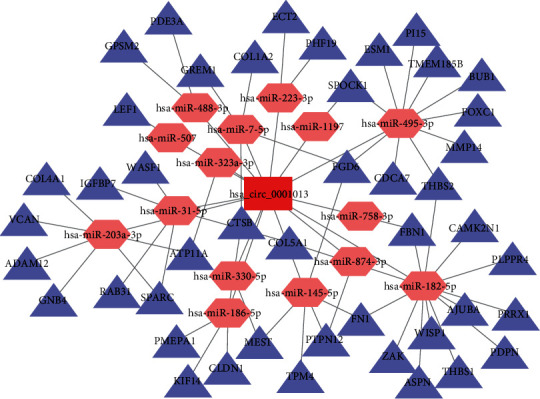
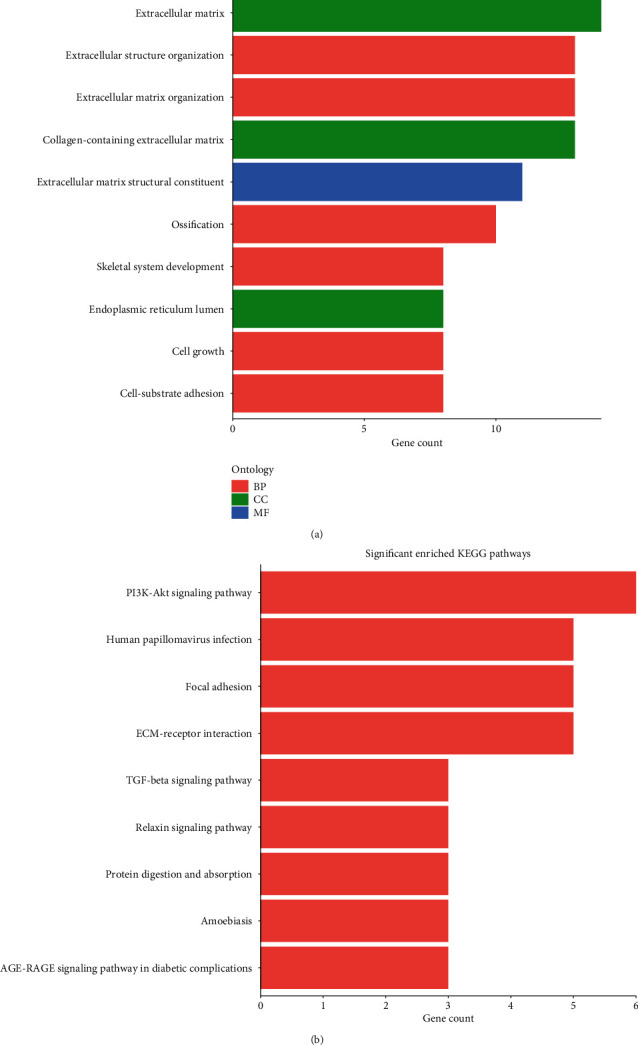
Gastric cancer (GC) is one of the most common malignancies in the world, with morbidity and mortality ranking second among all cancers. Accumulating evidences indicate that circular RNAs (circRNAs) are closely correlated with tumorigenesis. However, the mechanisms of circRNAs still remain unclear. This study is aimed at determining hub genes and circRNAs and analyzing their potential biological functions in GC. Expression profiles of mRNAs and circRNAs were downloaded from the Gene Expression Omnibus (GEO) data sets of GC and paracancer tissues. Differentially expressed genes (DEGs) and differentially expressed circRNAs (DE-circRNAs) were identified. The target miRNAs of DE-circRNAs and the bidirectional interaction between target miRNAs and DEGs were predicted. Functional analysis was performed, and the protein-protein interaction (PPI) network and the circRNA-miRNA-mRNA network were established. A total of 456 DEGs and 2 DE-circRNAs were identified with 3 mRNA expression profiles and 2 circRNA expression profiles. GO analysis indicated that DEGs were mainly enriched in extracellular matrix and cell adhesion, and KEGG confirmed that DEGs were mainly associated with focal adhesion, the PI3K-Akt signaling pathway, extracellular matrix- (ECM)- receptor interaction, and gastric acid secretion. 15 hub DEGs (BGN, COL1A1, COL1A2, FBN1, FN1, SPARC, SPP1, TIMP1, UBE2C, CCNB1, CD44, CXCL8, COL3A1, COL5A2, and THBS1) were identified from the PPI network. Furthermore, the survival analysis indicate that GC patients with a high expression of the following 9 hub DEGs, namely, BGN, COL1A1, COL1A2, FBN1, FN1, SPARC, SPP1, TIMP1, and UBE2C, had significantly worse overall survival. The circRNA-miRNA-mRNA network was constructed based on 1 circRNA, 15 miRNAs, and 45 DEGs. In addition, the 45 DEGs included 5 hub DEGs. These results suggested that hub DEGs and circRNAs could be implicated in the pathogenesis and development of GC. Our findings provide novel evidence on the circRNA-miRNA-mRNA network and lay the foundation for future research of circRNAs in GC.


Conflict of interest statement

The authors declare that there is no conflict of interest regarding the publication of this paper.

Figures

Figure 1
Figure 1
The identification of DEGs in the three data sets (GSE13911, GSE79973, and GSE118916). (a) Upregulated DEGs. (b) Downregulated DEGs. Different color regions represented different data sets. Overlapping areas are commonly DEGs. The cutoff criteria: ∣logFC | >1.0 and adj. p value < 0.05. DEGs: differentially expressed genes.
Figure 2
Figure 2
GO analysis and KEGG analysis of DEGs in GC. (a) The top 25 enriched GO terms of BP category, CC category, and MF category. (b) The significant enriched KEGG pathways.
Figure 3
Figure 3
PPI network and modular analysis of DEGs. (a) The PPI network contains 369 nodes and 1570 edges; red represents upregulated DEGs, and blue represents downregulated DEGs. (b) The hub DEGs (degree: top 15) identified by the cytoHubba plug-in. The darker the color in the node, the higher the degree of interaction. (c) Module 1 contains 25 DEGs. (d) Module 2 contains 23 DEGs. (e) Module 3 contains 7 DEGs. The color of each node represents DEGs (red represents upregulated DEGs, and blue represents downregulated DEGs). PPI: protein-protein interaction.
Figure 4
Figure 4
Survival analysis of the top 15 hub genes by the Kaplan-Meier plotter database in GC patient samples. (a–i) Survival analysis of BGN (a), COL1A1 (b), COL1A2 (c), FBN1 (d), FN1 (e), SPARC (f), SPP1 (g), TIMP1 (h), and UBE2C (i) by the Kaplan-Meier plotter database in GC patients. The results show that the survival of GC patients with high expressions of these DEGs was significantly worse (p < 0.01). (j–l) Survival analysis of CCNB1 (j), CD44 (k), and CXCL8 (l) by the Kaplan-Meier plotter database in GC patients. The data show that the survival of GC patients with high expressions of CCNB1, CD44, and CXCL8 were significantly better (p < 0.05). (m–o) Survival analysis of COL3A1 (m), COL5A2 (n), and THBS1 (o) by the Kaplan-Meier plotter database in GC patients. The result shows that COL3A1, COL5A2, and THBS1 were not associated with excessive survival in GC patients (p > 0.05).
Figure 5
Figure 5
The identification of DE-circRNAs in the two data sets (GSE83521 and GSE93541). (a) Upregulated DE-circRNAs. (b) Downregulated DE-circRNAs. Different color regions represent different data sets. Overlapping areas are commonly DE-circRNAs. The cutoff criteria: ∣logFC | >1.0 and adj. p value < 0.05. DE-circRNAs: differentially expressed circRNAs.
Figure 6
Figure 6
The circRNA-miRNA-mRNA network in GC. The circRNA-miRNA-mRNA network contains 61 nodes and 72 edges. The red rectangle represents DE-circRNA, the pink hexagons represent miRNAs, and the purple triangles represent DEGs.
Figure 7
Figure 7
GO analysis and KEGG analysis of circRNA-miRNA-mRNA networks in GC. (a) GO analysis of the 45 DEGs in the circRNA-miRNA-mRNA networks. (b) KEGG pathway enrichment analysis of the 45 DEGs in the networks.

Similar articles

Cited by

References

    1. Song Z., Wu Y., Yang J., Yang D., Fang X. Progress in the treatment of advanced gastric cancer. Tumor Biology. 2017;39(7) doi: 10.1177/1010428317714626. - DOI - PubMed
    1. Niccolai E., Taddei A., Prisco D., Amedei A. Gastric cancer and the epoch of immunotherapy approaches. World Journal of Gastroenterology. 2015;21(19):5778–5793. doi: 10.3748/wjg.v21.i19.5778. - DOI - PMC - PubMed
    1. Liu W., Ouyang S., Zhou Z., et al. Identification of genes associated with cancer progression and prognosis in lung adenocarcinoma: analyses based on microarray from Oncomine and The Cancer Genome Atlas databases. Molecular genetics & genomic medicine. 2019;7(2, article e00528) doi: 10.1002/mgg3.528. - DOI - PMC - PubMed
    1. The Cancer Genome Atlas Research Network. Comprehensive molecular characterization of gastric adenocarcinoma. Nature. 2014;513(7517):202–209. doi: 10.1038/nature13480. - DOI - PMC - PubMed
    1. Zhang C., Peng L., Zhang Y., et al. The identification of key genes and pathways in hepatocellular carcinoma by bioinformatics analysis of high-throughput data. Medical Oncology. 2017;34(6) doi: 10.1007/s12032-017-0963-9. - DOI - PMC - PubMed

MeSH terms