. 2020 Aug 27:2020:7838924.
doi: 10.1155/2020/7838924. eCollection 2020.

THAP11 Functions as a Tumor Suppressor in Gastric Cancer through Regulating c-Myc Signaling Pathways

Affiliations

THAP11 Functions as a Tumor Suppressor in Gastric Cancer through Regulating c-Myc Signaling Pathways

Jing Zhang et al. Biomed Res Int. .

Abstract

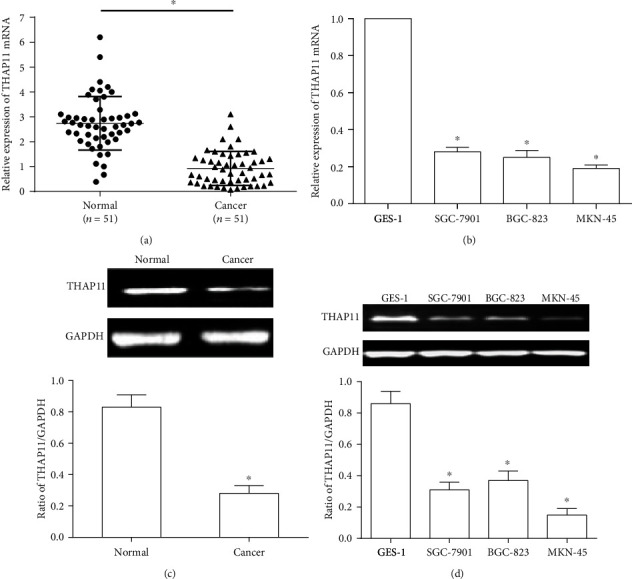
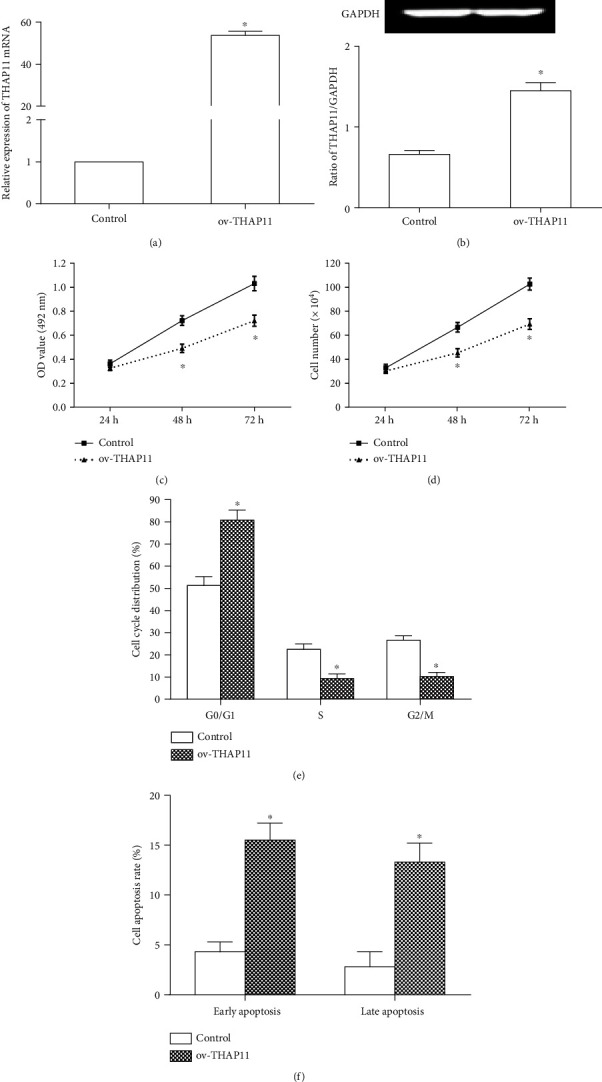
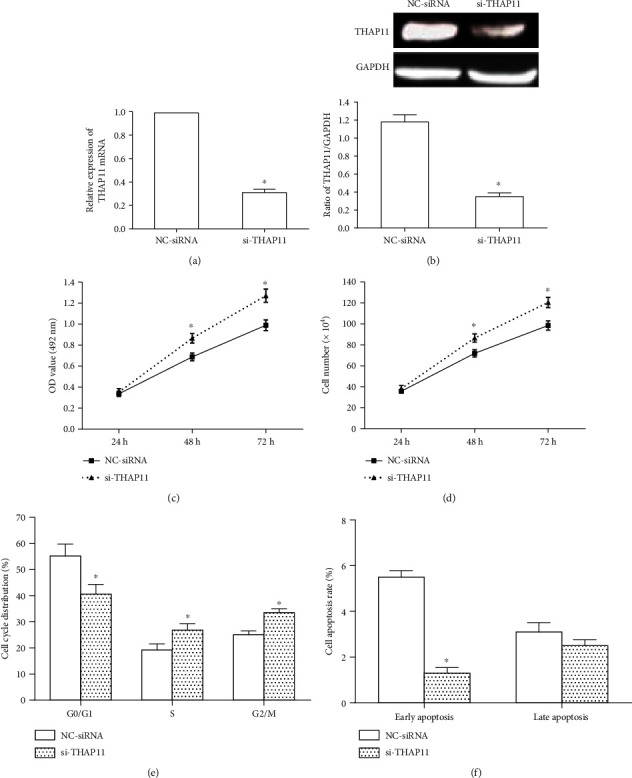
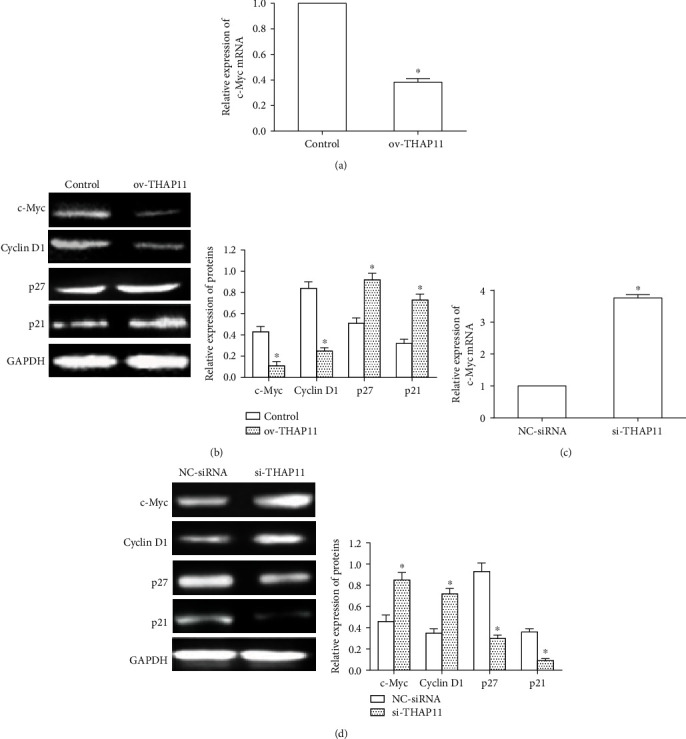
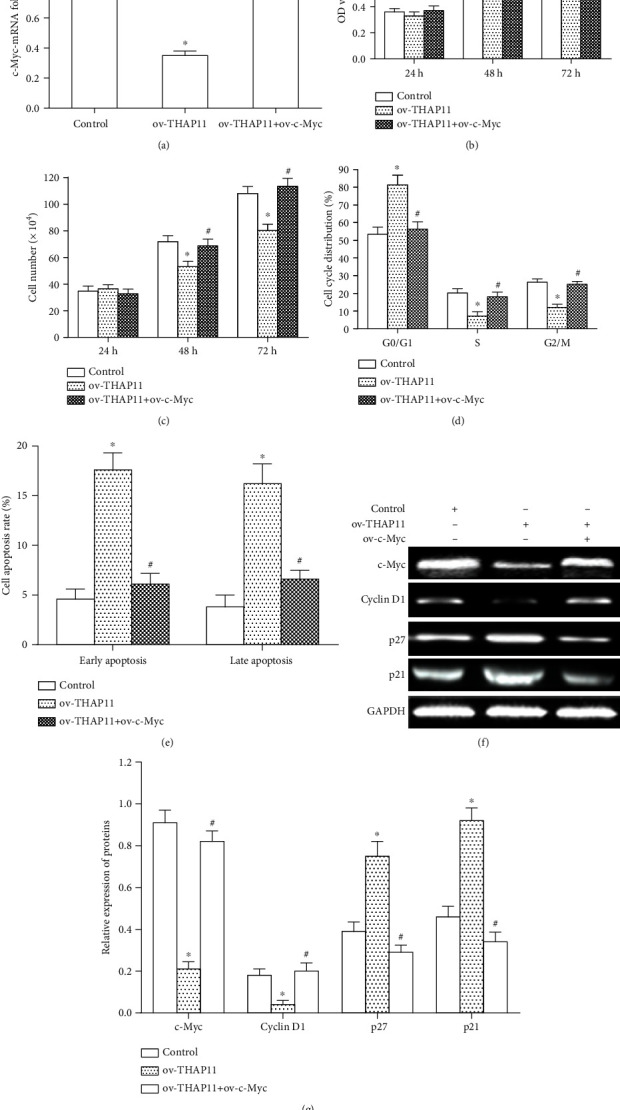
We aim to investigate the role of THAP11 (thanatos-associated protein11) in gastric cancer and its regulation mechanisms. THAP11 expression was analyzed in 51 pairs of GC tissues and the corresponding paracancerous tissues by qRT-PCR and Western blot. After THAP11 was overexpressed or knocked-down, cell proliferation, cell cycle, and apoptosis were detected in MKN-45 cells. We found that THAP11 was significantly downregulated in GC tissues and GC cell lines. Functionally, THAP11 overexpression markedly inhibited cell growth, induced G1/G0 cell-cycle arrest, and promoted cell apoptosis of MKN-45 cells, while silencing of THAP11 led to increased cell growth, increased DNA synthesis, and inhibited apoptosis. In addition, THAP11 negatively regulated the expression of c-Myc, decreased cyclinD1 protein, and increased p27 and p21 protein levels. We also found cell growth suppression induced by THAP11 was rescued by c-Myc overexpression, further confirming that THAP11 suppresses gastric cancer cell growth via the c-Myc pathway. THAP11 acts as a cell growth suppressor and exerts its role possibly through negatively regulating c-Myc pathway in gastric cancer.


Conflict of interest statement

The authors declare that there is no conflict of interest regarding the publication of this paper.

Figures

Figure 1
Figure 1
Analysis of THAP11 mRNA and protein expression in GC tissues and cell lines. (a) THAP11 mRNA expression in GC tissues was analyzed by qRT-PCR. (b) THAP11 mRNA expression in GC cell lines was analyzed by qRT-PCR. (c) THAP11 protein expression in GC tissues was analyzed by Western blot. GAPDH was used as an internal control. (d) THAP11 protein expression in GC cell lines was analyzed by Western blot. GAPDH was used as an internal control. Data are shown as mean ± SEM. Student's t-test or one-way ANOVA was used. Compared with normal or GES-1, P < 0.05.
Figure 2
Figure 2
Effects of THAP11 overexpression on GC cell growth, cell cycle, and apoptosis in vitro. (a, b) MKN-45 cells were transfected with Ov-THAP11 or control vector. Expression of THAP11 was detected by qRT-PCR at 24 h after transfection and by Western blot at 48 h after transfection. GAPDH was used as an internal control. (c) MTT assay was used to detect the proliferation of MKN-45 cells at 24 h, 48 h, and 72 h after transfection, respectively. (d) After transfection, cell number was counted at 24 h, 48 h, and 72 h, respectively. (e) At 24 h after transfection, cell cycle was detected by flow cytometry. The graph shows the percentage of cells in each phase. (f) At 48 h after transfection, cell apoptosis was analyzed using the Annexin V-FITC apoptosis detection kit. The graph shows the early and late apoptosis. Data are shown as mean ± SEM. Compared with control, P < 0.05, Student's t-test.
Figure 3
Figure 3
Effects of THAP11 silencing on GC cell growth, cell cycle, and apoptosis in vitro. (a, b) MKN-45 cells were transfected with si-THAP11 or control (NC-siRNA). Expression of THAP11 was detected by qRT-PCR at 24 h after transfection and by Western blot at 48 h after transfection. GAPDH was used as an internal control. (c) After transfection, MTT assay was used to detect the proliferation of MKN-45 cells at 24 h, 48 h and 72 h, respectively. (d) After transfection, cell number was counted at 24 h, 48 h, and 72 h, respectively. (e) At 24 h after transfection, cell cycle after was detected by flow cytometry. The graph shows the percentage of cells in each phase. (f) At 48 h after transfection, cell apoptosis was analyzed using the Annexin V-FITC apoptosis detection kit. The graph shows the early and late apoptosis of cells. Data are shown as mean ± SEM. Compared with NC-siRNA, P < 0.05, Student's t-test.
Figure 4
Figure 4
Effects of THAP11 overexpression on c-Myc expression and regulated c-Myc target genes. (a) MKN-45 cells were transfected with control or ov-THAP11, and c-Myc mRNA level was analyzed by qRT-PCR at 24 h after transfection. (b) Expression of c-Myc, cyclinD1, p27, and p21 protein was detected by Western blot at 48 h after transfection and the relative expression of proteins was quantitatively analyzed. (c) MKN-45 cells were transfected with NC-siRNA or si-THAP11, and c-Myc mRNA level was analyzed by qRT-PCR at 24 h after transfection. (d) Expression of c-Myc, cyclinD1, p27, and p21 protein was detected by Western blot at 48 h after transfection, and the relative expression of proteins was quantitatively analyzed. GAPDH was used as an internal control. Data are shown as mean ± SEM. Compared with control, P < 0.05, Student's t-test.
Figure 5
Figure 5
Overexpression of c-Myc rescued THAP11-induced cell growth inhibition. MKN-45 cells were transfected with both ov-THAP11 and ov-c-Myc, single ov-THAP11 or control. (a) c-Myc mRNA level was analyzed by qRT-PCR at 24 h after transfection. (b) MTT assay was used to detect the proliferation of cells at 24 h, 48 h, and 72 h after transfection, respectively. (c) Cell number was counted at 24 h, 48 h, and 72 h, respectively. (d) Cell cycle after was detected by flow cytometry at 24 h after transfection. The graph shows the percentage of cells in each phase. (e) Cell apoptosis was analyzed using the Annexin V-FITC apoptosis detection kit at 48 h after transfection. The graph shows the early and late apoptosis of cells. GAPDH was used as an internal control. (f) Expressions in c-Myc and its target genes in transfected cells were analyzed by Western blot at 48 h after transfection. (g) The bar graph shows the results of relative quantitative analysis of protein expression. GAPDH was used as an internal control. Data are shown as mean ± SEM. Compared with control, P < 0.05; compared with ov-THAP11, #P < 0.05, one-way ANOVA.

Similar articles

Cited by

References

    1. Jemal A., Bray F., Center M. M., Ferlay J., Ward E., Forman D. Global cancer statistics. CA: a Cancer Journal for Clinicians. 2011;61(2):69–90. doi: 10.3322/caac.20107. - DOI - PubMed
    1. Karimi P., Islami F., Anandasabapathy S., Freedman N. D., Kamangar F. Gastric cancer: descriptive epidemiology, risk factors, screening, and prevention. Cancer Epidemiology, Biomarkers and Prevention. 2014;23(5):700–713. doi: 10.1158/1055-9965.EPI-13-1057. - DOI - PMC - PubMed
    1. Campagne S., Saurel O., Gervais V., Milon A. Structural determinants of specific DNA-recognition by the Thap zinc finger. Nucleic Acids Research. 2010;38(10):3466–3476. doi: 10.1093/nar/gkq053. - DOI - PMC - PubMed
    1. Sanghavi H. M., Mallajosyula S. S., Majumdar S. Classification of the human Thap protein family identifies an evolutionarily conserved coiled coil region. BMC Structural Biology. 2019;19(1):p. 4. doi: 10.1186/s12900-019-0102-2. - DOI - PMC - PubMed
    1. Balakrishnan M. P., Cilenti L., Mashak Z., Popat P., Alnemri E. S., Zervos A. S. Thap5 is a human cardiac-specific inhibitor of cell cycle that is cleaved by the proapoptotic Omi/Htra2 protease during cell death. American Journal of Physiology: Heart and Circulatory Physiology. 2009;297(2):H643–H653. doi: 10.1152/ajpheart.00234.2009. - DOI - PMC - PubMed

MeSH terms