[Preprint]. 2020 Sep 2:2020.09.01.278689.
doi: 10.1101/2020.09.01.278689.

Spike mutation D614G alters SARS-CoV-2 fitness and neutralization susceptibility

Affiliations

Spike mutation D614G alters SARS-CoV-2 fitness and neutralization susceptibility

Jessica A Plante et al. bioRxiv. .

Update in

  • Spike mutation D614G alters SARS-CoV-2 fitness.
    Plante JA, Liu Y, Liu J, Xia H, Johnson BA, Lokugamage KG, Zhang X, Muruato AE, Zou J, Fontes-Garfias CR, Mirchandani D, Scharton D, Bilello JP, Ku Z, An Z, Kalveram B, Freiberg AN, Menachery VD, Xie X, Plante KS, Weaver SC, Shi PY. Plante JA, et al. Nature. 2021 Apr;592(7852):116-121. doi: 10.1038/s41586-020-2895-3. Epub 2020 Oct 26. Nature. 2021. PMID: 33106671 Free PMC article.

Abstract

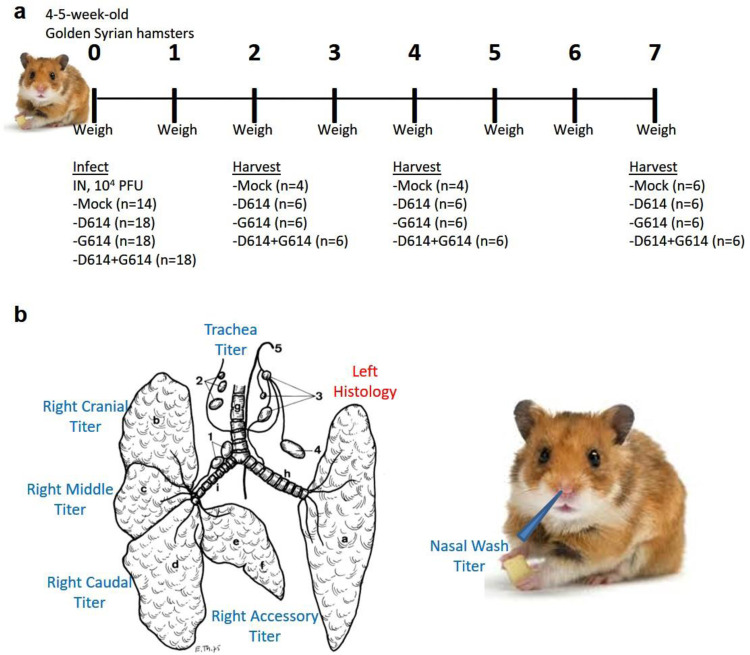
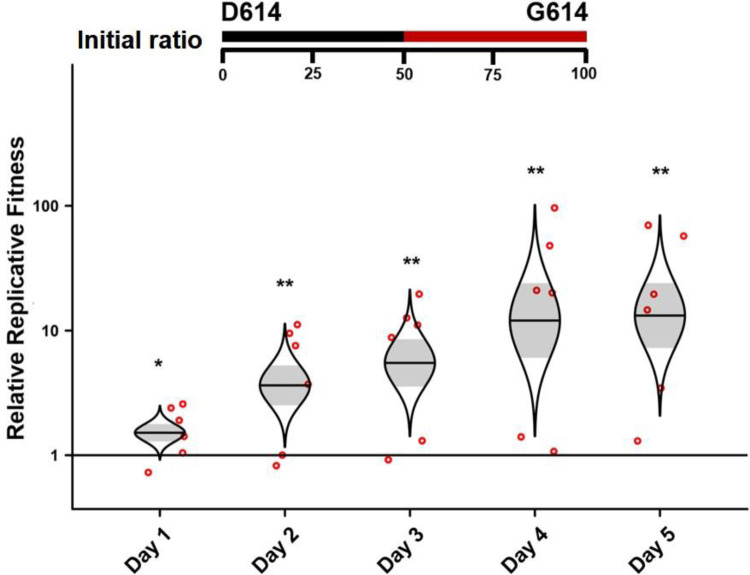
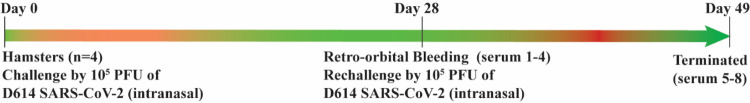
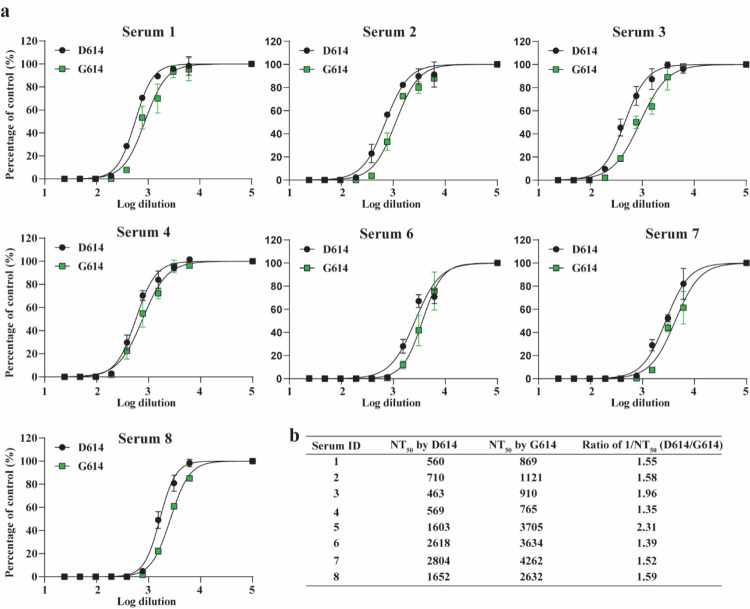
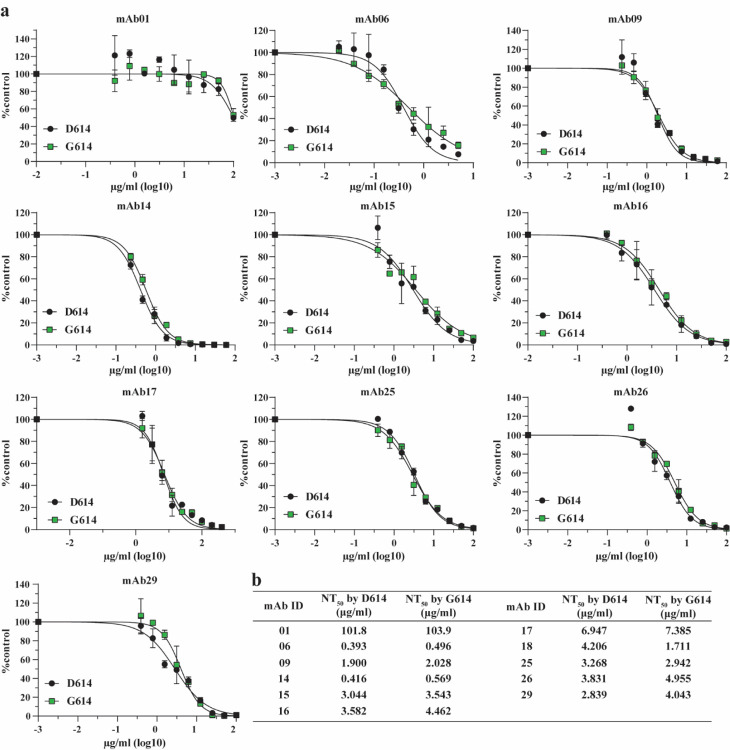
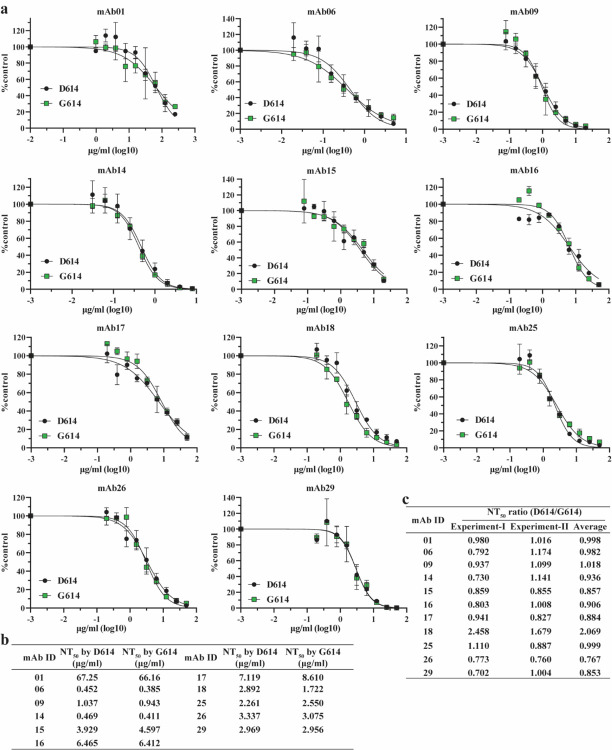
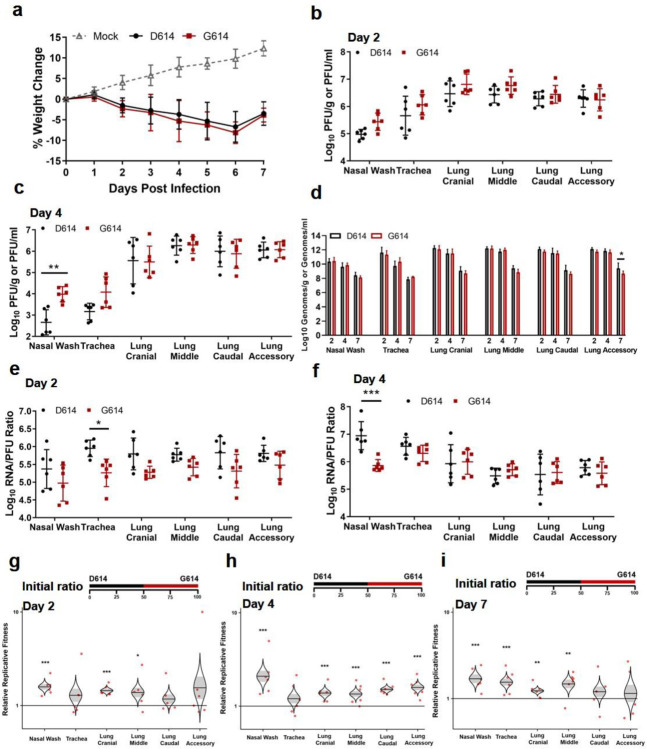
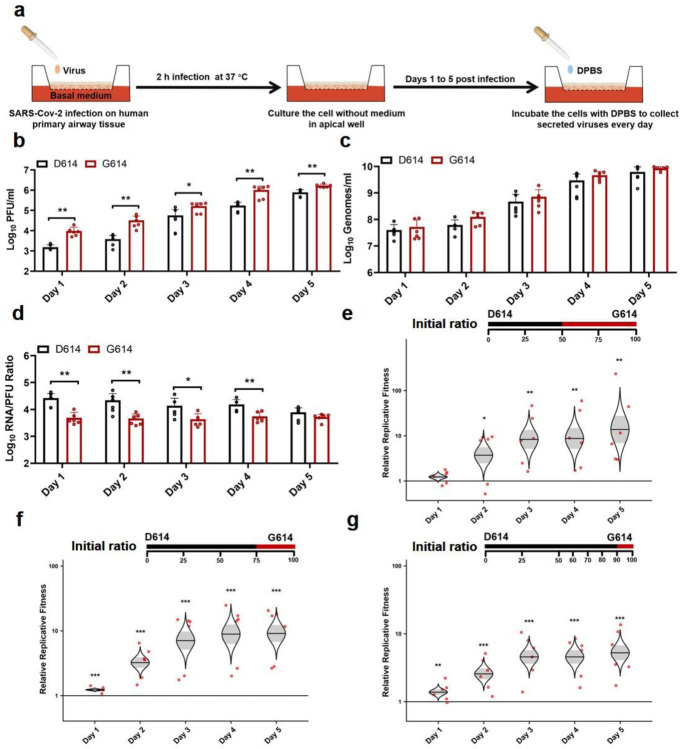
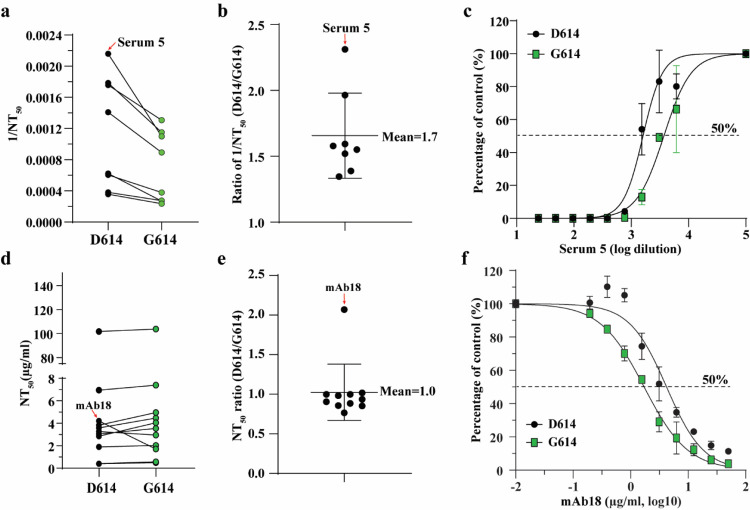
A spike protein mutation D614G became dominant in SARS-CoV-2 during the COVID-19 pandemic. However, the mutational impact on viral spread and vaccine efficacy remains to be defined. Here we engineer the D614G mutation in the SARS-CoV-2 USA-WA1/2020 strain and characterize its effect on viral replication, pathogenesis, and antibody neutralization. The D614G mutation significantly enhances SARS-CoV-2 replication on human lung epithelial cells and primary human airway tissues, through an improved infectivity of virions with the spike receptor-binding domain in an "up" conformation for binding to ACE2 receptor. Hamsters infected with D614 or G614 variants developed similar levels of weight loss. However, the G614 virus produced higher infectious titers in the nasal washes and trachea, but not lungs, than the D614 virus. The hamster results confirm clinical evidence that the D614G mutation enhances viral loads in the upper respiratory tract of COVID-19 patients and may increases transmission. For antibody neutralization, sera from D614 virus-infected hamsters consistently exhibit higher neutralization titers against G614 virus than those against D614 virus, indicating that (i) the mutation may not reduce the ability of vaccines in clinical trials to protect against COVID-19 and (ii) therapeutic antibodies should be tested against the circulating G614 virus before clinical development.


Conflict of interest statement

Competing financial interests X.X., V.D.M., and P.-Y.S. have filed a patent on the reverse genetic system and reporter SARS-CoV-2. Other authors declare no competing interests.

Figures

Extended Data Figure 1.
Extended Data Figure 1.. Experimental design of hamster infection and sample harvest.
(a) Graphical overview of experiment to assess the impact of G614 mutation on replication in the respiratory system of hamsters. (b) Schematic samples harvested on days 2, 4, and 7 post-infection. Illustration of hamster lung adapted from Reznik, G. et al. Clinical anatomy of the European hamster. Cricetus cricetus, L., For sale by the Supt of Docs, U.S. Govt. Print. Off., 1978.
Extended Data Figure 2.
Extended Data Figure 2.. D614G substitution significantly enhances SARS-CoV-2 replication in primary human airway tissues from a different donor.
D614 and G614 viruses were equally mixed and inoculated onto the airway tissue at a total MOI of 5. This airway tissue was produced from a different donor that was used in Figure 3. The tissues were washed by DPBS to collect the secreted viruses every day from days 1 to 5. The total RNAs were isolated and amplified by RT-PCR. The ratio of D614 and G614 viruses after competition were measure by Sanger sequencing and analyzed using R statistical software. The distribution of the model-adjusted means is illustrated by catseye plots with shaded +/− standard error (SD) overlaid by scatterplots of subject measures; scatterplots have been randomly jittered horizontally for clarity, and are shown on the log (base-10) scale such that comparisons are a null value of 1. *p < 0.05, ** p< 0.01.
Extended Data Figure 3.
Scheme for preparing the D614 SARS-CoV-2-infected hamster sera for neutralization assay. Eight sera were collected: Four sera (number 1–4) collected on day 28 post infection and another four sera (number 5–8) collected on day 49 after the second viral infection.
Extended Data Figure 4.
Construction of G614 mNeonGreen SARS-CoV-2. (a) Diagram of the construction. The D614G mutation was introduced into a mNeonGreen reporter SARS-CoV-2 using the method as described previously. (b) Plaque morphologies of D614 and G614 mNeonGreen SARS-CoV-2.
Extended Data Figure 5.
Neutralization activities of hamster sera against D614 and G614 mNeonGreen SARS-CoV-2. (a) Neutralizing curves of eight hamster sera against D614 and G614 mNeonGreen SARS-CoV-2. The neutralizing curve for serum 5 is shown in Fig. 4c. Experiments were performed in replicates. The mean and standard deviations are shown. (b) Calculated NT50 values and ratios of 1/NT50 for all eight hamster sera. The mean ratios were determined by (D614 1/NT50)/(G614 1/NT50).
Extended Data Figure 6.
Neutralization activities of human mAbs against D614 and G614 mNeonGreen SARS-CoV-2 in Experiment I. (a) Neutralizing curves of eleven mAbs against D614 and G614 reporter SARS-CoV-2. The neutralizing curve for mAb18 is shown in Fig. 4f. Experiments were performed in replicates. The mean and standard deviations are shown. (b) Calculated NT50 values for all eleven mAbs.
Extended Data Figure 7.
Neutralization activities of human mAbs against D614 and G614 mNeonGreen SARS-CoV-2 in Experiment II. (a) Neutralizing curves of eleven mAbs against D614 and G614 reporter SARS-CoV-2. Experiments were performed in replicates. The mean and standard deviations are shown. (b) Calculated NT50 values for all eleven mAbs. (c) Summary of NT50 ratios from two independent experiments. The ratios were determined by (D614 NT50)/(G614 NT50).
Figure 1.
Figure 1.. D614G substitution improves SARS-CoV-2 replication on Calu-3 cells through increased virion infectivity.
(a) Construction of mutant G614 SARS-CoV-2. A single nucleotide A-to-G substitution was introduced to construct the spike D614G mutation in the infectious cDNA clone of SARS-CoV-2. The nucleotide positions of the viral genome are annotated. (b) Plaque morphologies of D614 and G614 viruses. The plaques were developed on day 2 post infection on Vero E6 cells. (c-h) Viral replication and genomic RNA/PFU ratios of D614 and G614 viruses produced from Vero E6 cells (c-e) and from Calu-3 cells (f-h). Both cells were infected with viruses at an MOI of 0.01. Infectious viral titers (c,f) and genomic RNA levels (d,g) in culture medium were determined by plaque assay and real-time RT-qPCR, respectively. The genomic RNA/PFU ratios (e,h) were calculated to indicate virion infectivity. The detection limitation of the plaque assay is 40 PFU/ml. The results were pooled from two independent biological replicates. Data are presented with mean ± standard deviations. P values were determined by two-tailed Mann–Whitney test. * p<0.05, ** p<0.01. (i,j) Spike protein cleavages of purified virions. Purified D614 and G614 virions were analyzed by Western blot using polyclonal antibodies against spike and anti-nucleocapsid antibodies. Full-length spike (FL), S1/S2 cleavage form, and S2’ protein are annotated. Results from two independent experiments are presented for virions produced from Calu-3 cells (i) and Vero E6 cells (j).
Figure 2.
Figure 2.. D614G substitution increases SARS-CoV-2 replication in the upper airway, but not the lungs, of hamsters.
(a) Weight loss after infection with 2×10⁴ PFU of D614 or G614 SARS-CoV-2. Animals were also inoculated with PBS as a negative control. (b,c) Infectious titers in the nasal wash, trachea, and lung lobes on days 2 (b) and 4 (c) post infection. The infectious titers were quantified by plaque assay on Vero E6 cells. (d) Viral RNA levels on days 2, 4, and 7 post infection. The viral RNA levels were measured by RT-qPCR. (e,f) Viral RNA/PFU ratios on days 2 (e) and 4 (f) post infection. (g-i) Relative replicative fitness of D614 and G614 viruses on days 2 (g), 4 (h), and 7 (i) post infection. Data reflect 6 mice per infected cohort for each timepoint. For weight loss (a), symbols represent the mean. For infectious titers and viral RNA/PFU ratios (b,c,e,f), symbols represent individual animals and midlines represent the mean. For viral RNA levels (d), bar height represents the mean. For all graphs, error bars represent standard deviations. Weight loss (a) was analyzed by two-factor ANOVA with virus strain and timepoint as fixed factors, and a Tukey’s post-hoc test to compare all cohort pairs at a given timepoint. All other datasets (b-f) were analyzed by measures two-factor ANOVA with virus strain and tissue as fixed factors, and a Sidak’s post-hoc test to compare D614 versus G614 within a given tissue. For the competition assay (g-i), 100 μl mixtures of equal D614 and G614 viruses (104 PFU per virus) were inoculated intranasally into 4- to 5-week-old Syrian hamsters. The initial ratio of D614 and G614 viruses is 1:1. Organs of infected hamsters were collected on days 2 (g), 4 (h), and 7 (i) post infection and measured for the relative fitness of G614 virus over D614 virus using Sanger sequencing. The distribution of the model-adjusted means is illustrated by catseye plots with shaded +/− standard error overlaid by scatterplots of subject measures; scatterplots have been randomly jittered horizontally for clarity, and are shown on the log10 scale such that comparisons are a null value of 1. Reported p-values are based on the results of the respective post-hoc tests. * p<0.05, ** p<0.01, *** p<0.001.
Figure 3.
Figure 3.. D614G substitution significantly enhances SARS-CoV-2 replication in primary human airway tissues.
(a) Experimental scheme. D614 and G614 viruses were inoculated onto the primary human airway tissues. After incubation at 37°C for 2 h, the culture was washed with DPBS for three times to remove the un-attached virus. The culture was maintained at 37°C, 5% CO2 for 5 days. On each day, 300 μl DPBS was added onto the culture. After incubation at 37°C for 30 min, the DPBS containing the eluted viruses was subjected to plaque assay, real-time RT-qPCR, and competition analysis by Sanger sequencing. (b-d) Viral replication and genomic RNA/PFU ratios. Human airway tissues were infected with D614 or G614 virus at an MOI of 5. The amounts of infectious virus (b) and genomic RNA (c) were quantified by plaque assay and real-time RT-qPCR, respectively. The genomic RNA/PFU ratio (d) was calculated to indicate virion infectivity. The results were pooled from two independent biological replicates. Data are presented as means ± standard deviations. P values were determined by two-tailed Mann–Whitney test. (e,f) Competition assay. A mixture of D614 and G614 viruses with different initial ratios were inoculated onto the human airway tissues at a total MOI of 5. The initial D614/G614 virus ratio was 1:1 (e), 3:1(f), or 9:1(g). The G614/D614 ratios after competition were measure by Sanger sequencing and analyzed using R statistical software. The distribution of the model-adjusted means is illustrated by catseye plots with shaded +/− standard error (SD) overlaid by scatterplots of subject measures; scatterplots have been randomly jittered horizontally for clarity, and are shown on the log10 scale such that comparisons are a null value of 1. *p < 0.05, ** p< 0.01, *** p< 0.001.
Figure 4.
Figure 4.. D614G substitution affects the neutralization susceptibility of SARS-CoV-2 to neutralizing sera and mAbs.
(a) Neutralizing activities of hamster sera against D614 and G614 mNeonGreen reporter SARS-CoV-2. Eight sera from D614 virus-infected hamsters were tested for neutralizing titers against D614 and G614 reporter SARS-CoV-2. The 1/NT50 values for individual sera are plotted. (b) Ratio of 1/NT50 between D614 and G614 viruses. The mean of the ratios [ratio = (D614 1/NT50)/(G614 1/NT50)] from 8 hamster serum samples are shown. Error bar indicates the standard deviations. (c) Representative neutralizing curve of hamster serum 5. Dot line indicates 50% inhibition of viral infection. The means and standard deviations from two replicates are shown. (d) Neutralizing activities of eleven human mAbs against D614 and G614 mNeonGreen SARS-CoV-2. The data represents one of the two independent experiments. (c) Ratio of NT50 between D614 and G614 viruses. The averages of the NT50 ratios from two independent experiments performed in duplicates are shown. The mean and standard deviation from eleven mAbs are indicated. (f) Representative neutralizing curve of mAb18. Dotted line indicated 50% viral inhibition. The means and standard deviations from two replicates are shown.

Similar articles

Cited by

References

    1. Zhou P. et al. A pneumonia outbreak associated with a new coronavirus of probable bat origin. Nature 579, 270–273, doi:10.1038/s41586-020-2012-7 (2020). - DOI - PMC - PubMed
    1. Domingo P. et al. The four horsemen of a viral Apocalypse: The pathogenesis of SARS-CoV-2 infection (COVID-19). EBioMedicine 58, 102887, doi:10.1016/j.ebiom.2020.102887 (2020). - DOI - PMC - PubMed
    1. Smith E. C., Blanc H., Surdel M. C., Vignuzzi M. & Denison M. R. Coronaviruses lacking exoribonuclease activity are susceptible to lethal mutagenesis: evidence for proofreading and potential therapeutics. PLoS Pathog 9, e1003565, doi:10.1371/journal.ppat.1003565 (2013). - DOI - PMC - PubMed
    1. Fauver J. R. et al. Coast-to-Coast Spread of SARS-CoV-2 during the Early Epidemic in the United States. Cell 181, 990–996 e995, doi:10.1016/j.cell.2020.04.021 (2020). - DOI - PMC - PubMed
    1. Song H. D. et al. Cross-host evolution of severe acute respiratory syndrome coronavirus in palm civet and human. Proc Natl Acad Sci U S A 102, 2430–2435, doi:10.1073/pnas.0409608102 (2005). - DOI - PMC - PubMed

Publication types