[Preprint]. 2020 Sep 2:2020.08.29.20182899.
doi: 10.1101/2020.08.29.20182899.

Cytotoxic lymphocytes are dysregulated in multisystem inflammatory syndrome in children

Noam D Beckmann  1   2 Phillip H Comella  1   2   3 Esther Cheng  1   3 Lauren Lepow  4 Aviva G Beckmann  1 Konstantinos Mouskas  1 Nicole W Simons  1 Gabriel E Hoffman  1 Nancy J Francoeur  1   2 Diane Marie Del Valle  5 Gurpawan Kang  6 Emily Moya  1 Lillian Wilkins  1 Jessica Le Berichel  5 Christie Chang  7 Robert Marvin  7 Sharlene Calorossi  7 Alona Lansky  7 Laura Walker  7 Nancy Yi  7 Alex Yu  1 Matthew Hartnett  8 Melody Eaton  7 Sandra Hatem  5 Hajra Jamal  9 Alara Akyatan  10 Alexandra Tabachnikova  9 Lora E Liharska  1 Liam Cotter  1   3 Brian Fennessey  1 Akhil Vaid  1 Guillermo Barturen  11 Scott R Tyler  1 Hardik Shah  1 Ying-Chih Wang  1 Shwetha Hara Sridhar  1 Juan Soto  1   2 Swaroop Bose  1   2 Kent Madrid  1   2 Ethan Ellis  1   2 Elyze Merzier  1   2 Konstantinos Vlachos  1   2 Nataly Fishman  1   2 Manying Tin  1   2 Melissa Smith  1   2 Hui Xie  7   9 Manishkumar Patel  7   9 Kimberly Argueta  7   9 Jocelyn Harris  7   9 Neha Karekar  7   9 Craig Batchelor  7   9 Jose Lacunza  7   9 Mahlet Yishak  7   9 Kevin Tuballes  7   9 Leisha Scott  7   9 Arvind Kumar  3 Suraj Jaladanki  1 Ryan Thompson  1   2 Evan Clark  1 Bojan Losic  1 Mount Sinai COVID-19 Biobank TeamJun Zhu  8 Wenhui Wang  8 Andrew Kasarskis  8 Benjamin S Glicksberg  1 Girish Nadkarni  12   13   14   15 Dusan Bogunovic  1 Cordelia Elaiho  16 Sandeep Gangadharan  17 George Ofori-Amanfo  17 Kasey Alesso-Carra  17 Kenan Onel  1   17 Karen M Wilson  17 Carmen Argmann  1 Marta E Alarcón-Riquelme  1 Thomas U Marron  5   7 Adeeb Rahman  5   7   9   18 Seunghee Kim-Schulze  5   7   9   18 Sacha Gnjatic  5   7   9   18   19   20 Bruce D Gelb  1   17   21 Miriam Merad  5   7   9   18 Robert Sebra  1   2   22   23 Eric E Schadt  1   2   23 Alexander W Charney  1   2   4   12
Collaborators, Affiliations

Cytotoxic lymphocytes are dysregulated in multisystem inflammatory syndrome in children

Noam D Beckmann et al. medRxiv. .

Update in

  • Downregulation of exhausted cytotoxic T cells in gene expression networks of multisystem inflammatory syndrome in children.
    Beckmann ND, Comella PH, Cheng E, Lepow L, Beckmann AG, Tyler SR, Mouskas K, Simons NW, Hoffman GE, Francoeur NJ, Del Valle DM, Kang G, Do A, Moya E, Wilkins L, Le Berichel J, Chang C, Marvin R, Calorossi S, Lansky A, Walker L, Yi N, Yu A, Chung J, Hartnett M, Eaton M, Hatem S, Jamal H, Akyatan A, Tabachnikova A, Liharska LE, Cotter L, Fennessy B, Vaid A, Barturen G, Shah H, Wang YC, Sridhar SH, Soto J, Bose S, Madrid K, Ellis E, Merzier E, Vlachos K, Fishman N, Tin M, Smith M, Xie H, Patel M, Nie K, Argueta K, Harris J, Karekar N, Batchelor C, Lacunza J, Yishak M, Tuballes K, Scott I, Kumar A, Jaladanki S, Agashe C, Thompson R, Clark E, Losic B, Peters L; Mount Sinai COVID-19 Biobank Team; Roussos P, Zhu J, Wang W, Kasarskis A, Glicksberg BS, Nadkarni G, Bogunovic D, Elaiho C, Gangadharan S, Ofori-Amanfo G, Alesso-Carra K, Onel K, Wilson KM, Argmann C, Bunyavanich S, Alarcón-Riquelme ME, Marron TU, Rahman A, Kim-Schulze S, Gnjatic S, Gelb BD, Merad M, Sebra R, Schadt EE, Charney AW. Beckmann ND, et al. Nat Commun. 2021 Aug 11;12(1):4854. doi: 10.1038/s41467-021-24981-1. Nat Commun. 2021. PMID: 34381049 Free PMC article.

Abstract

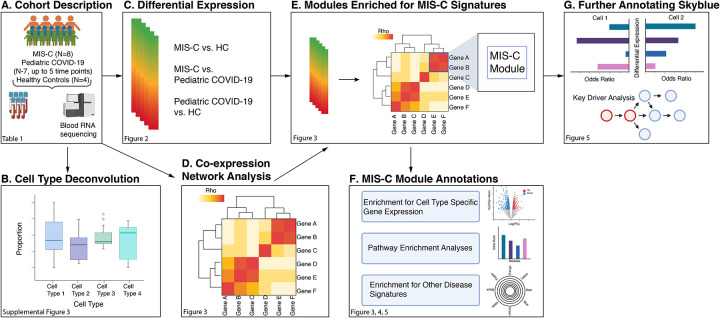
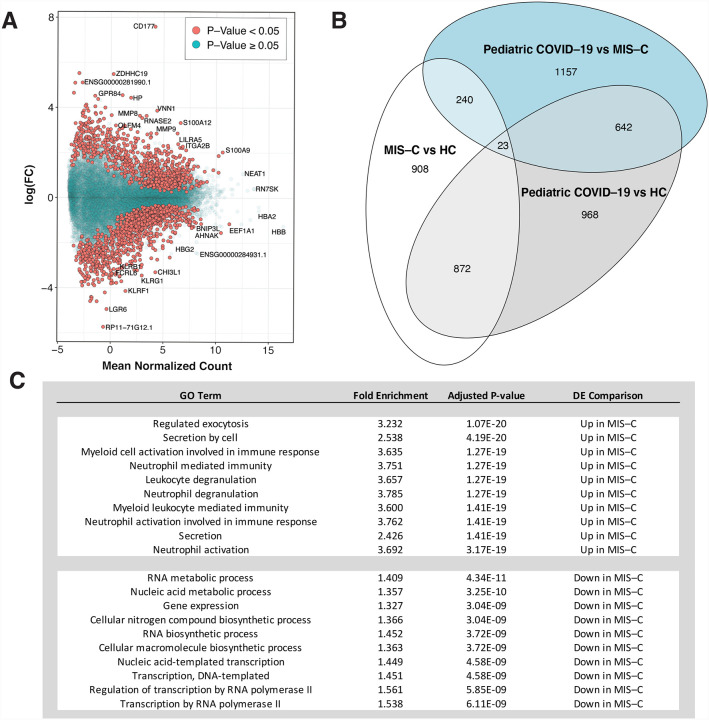
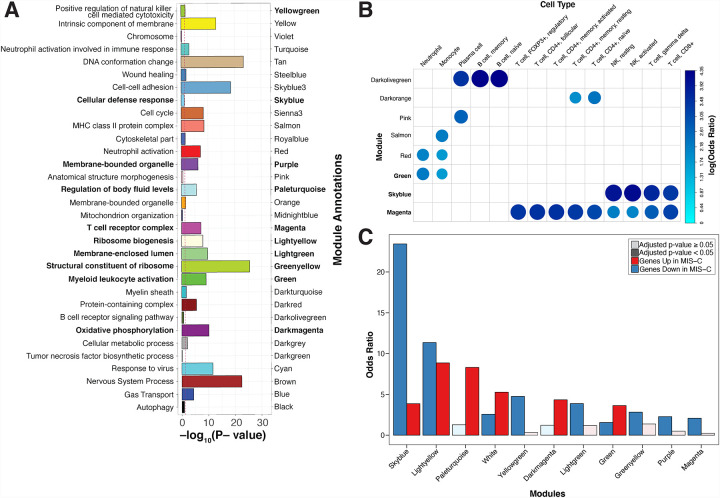
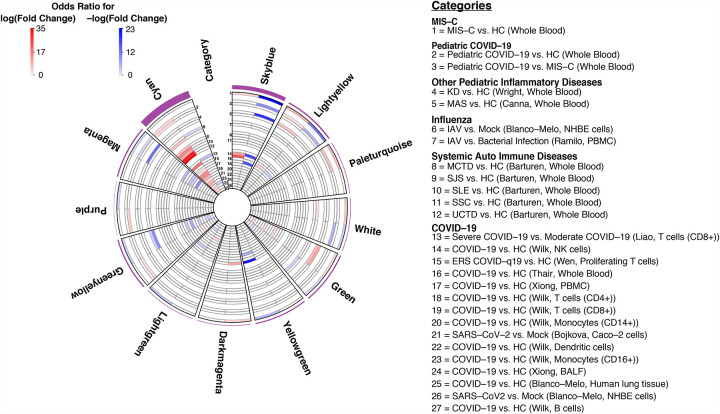
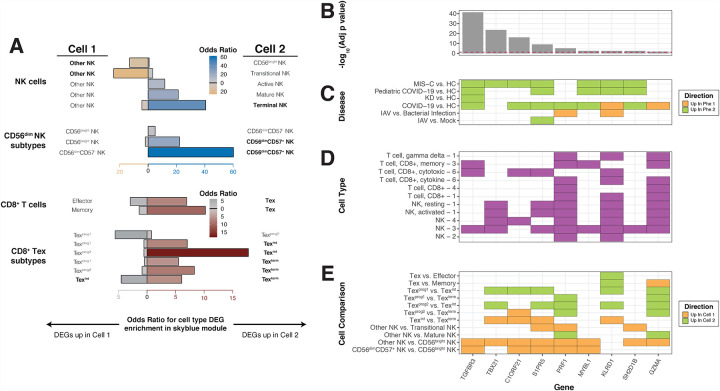
Multisystem inflammatory syndrome in children (MIS-C) presents with fever, inflammation and multiple organ involvement in individuals under 21 years following severe acute respiratory syndrome coronavirus 2 (SARS-CoV-2) infection. To identify genes, pathways and cell types driving MIS-C, we sequenced the blood transcriptomes of MIS-C cases, pediatric cases of coronavirus disease 2019, and healthy controls. We define a MIS-C transcriptional signature partially shared with the transcriptional response to SARS-CoV-2 infection and with the signature of Kawasaki disease, a clinically similar condition. By projecting the MIS-C signature onto a co-expression network, we identified disease gene modules and found genes downregulated in MIS-C clustered in a module enriched for the transcriptional signatures of exhausted CD8 + T-cells and CD56 dim CD57 + NK cells. Bayesian network analyses revealed nine key regulators of this module, including TBX21 , a central coordinator of exhausted CD8 + T-cell differentiation. Together, these findings suggest dysregulated cytotoxic lymphocyte response to SARS-Cov-2 infection in MIS-C.


Conflict of interest statement

Conflicts of interest statement

S.G. reports consultancy and/or advisory roles for Merck, Neon Therapeutics and OncoMed and research funding from Bristol-Myers Squibb, Genentech, Immune Design, Agenus, Janssen R&D, Pfizer, Takeda, and Regeneron.

Figures

Figure 1:
Figure 1:
Study Overview. Workflow of the analyses presented in the paper.
Figure 2:
Figure 2:
Differential expression analyses identify the transcriptional signature of MIS-C. A: Differential expression (DE) analyses for MIS-C patients versus HCs. The x-axis is the mean normalized count for each gene and the y-axis the log2(fold-change) for the differential expression. Positive and negative log2(fold change) represent genes upregulated and downregulated in MIS-C, respectively, and significance of association between gene expression and MIS-C status is indicated by the color of the dots as defined in the legend. B: Overlap of MIS-C and pediatric COVID-19 transcriptional signatures: Venn diagram of the overlap of genes across DE signatures. Each comparison is labeled on the plot. C: GO terms for MIS-C signature: GO term enrichment results for the top 10 upregulated and downregulated processes in MIS-C compared to HCs. Full DE results and pathway enrichments for all comparisons in B can be found in Data S4.
Figure 3:
Figure 3:
Co-expression network analysis identifies modules of genes dysregulated in MIS-C. A: Module GO term enrichments. The x-axis is the most significant GO term associated with each module, the y-axis is the −log10(adjusted p-value) for the enrichment. Bars are colored by module names, which are also specified for clarity. Only modules with an enrichment p-value < 1 are shown. The threshold for significance threshold, −log10(0.05), is indicated by the red dashed line. In bold lettering are the modules enriched for the MIS-C signature. B: Module cell type signature enrichments. The x-axis and y-axis are the names of the modules and of the cell type signatures, respectively. All signatures shown here are derived from the LM22 reference (Newman et al, Nature Methods, 2015). The color and size of the circles represents the log2(odds ratio) of the enrichments as defined in the legend. In bold are the modules enriched for the MIS-C signature. C: Modules enrichment for MIS-C signatures. The x-axis is the module names and the y-axis the odds ratio of the enrichment of the modules for the genes upregulated and downregulated in MIS-C. Only modules significantly enriched for MIS-C DEGs are shown. The color of the bars represent direction and the opacity represent the significance as defined in the legend. All module enrichments can be found in Data S2.
Figure 4:
Figure 4:
Disease enrichments in MIS-C modules and cyan. Slices are modules and each circular row represents the corresponding disease signature defined in the legend on the right. The purple outer rim of the plot represents the sum of the OR for all enrichments in that slice. Each slice is divided into two components that show the OR for enrichment of genes with +/−log(fold change) in the corresponding disease signature (red and blue respectively as defined in legend). Numbers in the category slice map the circular rows to disease signatures. OR are shown if disease signature enrichment adjusted p-value < 0.05. Diseases were grouped in biologically meaningful clusters as defined in the legend. Parenthesis in the legend refers to the source of the signature and the tissue or cell-type assessed. References for disease signatures are defined in the Supplementary Note and all enrichments can be found in Data S2.
Figure 5:
Figure 5:
Further dissection of skyblue implicates cytotoxic lymphocyte subtypes in MIS-C. A: Defining NK cell and CD8+ T-cell subtypes in skyblue. The x-axis represents the OR for the enrichment of skyblue for specific cytotoxic cell subtypes and the y-axis the signatures used. Cell one and cell two refer to the cell subtypes being compared to generate the DE signatures projected onto skyblue and the direction of the bar is shown towards the upregulated cell type in the comparison. The color and height of bars represent the OR of the enrichment test as defined by the x-axis and the legends. For NK cells, we used signatures from Yang, et al, Nature Communications, 2019 (labeled NK cells), and from Collins et al, Cell, 2019 (labeled CD56dim NK subtypes). For CD8+ T-cells, we used signatures from Wherry, et al, Immunity, 2007 (labeled CD8+ T-cells), and from Beltra et al, Immunity, 2020 (labeled CD8+ Tex subtypes). Detailed descriptions of the subtypes can be found in the Supplementary Note. B,C,D,E: Skyblue key drivers measures. These panels share their x-axis that represents the key driver genes. B: Key driver analysis results. The y-axis of this panel is the −log10(adjusted P-value) of key driver analysis. The red dashed line is the significance threshold at −log10(0.05). C: Related disease differential expression. In this panel, the y-axis is the disease name corresponding to Figure 4. The color represents the direction in the comparison as defined in the legend. D: Cell-type specific expression of key driver genes. The y-axis is the cell type signatures from the following references: 1= Newman et al, Nature Methods, 2015; 2= Park, et al, Science, 2020; 3=Wilk, et al, Nature Medicine, 2020; 4= Lial, et al, Nature Medicine, 2020; and 6= Szabo, Nature Communications, 2019. E: CD8+ T-cell and NK cell subtypes specific signatures. The y-axis is the cell-type name corresponding to Figure 5A and the color represents the direction in the comparison as defined in the legend.

Similar articles

Cited by

References

    1. Acharya D., Liu G., and Gack M.U. (2020). Dysregulation of type I interferon responses in COVID-19. Nat. Rev. Immunol. 20, 397–398. - PMC - PubMed
    1. American Academy of Pediatrics and the Children’s Hospital Association (2020). Children and COVID-19: State Data Report.
    1. Ashburner M., Ball C.A., Blake J.A., Botstein D., Butler H., Cherry J.M., Davis A.P., Dolinski K., Dwight S.S., Eppig J.T., et al. (2000). Gene ontology: tool for the unification of biology. The Gene Ontology Consortium. Nat. Genet. 25, 25–29. - PMC - PubMed
    1. Barturen G., Babaei S., Català-Moll F., Martínez-Bueno M., Makowska Z., Martorell-Marugán J., Carmona-Sáez P., Toro-Domníguez D., Carnero-Montoro E., Teruel M., et al. (2020). Integrative Analysis Reveals a Molecular Stratification of Systemic Autoimmune Diseases. medRxiv 2020.02.21.20021618. - PubMed
    1. Beltra J.-C., Manne S., Abdel-Hakeem M.S., Kurachi M., Giles J.R., Chen Z., Casella V., Ngiow S.F., Khan O., Huang Y.J., et al. (2020). Developmental Relationships of Four Exhausted CD8 T Cell Subsets Reveals Underlying Transcriptional and Epigenetic Landscape Control Mechanisms. Immunity 52, 825–841.e8. - PMC - PubMed

Publication types