

The JAK Inhibitor Tofacitinib Rescues Intestinal Barrier Defects Caused by Disrupted Epithelial-macrophage Interactions
- PMID: 32909045
- PMCID: PMC7944512
- DOI: 10.1093/ecco-jcc/jjaa182
The JAK Inhibitor Tofacitinib Rescues Intestinal Barrier Defects Caused by Disrupted Epithelial-macrophage Interactions
Abstract
Background and aims: Loss-of-function variants in protein tyrosine phosphatase non-receptor type-2 [PTPN2] promote susceptibility to inflammatory bowel diseases [IBD]. PTPN2 regulates Janus-kinase [JAK] and signal transducer and activator of transcription [STAT] signalling, while protecting the intestinal epithelium from inflammation-induced barrier disruption. The pan-JAK inhibitor tofacitinib is approved to treat ulcerative colitis, but its effects on intestinal epithelial cell-macrophage interactions and on barrier properties are unknown. We aimed to determine if tofacitinib can rescue disrupted epithelial-macrophage interaction and barrier function upon loss of PTPN2.
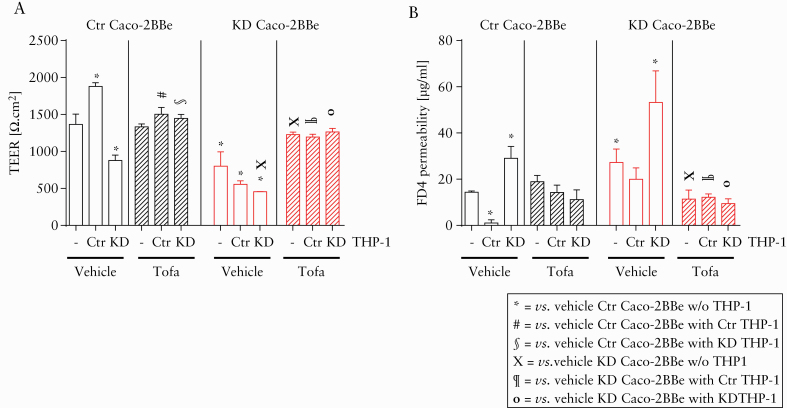
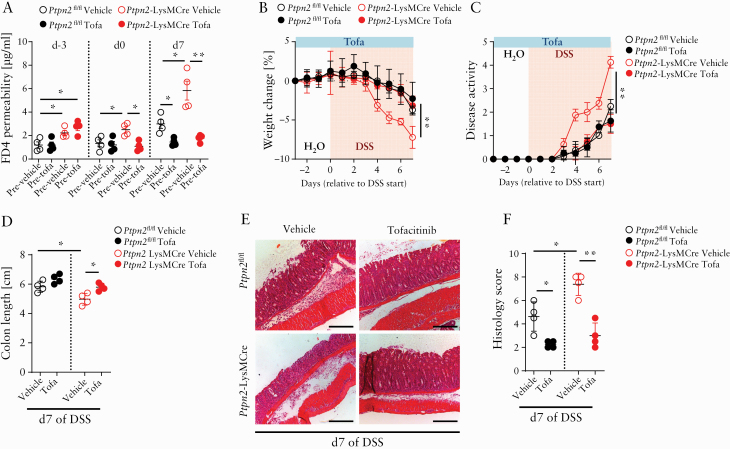
Methods: Human Caco-2BBe intestinal epithelial cells [IECs] and THP-1 macrophages expressing control or PTPN2-specific shRNA were co-cultured with tofacitinib or vehicle. Transepithelial electrical resistance and 4 kDa fluorescein-dextran flux were measured to assess barrier function. Ptpn2fl/fl and Ptpn2-LysMCre mice, which lack Ptpn2 in myeloid cells, were treated orally with tofacitinib citrate twice daily to assess the in vivo effect on the intestinal epithelial barrier. Colitis was induced via administration of 1.5% dextran sulphate sodium [DSS] in drinking water.
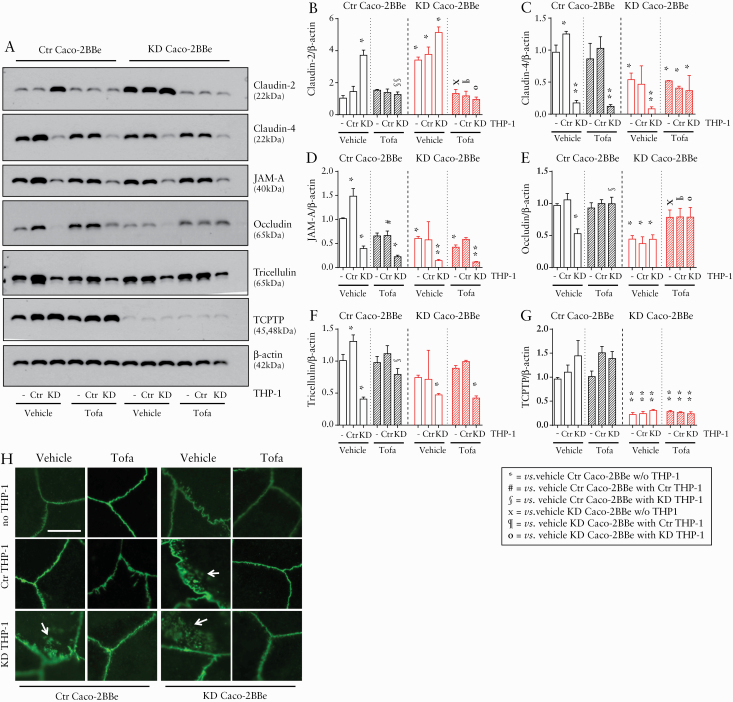
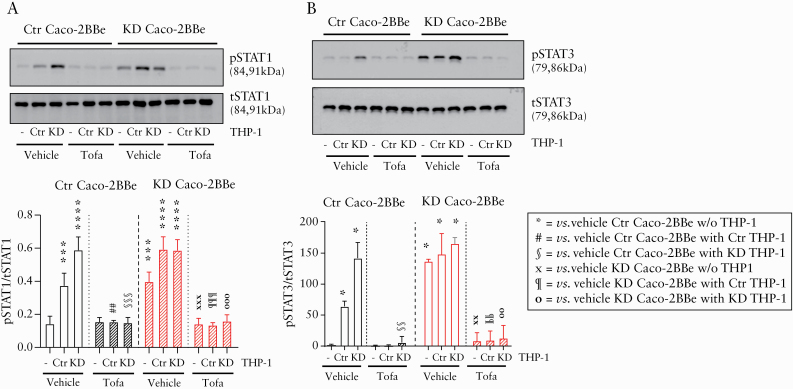
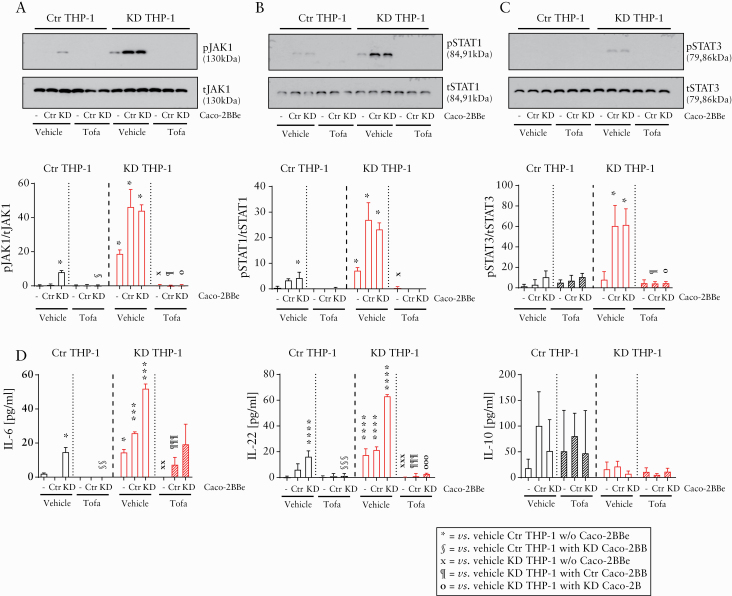
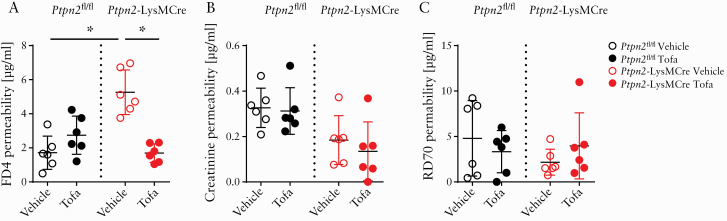
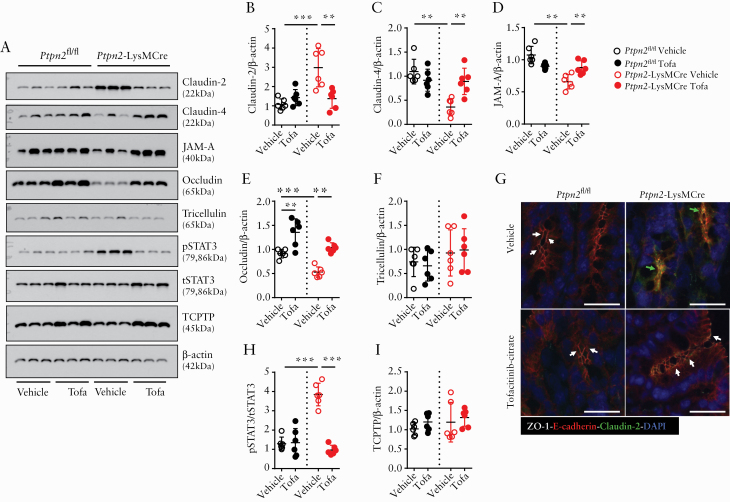
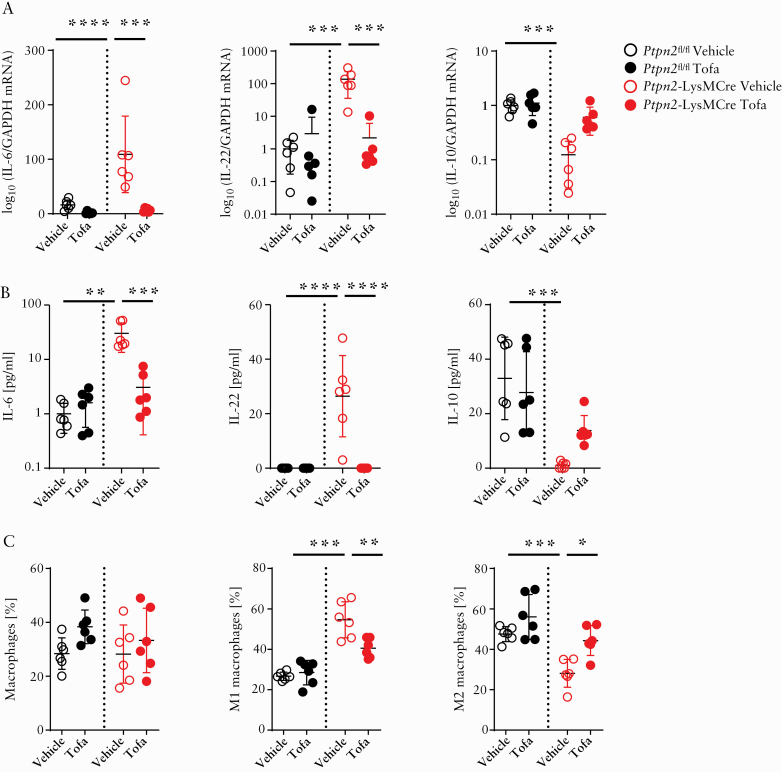
Results: Tofacitinib corrected compromised barrier function upon PTPN2 loss in macrophages and/or IECs via normalisation of: [i] tight junction protein expression; [ii] excessive STAT3 signalling; and [iii] IL-6 and IL-22 secretion. In Ptpn2-LysMCre mice, tofacitinib reduced colonic pro-inflammatory macrophages, corrected underlying permeability defects, and prevented the increased susceptibility to DSS colitis.
Conclusions: PTPN2 loss in IECs or macrophages compromises IEC-macrophage interactions and reduces epithelial barrier integrity. Both of these events were corrected by tofacitinib in vitro and in vivo. Tofacitinib may have greater therapeutic efficacy in IBD patients harbouring PTPN2 loss-of-function mutations.
Keywords: IBD; JAK-STAT; TCPTP; epithelial cells; macrophage; permeability; tight junction.
© The Author(s) 2020. Published by Oxford University Press on behalf of European Crohn’s and Colitis Organisation. All rights reserved. For permissions, please email: journals.permissions@oup.com.
Figures
Similar articles
-
PTPN2 Regulates Interactions Between Macrophages and Intestinal Epithelial Cells to Promote Intestinal Barrier Function.Gastroenterology. 2020 Nov;159(5):1763-1777.e14. doi: 10.1053/j.gastro.2020.07.004. Epub 2020 Jul 9. Gastroenterology. 2020. PMID: 32652144 Free PMC article.
-
The JAK-Inhibitor Tofacitinib Rescues Human Intestinal Epithelial Cells and Colonoids from Cytokine-Induced Barrier Dysfunction.Inflamm Bowel Dis. 2020 Feb 11;26(3):407-422. doi: 10.1093/ibd/izz266. Inflamm Bowel Dis. 2020. PMID: 31751457 Free PMC article.
-
The PTPN2 rs1893217 IBD risk allele increases susceptibility to AIEC invasion by a JAK-STAT-CEACAM6 axis.Gut Microbes. 2025 Dec;17(1):2526136. doi: 10.1080/19490976.2025.2526136. Epub 2025 Jul 7. Gut Microbes. 2025. PMID: 40624731 Free PMC article.
-
Therapeutic inhibition of the JAK-STAT pathway in the treatment of inflammatory bowel disease.Cytokine Growth Factor Rev. 2024 Oct;79:1-15. doi: 10.1016/j.cytogfr.2024.07.008. Epub 2024 Aug 3. Cytokine Growth Factor Rev. 2024. PMID: 39179485 Review.
-
Protein tyrosine phosphatase non-receptor type 2 and inflammatory bowel disease.World J Gastroenterol. 2016 Jan 21;22(3):1034-44. doi: 10.3748/wjg.v22.i3.1034. World J Gastroenterol. 2016. PMID: 26811645 Free PMC article. Review.
Cited by
-
Human TFF2-Fc fusion protein alleviates DSS-induced ulcerative colitis in C57BL/6 mice by promoting intestinal epithelial cells repair and inhibiting macrophage inflammation.Inflammopharmacology. 2023 Jun;31(3):1387-1404. doi: 10.1007/s10787-023-01226-9. Epub 2023 May 2. Inflammopharmacology. 2023. PMID: 37129719 Free PMC article.
-
Ulcerative colitis: molecular insights and intervention therapy.Mol Biomed. 2024 Oct 10;5(1):42. doi: 10.1186/s43556-024-00207-w. Mol Biomed. 2024. PMID: 39384730 Free PMC article. Review.
-
Gut-Brain Axis and Neuroinflammation: The Role of Gut Permeability and the Kynurenine Pathway in Neurological Disorders.Cell Mol Neurobiol. 2024 Oct 8;44(1):64. doi: 10.1007/s10571-024-01496-z. Cell Mol Neurobiol. 2024. PMID: 39377830 Free PMC article. Review.
-
Macrophage orchestration of epithelial and stromal cell homeostasis in the intestine.J Leukoc Biol. 2022 Aug;112(2):313-331. doi: 10.1002/JLB.3RU0322-176R. Epub 2022 May 20. J Leukoc Biol. 2022. PMID: 35593111 Free PMC article. Review.
-
Protein tyrosine phosphatase non-receptor type 2 as the therapeutic target of atherosclerotic diseases: past, present and future.Front Pharmacol. 2023 Aug 21;14:1219690. doi: 10.3389/fphar.2023.1219690. eCollection 2023. Front Pharmacol. 2023. PMID: 37670950 Free PMC article. Review.
References
-
- Adams SM, Bornemann PH. Ulcerative colitis. Am Fam Physician 2013;87:699–705. - PubMed
-
- Ordás I, Eckmann L, Talamini M, Baumgart DC, Sandborn WJ. Ulcerative colitis. Lancet 2012;380:1606–19. - PubMed
-
- Baumgart DC, Sandborn WJ. Crohn’s disease. Lancet 2012;380:1590–605. - PubMed
-
- Danese S, Fiorino G, Peyrin-Biroulet L, et al. Biological agents for moderately to severely active ulcerative colitis: a systematic review and network meta-analysis. Ann Intern Med 2014;160:704–11. - PubMed
MeSH terms
Substances
Grants and funding
LinkOut - more resources
Full Text Sources
Research Materials
Miscellaneous
