. 2020 Oct;21(5):425-444.
doi: 10.1007/s10162-020-00764-1. Epub 2020 Sep 9.

Correlating Cochlear Morphometrics from Parnell's Mustached Bat (Pteronotus parnellii) with Hearing

Affiliations

Correlating Cochlear Morphometrics from Parnell's Mustached Bat (Pteronotus parnellii) with Hearing

Cassandra D Girdlestone et al. J Assoc Res Otolaryngol. 2020 Oct.

Abstract

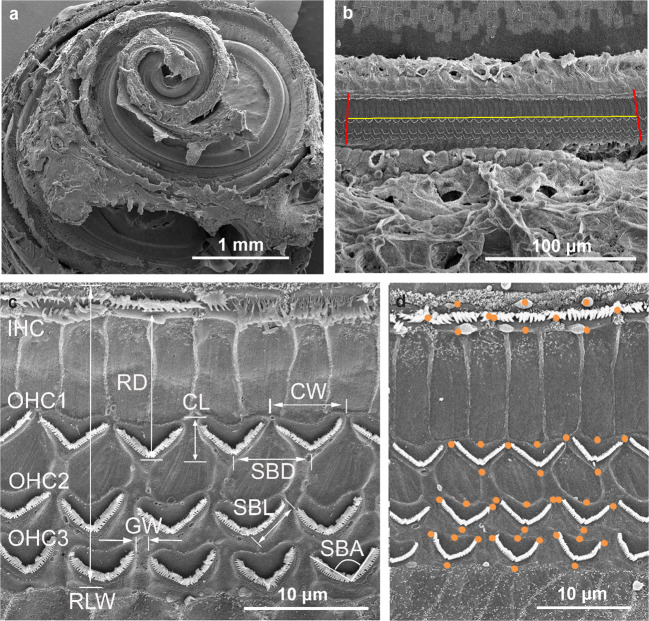
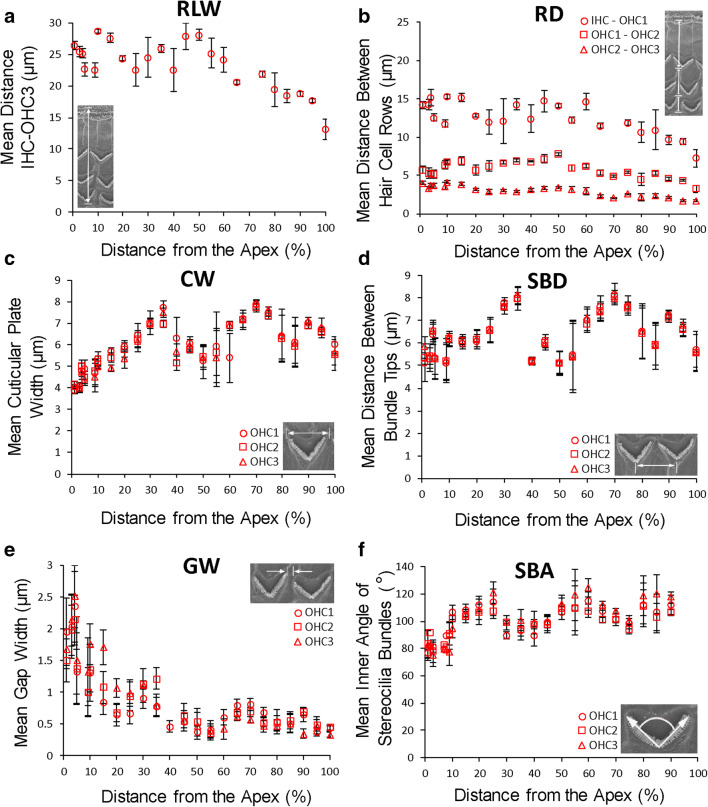
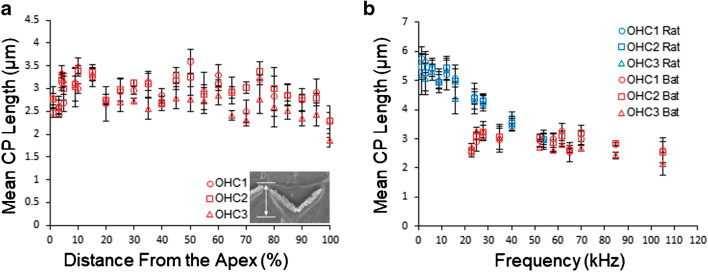
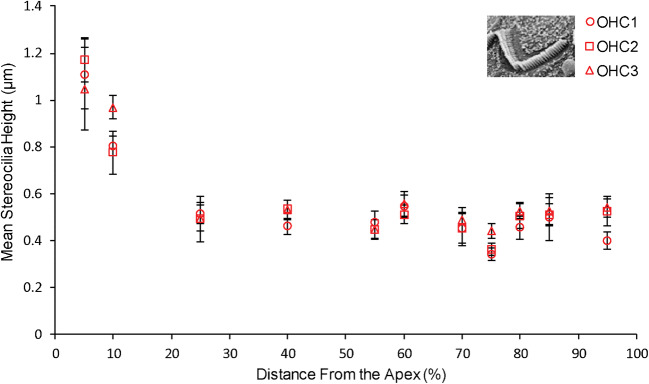
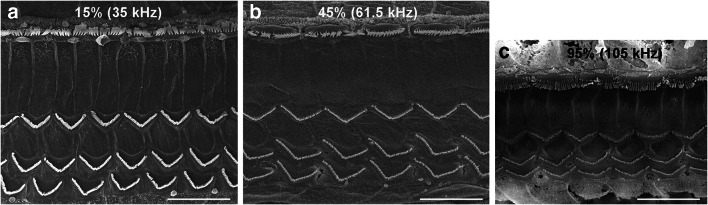
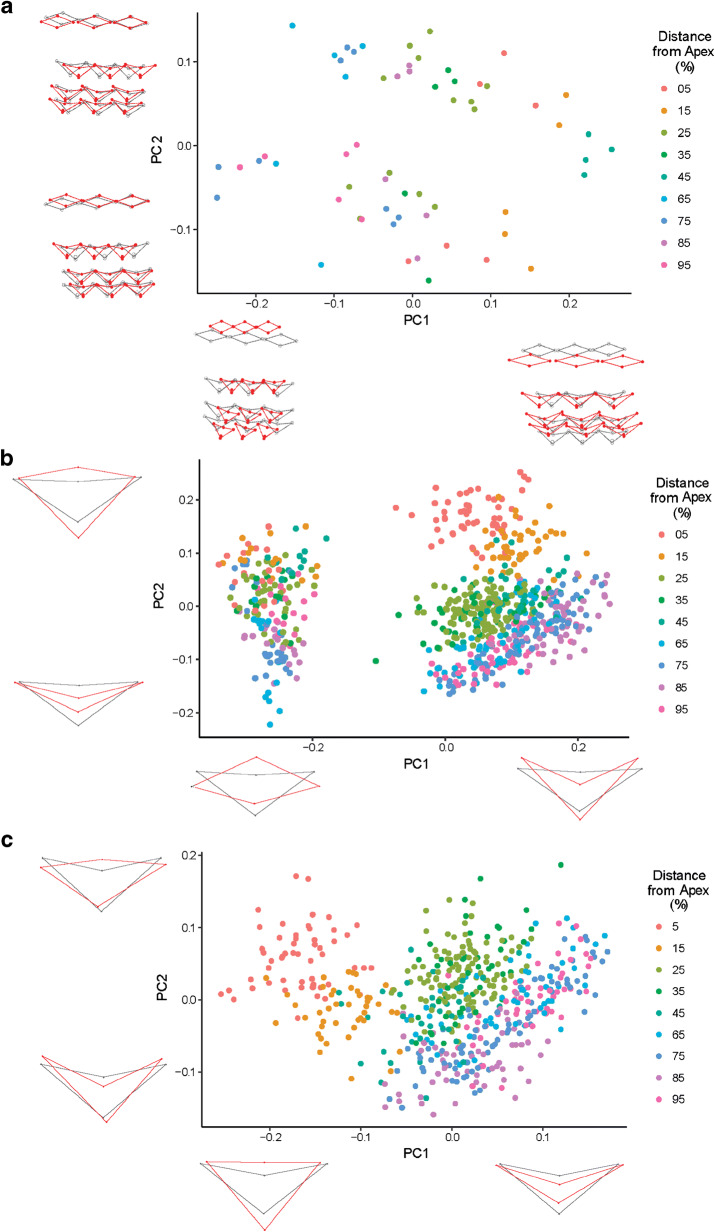
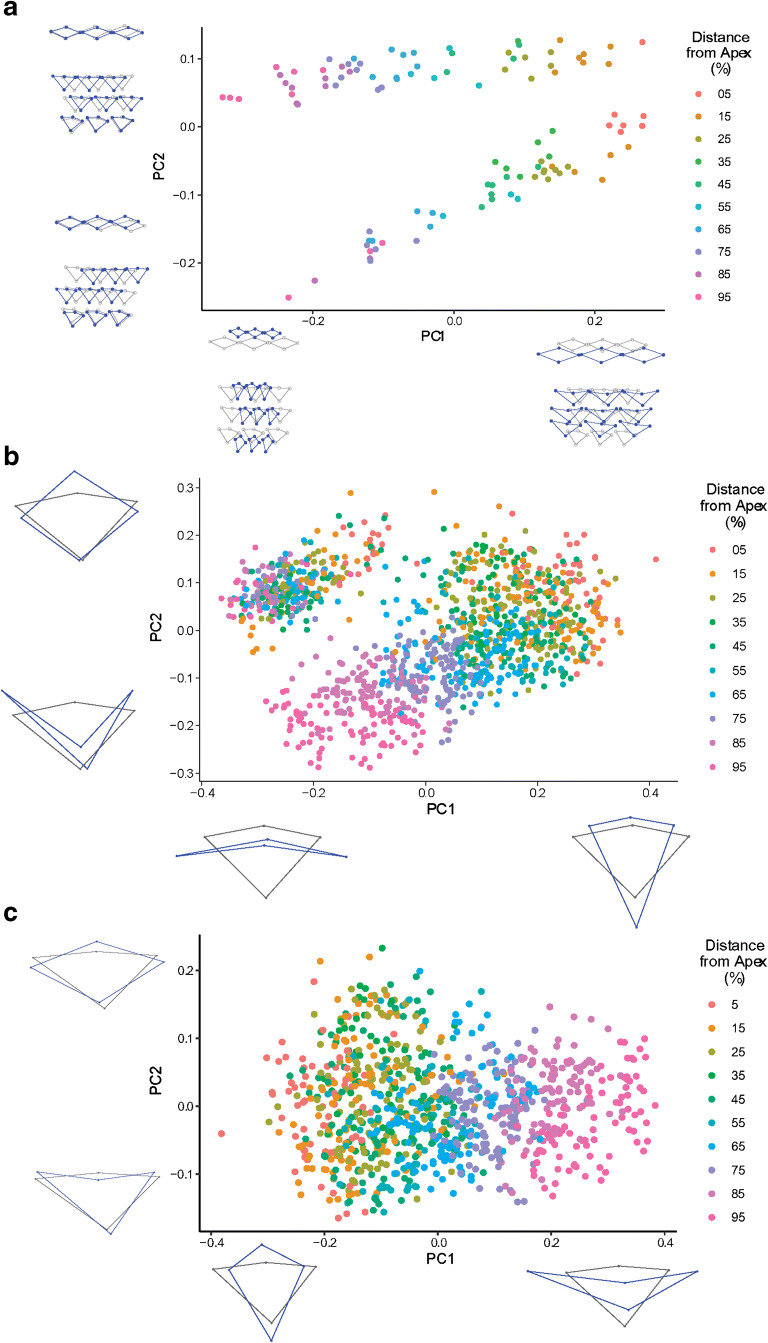
Morphometric analysis of the inner ear of mammals can provide information for cochlear frequency mapping, a species-specific designation of locations in the cochlea at which different sound frequencies are encoded. Morphometric variation occurs in the hair cells of the organ of Corti along the cochlea, with the base encoding the highest frequency sounds and the apex encoding the lowest frequencies. Changes in cell shape and spacing can yield additional information about the biophysical basis of cochlear tuning mechanisms. Here, we investigate how morphometric analysis of hair cells in mammals can be used to predict the relationship between frequency and cochlear location. We used linear and geometric morphometrics to analyze scanning electron micrographs of the hair cells of the cochleae in Parnell's mustached bat (Pteronotus parnellii) and Wistar rat (Rattus norvegicus) and determined a relationship between cochlear morphometrics and their frequency map. Sixteen of twenty-two of the morphometric parameters analyzed showed a significant change along the cochlea, including the distance between the rows of hair cells, outer hair cell width, and gap width between hair cells. A multiple linear regression model revealed that nine of these parameters are responsible for 86.9 % of the variation in these morphometric data. Determining the most biologically relevant measurements related to frequency detection can give us a greater understanding of the essential biomechanical characteristics for frequency selectivity during sound transduction in a diversity of animals.

Keywords: frequency map; geometric morphometrics; inner ear; linear morphometrics; organ of Corti.


Conflict of interest statement

The authors declare that they have no conflict of interest.

Figures

Fig. 1
Fig. 1
Scanning electron micrographs of the cochlea and the organ of Corti of Parnell’s mustached bat. a Parnell’s mustached bat cochlea. b Surface of the organ of Corti showing the measurements made in each consecutive image to calculate the cochlear length. c Surface of the organ of Corti in a bat cochlea, showing the typical arrangement of the hair cells. Visible here is the single row of inner hair cells (IHC) as well as the three parallel rows of outer hair cells (OHC1, OHC2, and OHC3). Measurements shown are the parameters analyzed: (RLW) distance from inner hair cells to the third row of outer hair cells (width of the reticular lamina), (RD) distance between the rows of hair cells, (CL) cuticular plate length of the outer hair cells, (CW) cuticular plate width of the outer hair cells, (SBD) distance between the stereociliary bundle tips, (GW) gap width between outer hair cells, (SBL) stereociliary bundle side arm length, and (SBA) inner angle of the stereociliary bundles of the outer hair cells (Table 1). d The landmarks used for the geometric morphometric analysis are shown as orange dots to demarcate the shape of the hair cells
Fig. 2
Fig. 2
Six out of the eight parameters measured (Fig. 1c) that showed the greatest change from apex to base. All panels show the given parameter (mean measurement ± standard deviation) corresponding to the percent distance from the apex, along the cochlear length in Parnell’s mustached bat (n = 6). Panels (c) through (f) were measured from the outer hair cells only. a Parameter RLW—the distance between the inner hair cells (IHCs) to the third row of outer hair cells (OHC3) (p = < 0.0001). b Parameter RD—the distance between each row of hair cells (IHC–OHC1 p = < 0.0001; OHC1–OHC2 p = < 0.0001; OHC2–OHC3 p = < 0.0001). c Parameter CW—width of the hair cell cuticular plate (CW1 p = < 0.0001; CW2 p = < 0.0001; CW3 p = < 0.0001). d Parameter SBD—the distance between stereociliary bundle tips (SBD1 p = 0.5934; SBD2 p = 0.9231; SBD3 p = 0.6432). e Parameter GW—the gap width between stereociliary bundles (GW1 p = < 0.0001; GW2 p = < 0.0001; GW3 p = < 0.0001). f Parameter SBA—the inner angle of the stereociliary bundles (SBA1 p = < 0.0001; SBA2 p = < 0.0001; SBA3 p = < 0.0001)
Fig. 3
Fig. 3
Data from parameter cell length (Fig. 1c) showing the change from apex to base. Both panels show parameter cell length (CL) (mean measurement ± standard deviation) measured from the outer hair cells only. a Corresponding to the percent distance from the apex, along the cochlear length in Parnell’s mustached bat (CL1 p = < 0.0006; CL2 p = < 0.0001; CL3 p = < 0.0001) (n = 6). b These data corresponding to the frequency detected (kHz), from Parnell’s mustached bat (n = 6) and rat (n = 4), for six out of the eight parameters measured (Fig. 1c) along the cochlear length plotted together
Fig. 4
Fig. 4
The mean stereocilia heights (± standard deviation) in each row of outer hair cells (OHC1, OHC2, and OHC3) in Parnell’s mustached bat (n = 6). These heights were statistically different compared between the apex and the base (p = < 0.0001 for all three rows)
Fig. 5
Fig. 5
Data from Parnell’s mustached bat (n = 6) and rat (n = 4), for one of the parameters measured along the cochlear length and plotted together versus distance (%) and again versus frequency (kHz). The parameter shown is RLW—the distance between the inner hair cells (IHCs) to the third row of outer hair cells (OHC3) (mean measurement ± standard deviation). a The parameter corresponding to distance from the apex (%) along the cochlear length. b The same parameter corresponding to the frequency detected (kHz). In both panels, the following coding is used: mustached bat (red) and rat (blue)
Fig. 6
Fig. 6
Data from Parnell’s mustached bat (n = 6) and rat (n = 4), for six out of the eight parameters measured (Fig. 1c) along the cochlear length plotted together. All panels show the given parameter (mean measurement ± standard deviation) corresponding to the frequency detected (kHz). Panels (c) through (f) were measured from the outer hair cells only. a Parameter RLW—the distance between the inner hair cells (IHCs) to the third row of outer hair cells (OHC3). b Parameter RD—the distance between each row of hair cells. c Parameter CW—width of the hair cell cuticular plate. d Parameter SBD—the distance between stereociliary bundle tips. e Parameter GW—the gap width between stereociliary bundles. f Parameter SBA—the inner angle of the stereociliary bundles. For panels (d) through (f), the legend is the same as that in panel (c)
Fig. 7
Fig. 7
The parameters that explained the majority of the variation. The nine variables that explained 86.9 % of the variation related to frequency sensitivity combining the data from Parnell’s mustached bat (n = 6) and rats (n = 4)
Fig. 8
Fig. 8
The variation in hair cells. Scanning electron micrographs from three of the ten locations (showing hair cells from 15, 45, and 95% distance from the apex) for which geometric morphometrics were analyzed along the organ of Corti of Parnell’s mustached bat. Frequencies were extracted from the cochlear frequency map of the mustached bat (Kössl and Vater 1985). Scale bars = 10 μm
Fig. 9
Fig. 9
Principal component analysis (PCA) results from the geometric morphometric measurements of Parnell’s mustached bat. a Analysis of the blocks of inner hair cells (IHCs) and outer hair cells (OHCs) examined together as a block of twelve cells in total (3 IHCs and 9 OHCs). b Analysis of the inner hair cells separated from and compared with the outer hair cells. c Analysis of only the outer hair cells (n = 6). Wireframes adjacent to the axes in all panels represent the shape changes of the hair cells. The gray shapes represent the average shape after the Procrustes fit (i.e., due to position, orientation, and scale removed), while the red shapes represent the average shape of the hair cells due to each principal component
Fig. 10
Fig. 10
Principal component one as a function of frequency (kHz) and a linear regression of frequency versus variation in hair cell shape using geometric morphometric measurements from Parnell’s mustached bat. a Principal component one (PC1) as a function of frequency showing the variation in outer hair cell shape corresponding to locations from 5 to 95 % distance from the apex. b Regression results of frequency versus inner and outer hair cell shape (Procrustes), averaged by individual and location (% distance from the apex) (n = 6)
Fig. 11
Fig. 11
Principal component analysis (PCA) results from the geometric morphometric measurements from the rat. a Analysis of the blocks of inner hair cells (IHCs) and outer hair cells (OHCs) analyzed together as a block of twelve cells in total (3 IHCs and 9 OHCs). b Analysis of the inner hair cells separated from and compared with the outer hair cells. c Analysis of only the outer hair cells (n = 4). Wireframes adjacent to the axes in all panels represent the shape changes of the hair cells. The gray shapes represent the average shape after the Procrustes fit (i.e., due to position, orientation, and scale removed), while the blue shapes represent the average shape of the hair cells due to each principal component

Similar articles

Cited by

References

    1. Adams DC, Collyer ML, Kaliontzopoulou A (2018) Geomorph: software for geometric morphometric analyses. R package version 3.0.6
    1. Barton K (2019) Multi-modal inference - R Package ‘MuMIn.’ R Packag. version 1
    1. Bruns V. Peripheral auditory tuning for fine frequency analysis by the CF-FM bat, Rhinolophus ferrumequinum - I Mechanical specializations of the cochlea. J Comp Physiol A. 1976;106:77–86. doi: 10.1007/BF00606573. - DOI
    1. Burnhan KP, Anderson DR. Model selection and multimodel inference. New York: Springer; 2002.
    1. Ciganović N, Wolde-Kidan A, Reichenbach T. Hair bundles of cochlear outer hair cells are shaped to minimize their fluid-dynamic resistance. Sci Rep. 2017;7:1–9. doi: 10.1038/s41598-017-03773-y. - DOI - PMC - PubMed

Publication types

LinkOut - more resources