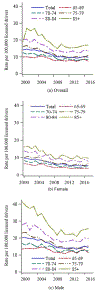
Older Driver Crash Involvement and Fatalities, by Age and Sex, 2000-2017
- PMID: 32909516
- PMCID: PMC7943652
- DOI: 10.1177/0733464820956507
Older Driver Crash Involvement and Fatalities, by Age and Sex, 2000-2017
Abstract
Federal reporting of crash fatalities has limited age-by-sex stratification, but both age and sex are associated with driving reduction and cessation. We described older driver fatal crash involvement and fatalities using Fatality Analysis Reporting System data to calculate rates (per 100,000 licensed drivers, per 100,000 population) with age-by-sex stratifications. Nationally from 2000 through 2017, 110,422 drivers 65+ were involved in crashes resulting in at least one death within 30 days, and 67,843 of these older drivers died. Involvement and fatality rates per 100,000 licensed drivers in 2017 were lowest for females 65-69 (7.7 and 3.6, respectively) and highest for males age 85+ (34.3 and 25.5, respectively). Females had lower driver fatal crash involvement and fatality rates throughout the lifespan, even when rates generally decreased over time. Elaborating fatal crash trends and rates by age and sex helps to differentiate the public health burden of older driver crashes and fatalities.
Keywords: FARS; crash involvement; driver fatality rates; motor vehicle fatality; trend.
Conflict of interest statement
Figures


Similar articles
-
Age-related differences in fatal intersection crashes in the United States.Accid Anal Prev. 2017 Feb;99(Pt A):20-29. doi: 10.1016/j.aap.2016.10.030. Epub 2016 Nov 14. Accid Anal Prev. 2017. PMID: 27855312
-
Trends in older driver crash involvement rates and survivability in the United States: an update.Accid Anal Prev. 2014 Nov;72:44-54. doi: 10.1016/j.aap.2014.06.011. Epub 2014 Jul 5. Accid Anal Prev. 2014. PMID: 25003969
-
Continued trends in older driver crash involvement rates in the United States: Data through 2017-2018.J Safety Res. 2021 Jun;77:288-295. doi: 10.1016/j.jsr.2021.03.013. Epub 2021 Apr 2. J Safety Res. 2021. PMID: 34092320
-
Motor Vehicle Safety - Has Technology and Legislation Made a Difference?Curr Trauma Rep. 2025;11(1):10. doi: 10.1007/s40719-025-00282-6. Epub 2025 Apr 8. Curr Trauma Rep. 2025. PMID: 40212393 Free PMC article. Review.
-
Formula One: a 'crash' course in motorsports medicine.Trauma Surg Acute Care Open. 2024 Apr 15;9(Suppl 2):e001402. doi: 10.1136/tsaco-2024-001402. eCollection 2024. Trauma Surg Acute Care Open. 2024. PMID: 38646031 Free PMC article. Review. No abstract available.
Cited by
-
Addressing the Complex Driving Needs of an Aging Population.JAMA. 2023 Sep 26;330(12):1187-1188. doi: 10.1001/jama.2023.16093. JAMA. 2023. PMID: 37656444 Free PMC article.
-
Driving ability and predictors for driving performance in Multiple Sclerosis: A systematic review.Front Neurol. 2022 Nov 30;13:1056411. doi: 10.3389/fneur.2022.1056411. eCollection 2022. Front Neurol. 2022. PMID: 36530634 Free PMC article.
References
-
- Colby SL, & Ortman JM (2015). Projections of the size and composition of the U.S. population: 2014 to 2060 (P25–1143). https://www.census.gov/content/dam/Census/library/publications/2015/demo...
Publication types
MeSH terms
Grants and funding
LinkOut - more resources
Full Text Sources

