Clinical Trial
. 2021 Mar;73(3):459-471.
doi: 10.1002/art.41518. Epub 2021 Feb 15.

Modulation of Cardiometabolic Disease Markers by Type I Interferon Inhibition in Systemic Lupus Erythematosus

Affiliations
Clinical Trial

Modulation of Cardiometabolic Disease Markers by Type I Interferon Inhibition in Systemic Lupus Erythematosus

Kerry A Casey et al. Arthritis Rheumatol. 2021 Mar.

Abstract

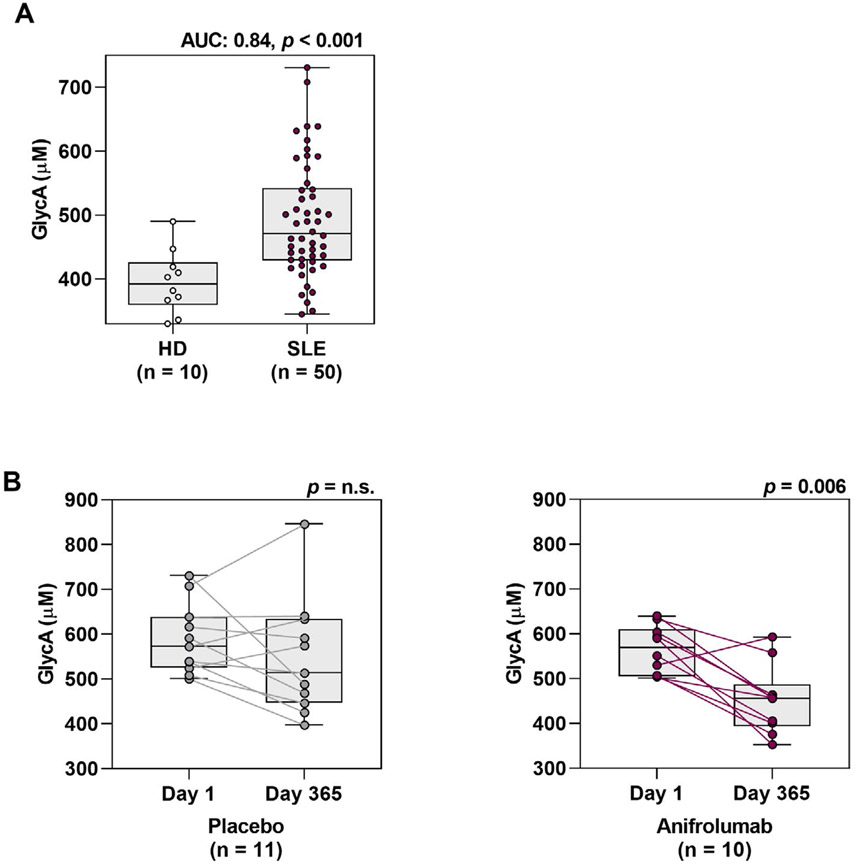
Objective: Neutrophil dysregulation and the type I interferon (IFN) axis have been proposed to contribute to premature cardiovascular disease, a leading cause of mortality in patients with systemic lupus erythematosus (SLE). In the present study, we evaluated the ability of anifrolumab, a type I IFN receptor-blocking antibody, to reduce neutrophil extracellular trap (NET) formation and modulate cardiometabolic disease markers in comparison to placebo.

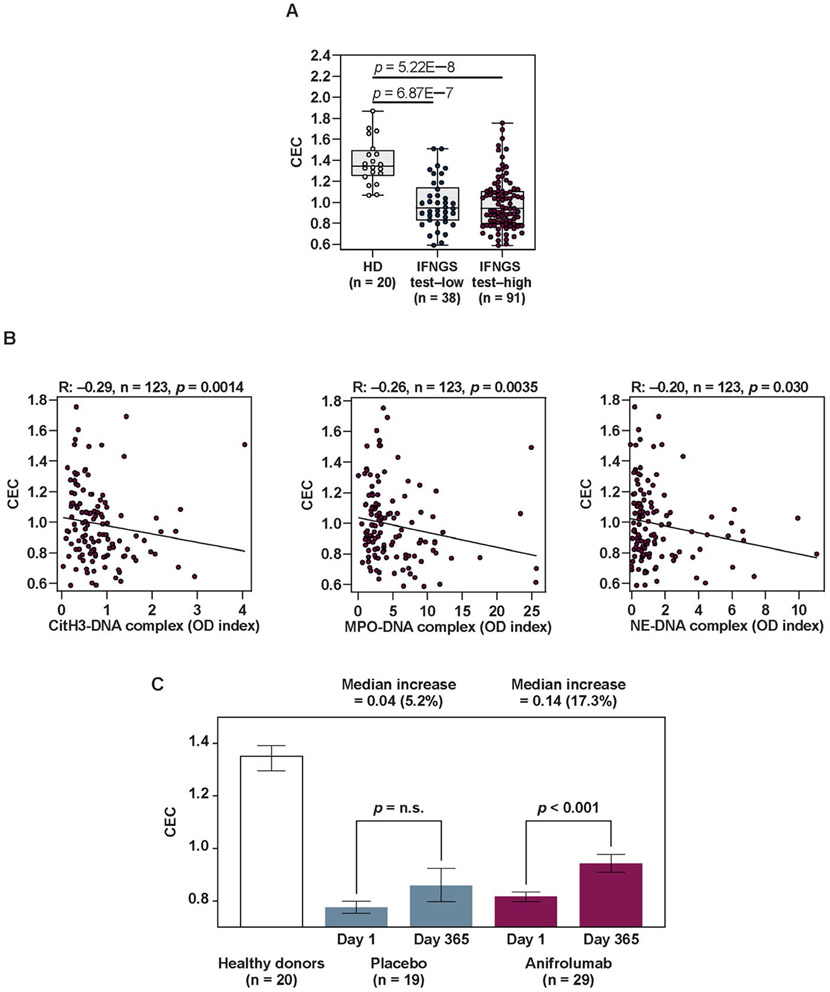
Methods: Study subjects comprised patients with moderate-to-severe SLE who were enrolled in phase IIb of the MUSE trial (A Phase II, Randomized Study to Evaluate the Efficacy and Safety of MEDI-546 in Subjects with Systemic Lupus Erythematosus), with healthy individuals as controls. Blood samples were collected from SLE patients (n = 305) and healthy controls (n = 10-20) before the initiation of treatment (baseline) and from SLE patients after they had been treated with 300 mg of anifrolumab (n = 99) or placebo (n = 102). Baseline IFN gene signature test status was determined, and the IFN gene signature (21-gene panel) was monitored over time. Serum proteins were measured by multiplex immunoassay or ultrasensitive Simoa assay. NET complexes, cholesterol efflux capacity (CEC), and glycoprotein acetylation (GlycA) and other lipid parameters were assessed in plasma.

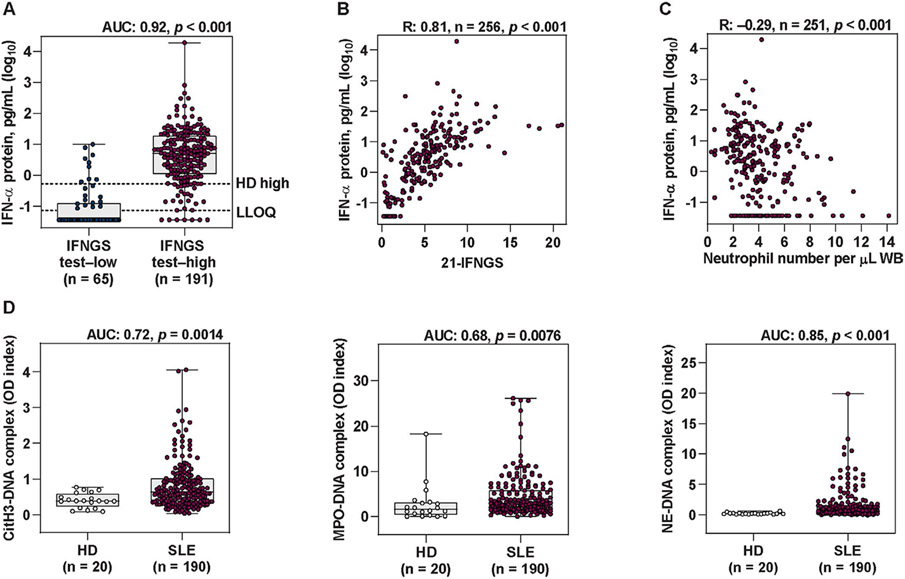
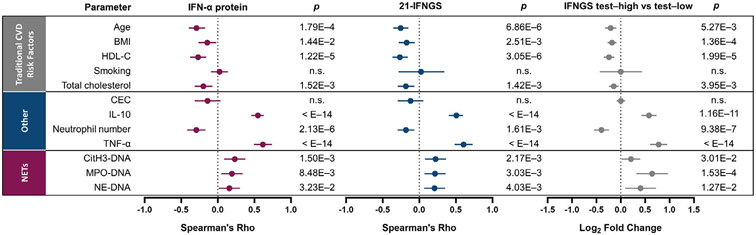
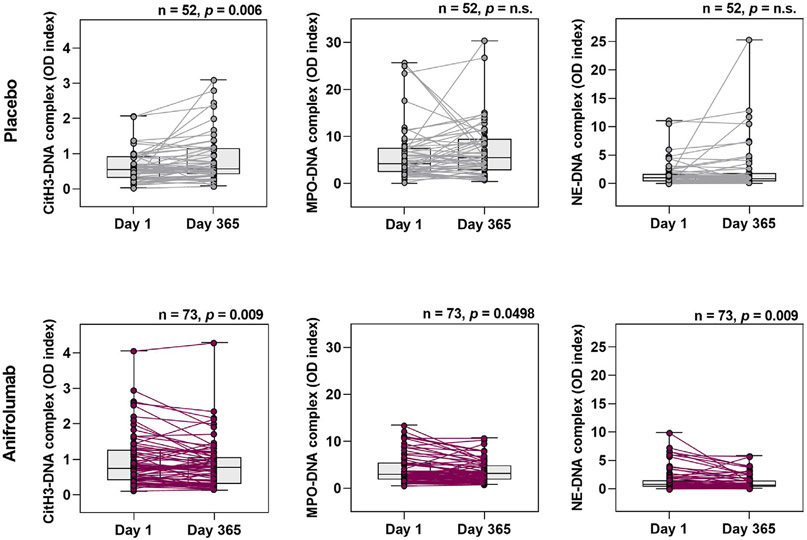
Results: Formation of NET complexes and levels of tumor necrosis factor (TNF) and interleukin-10 (IL-10) were correlated with extent of type I IFN pathway activity. NET complexes and IL-10 levels were up-regulated in SLE patients compared to healthy controls (P < 0.008). The cardiometabolic disease markers CEC and GlycA were also found to be dysregulated in patients with SLE (P < 0.001 versus healthy controls). Type I IFN receptor inhibition with anifrolumab significantly reduced NET complexes and GlycA and improved CEC compared to baseline (P < 0.05) whereas no improvements were seen with placebo. Levels of TNF and IL-10 were reduced with anifrolumab compared to placebo (P < 0.05).

Conclusion: These data support a key role for type I IFNs in modulating factors contributing to SLE vasculopathy and suggest that inhibition of this pathway could decrease cardiovascular risk in individuals with SLE.

Trial registration: ClinicalTrials.gov NCT01438489.


Figures

Figure 1.
Figure 1.
Elevated type I interferon (IFN) pathway activity and neutrophil extracellular trap (NET) complex levels in patients with systemic lupus erythematosus (SLE). A, Levels of IFNα protein measured by quantitative Simoa immunoassay in type I IFN gene signature (IFNGS) test–low patients and IFNGS test–high patients with moderate-to-severe SLE. Broken lines represent the maximum IFNα level in healthy donors (HD high [0.53 pg/ml]) as well as the lower limit of quantification (LLOQ [0.073 pg/ml]). B, Levels of IFNα protein measured by Simoa immunoassay versus levels of 21-IFNGS expression. C, Number of neutrophils versus levels of IFNα protein measured by Simoa immunoassay. D, Levels of the NET complexes citrullinated histone H3 (CitH3)–DNA, myeloperoxidase (MPO)–DNA, and neutrophil elastase (NE)–DNA measured by capture enzyme-linked immunosorbent assay in healthy donors and in patients with moderate-to-severe SLE. Values in A and D are shown as box plots. Each box represents the 25th and 75th percentiles, lines inside the boxes represent the median, and whiskers represent the ranges. Symbols represent individual subjects. P values were calculated using a Mann-Whitney 2-tailed U test (A and D) or 2-tailed Spearman’s rank correlation (B and C). AUC = area under the curve; WB = whole blood; OD = optical density.
Figure 2.
Figure 2.
Association of traditional risk factors for cardiovascular disease (CVD), levels of interleukin-10 (IL-10), number of neutrophils, levels of tumor necrosis factor (TNF), and number of NET complexes with the type I IFN axis in patients with SLE. Age, body mass index (BMI), levels of high-density lipoprotein cholesterol (HDL-C), smoking history, levels of total cholesterol, cholesterol efflux capacity (CEC), levels of IL-10 protein, numbers of neutrophils per microliter of whole blood, TNF protein levels, and levels of circulating NET complexes (CitH3–DNA, MPO–DNA, and NE–DNA) were compared to 3 measures of the type I IFN pathway: IFNα protein levels, the 21-IFNGS, and IFNGS test status (IFNGS test–high versus IFNGS test–low). Spearman’s rank correlation was used to analyze the correlation between the parameters and the 21-IFNGS and IFNα protein levels. Associations of parameters with IFNGS test status was analyzed by Welch’s t-test and was expressed as the log2 fold change. Values are shown as forest plots with 95% confidence intervals. NS = not significant (see Figure 1 for other definitions).
Figure 3.
Figure 3.
Significantly decreased levels of circulating NET complexes with type I IFN pathway inhibition following 1 year of treatment with anifrolumab. Levels of NET complexes (CitH3–DNA, MPO–DNA, and NE–DNA) were measured by capture enzyme-linked immunosorbent assay on day 1 and day 365 in patients with moderate-to-severe SLE who received 300 mg of the anti–IFNAR-1 antibody anifrolumab or placebo. Values are shown as box plots. Each box represents the 25th and 75th percentiles, lines inside the boxes represent the median, and whiskers represent the ranges. Symbols represent individual subjects. P values were calculated using Wilcoxon’s signed rank test. NS = not significant (see Figure 1 for other definitions).
Figure 4.
Figure 4.
Correlation of impaired cholesterol efflux capacity (CEC) in SLE patients at baseline with NET complex levels and normalization of CEC following type I IFN–signaling inhibition. A, Levels of CEC in apolipoprotein B (Apo-B)–depleted plasma samples from healthy donors, IFNGS test–low patients with SLE, and IFNGS test–high patients with SLE. Values are shown as box plots. Each box represents the 25th and 75th percentiles, lines inside the boxes represent the median, and whiskers represent the ranges. Symbols represent individual subjects. B, Association between CEC and NET complexes (CitH3–DNA, MPO–DNA, and NE–DNA) assessed in SLE patients using Spearman’s rank correlation. C, Change in CEC levels in Apo-B–depleted plasma samples from IFNGS test–high patients with moderate-to-severe SLE who had defects in CEC at baseline and who were treated with 300 mg of anifrolumab or placebo. CEC defects were defined as levels ≥2 SD below the mean level in healthy donors (mean 0.96). CEC in healthy donors at baseline are shown for reference. Results are the mean ± SEM. P values were calculated using Wilcoxon’s signed rank test. NS = not significant (see Figure 1 for other definitions).
Figure 5.
Figure 5.
Reduction from baseline in the levels of glycoprotein acetylation (GlycA) following type I IFN pathway inhibition in patients with SLE. A, GlycA levels measured at baseline by nuclear magnetic resonance spectroscopy in healthy donors or IFNGS test–high patients with SLE. The AUC is indicated, along with P values calculated by Mann-Whitney U test. B, GlycA levels measured on day 1 and day 365 in IFNGS test–high GlycA-high patients with SLE who were treated with 300 mg of anifrolumab or placebo. GlycA-high was defined as levels ≥2 SD above the mean level in healthy donors (mean 500 μM). P values were calculated using Wilcoxon’s signed rank test. Values are shown as box plots. Each box represents the 25th and 75th percentiles, lines inside the boxes represent the median, and whiskers represent the ranges. Symbols represent individual subjects. NS = not significant (see Figure 1 for other definitions).

References

    1. Nossent J, Cikes N, Kiss E, Marchesoni A, Nassonova V, Mosca M, et al. Current causes of death in systemic lupus erythematosus in Europe, 2000–2004: relation to disease activity and damage accrual. Lupus 2007;16:309–17. - PubMed
    1. Esdaile JM, Abrahamowicz M, Grodzicky T, Li Y, Panaritis C, du Berger R, et al. Traditional Framingham risk factors fail to fully account for accelerated atherosclerosis in systemic lupus erythematosus. Arthritis Rheum 2001;44:2331–7. - PubMed
    1. Kahlenberg JM, Kaplan MJ. The interplay of inflammation and cardiovascular disease in systemic lupus erythematosus [review]. Arthritis Res Ther 2011;13:203. - PMC - PubMed
    1. Yao Y, Higgs BW, Morehouse C, de los Reyes M, Trigona W, Brohawn P, et al. Development of potential pharmacodynamic and diagnostic markers for anti-IFN-α monoclonal antibody trials in systemic lupus erythematosus. Hum Genomics Proteomics 2009;2009:374312. - PMC - PubMed
    1. Denny MF, Thacker S, Mehta H, Somers EC, Dodick T, Barrat FJ, et al. Interferon-α promotes abnormal vasculogenesis in lupus: a potential pathway for premature atherosclerosis. Blood 2007;110:2907–15. - PMC - PubMed

Publication types

MeSH terms

Associated data