. 2020 Sep 10:9:e60683.
doi: 10.7554/eLife.60683.

Vascular dimorphism ensured by regulated proteoglycan dynamics favors rapid umbilical artery closure at birth

Affiliations

Vascular dimorphism ensured by regulated proteoglycan dynamics favors rapid umbilical artery closure at birth

Sumeda Nandadasa et al. Elife. .

Abstract

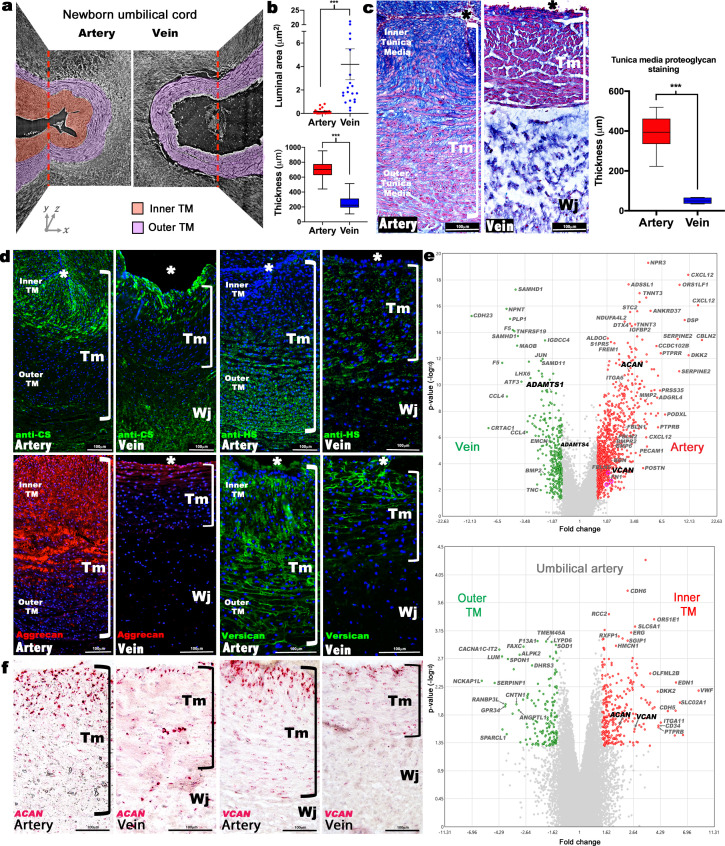
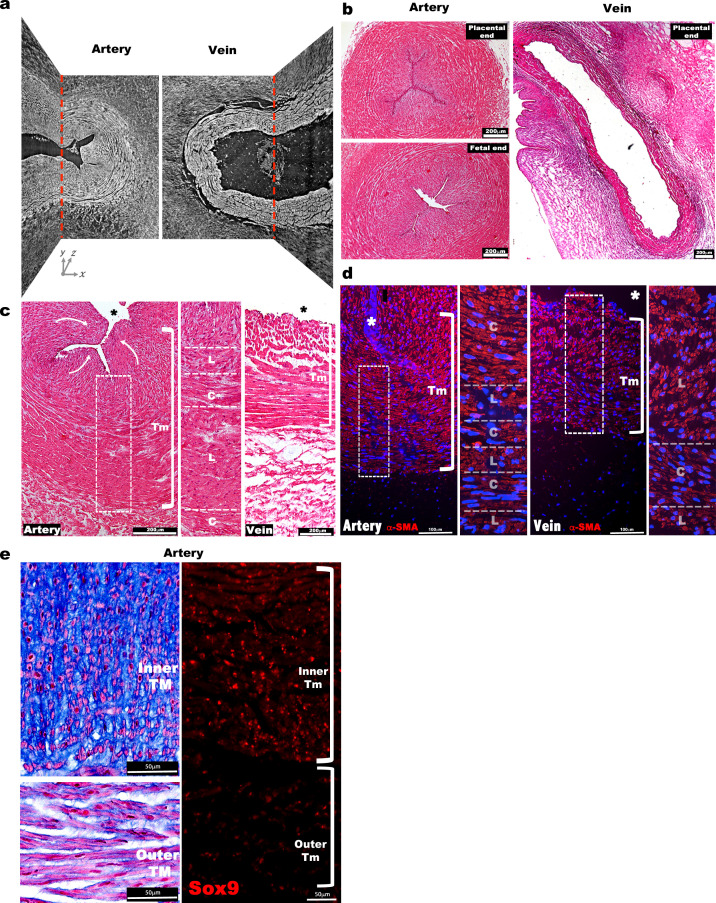
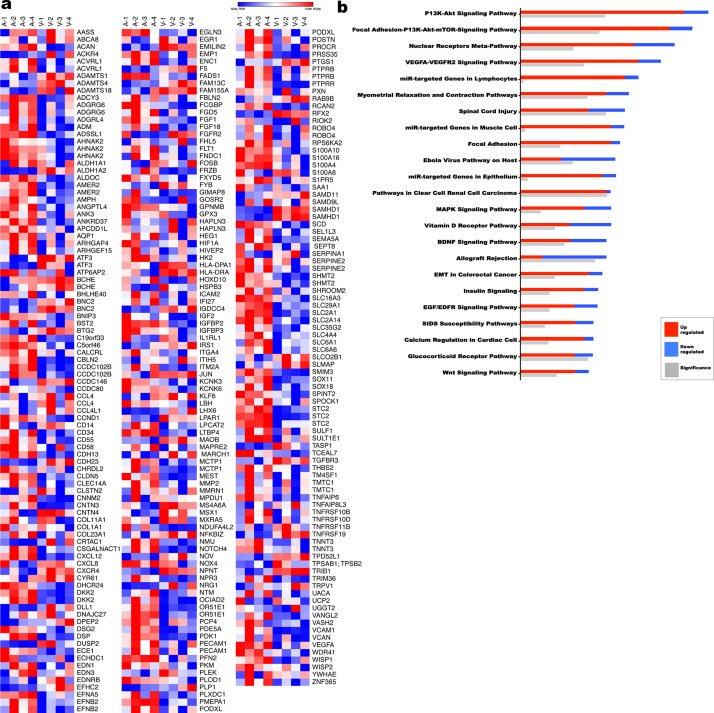
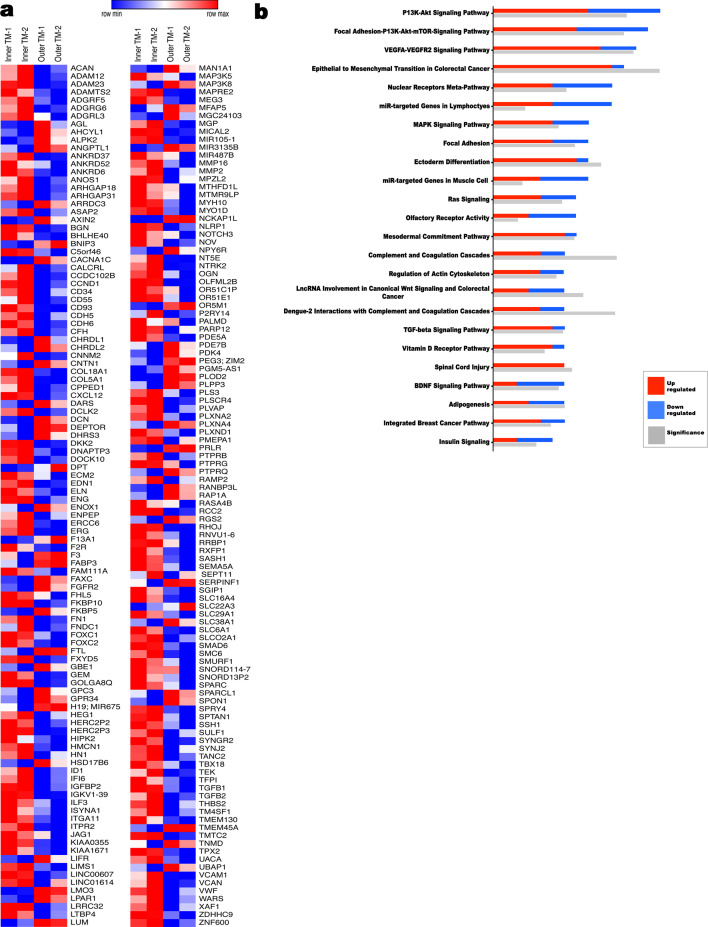
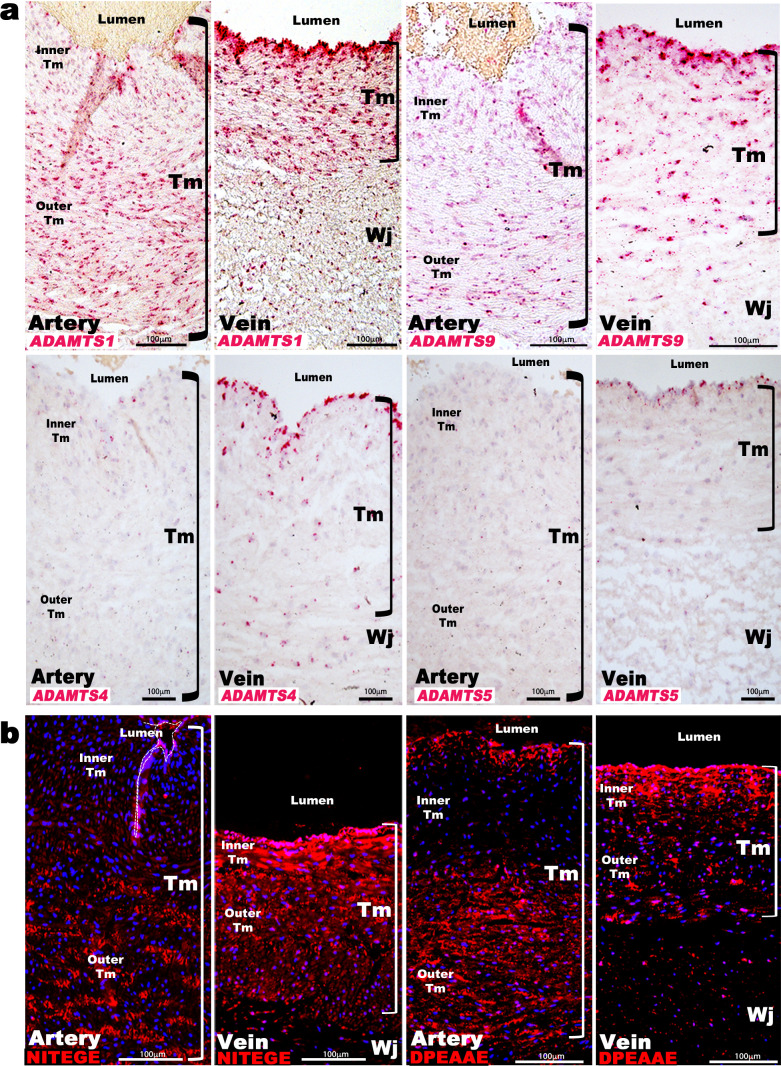
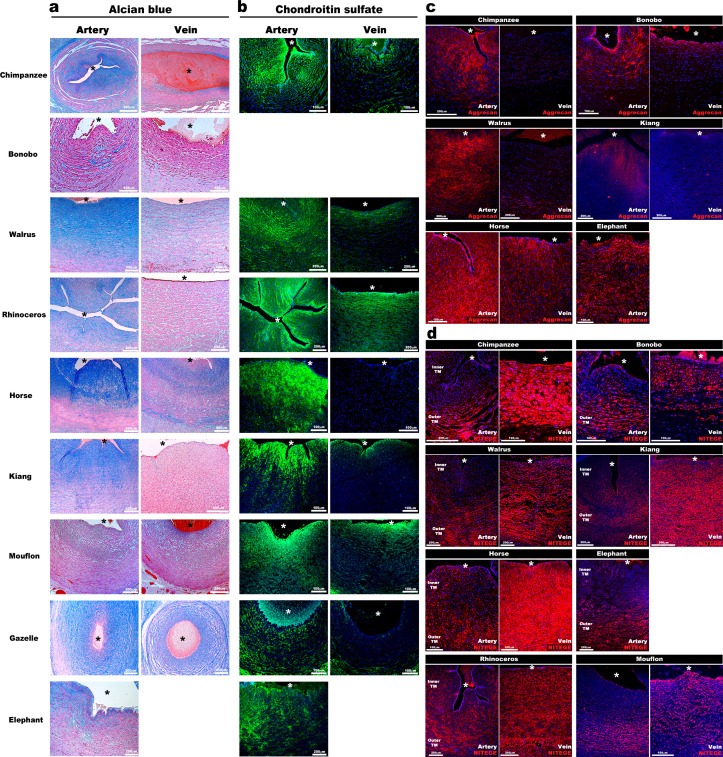
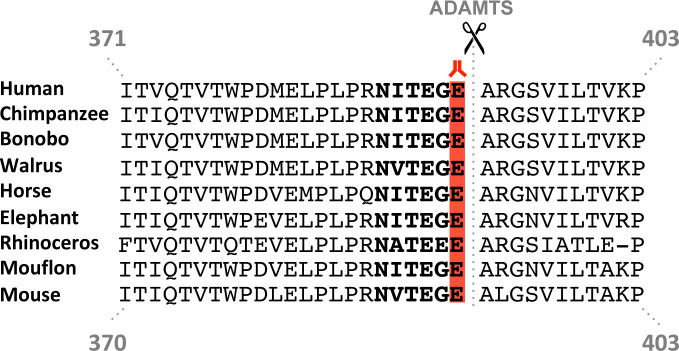
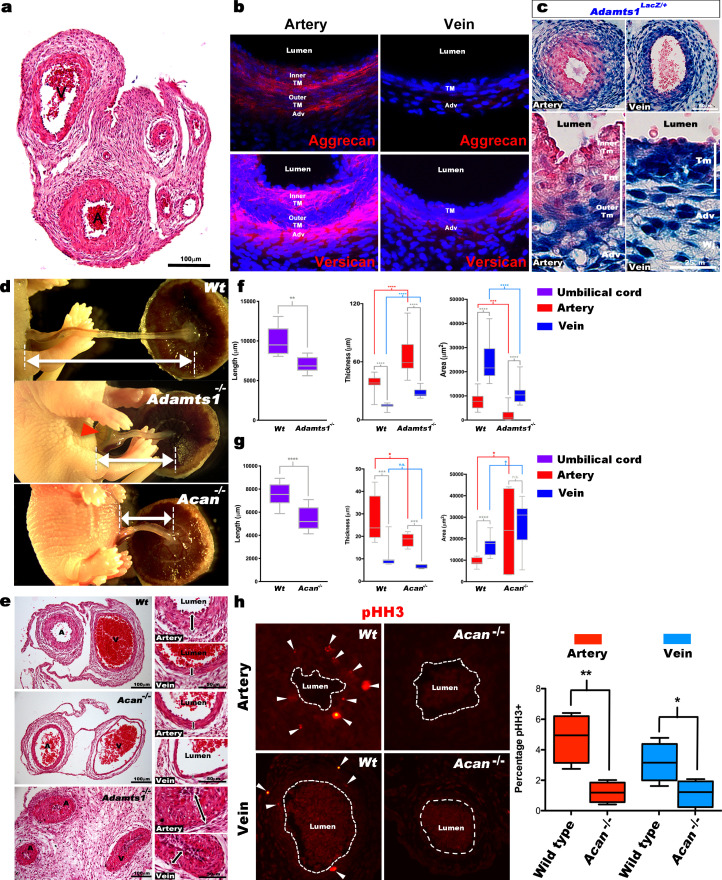
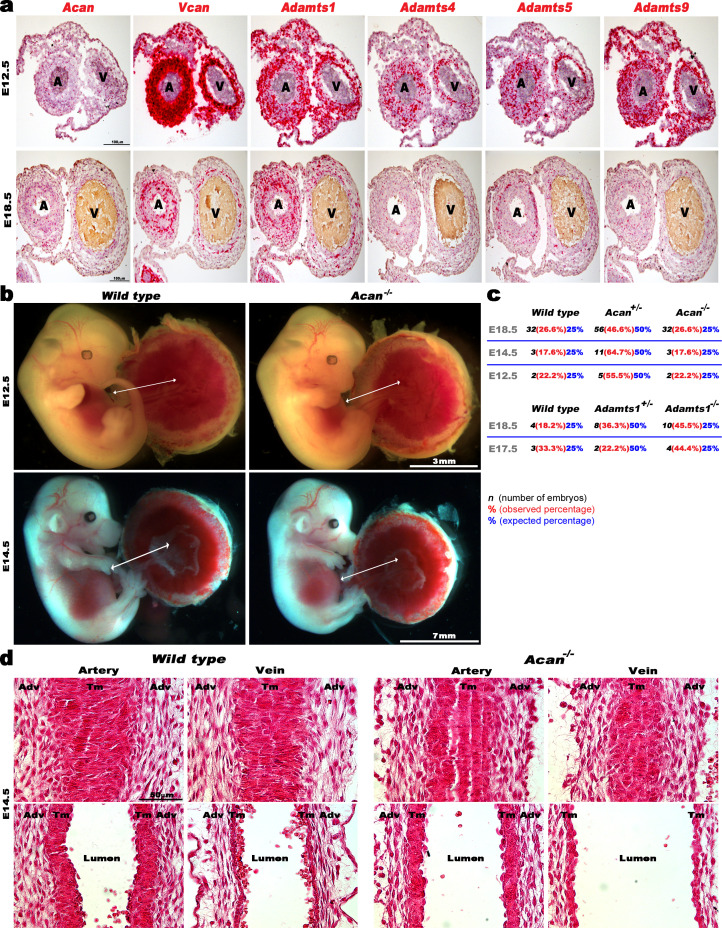
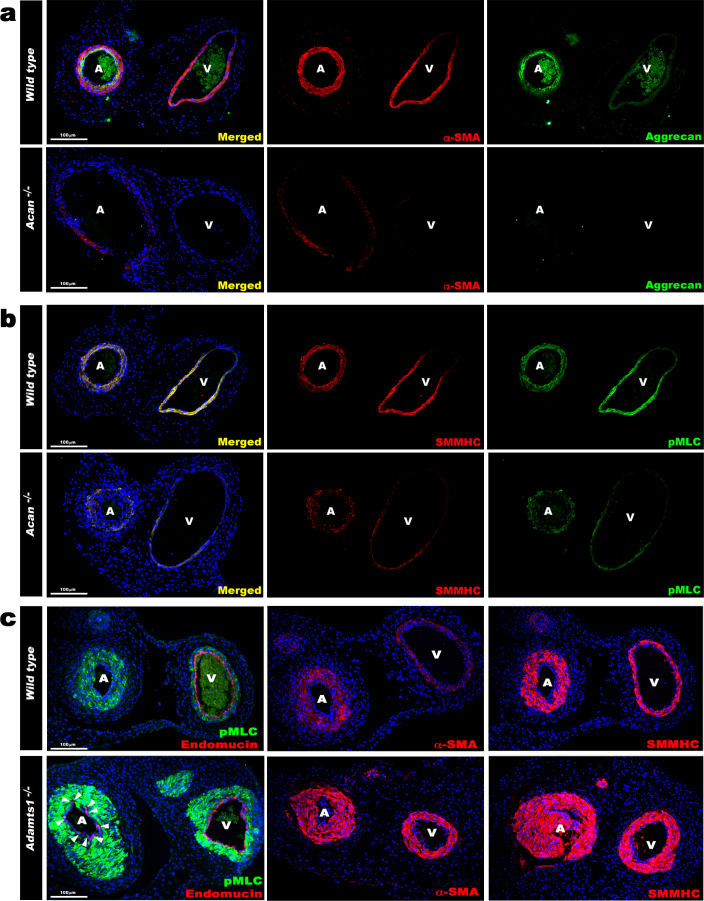
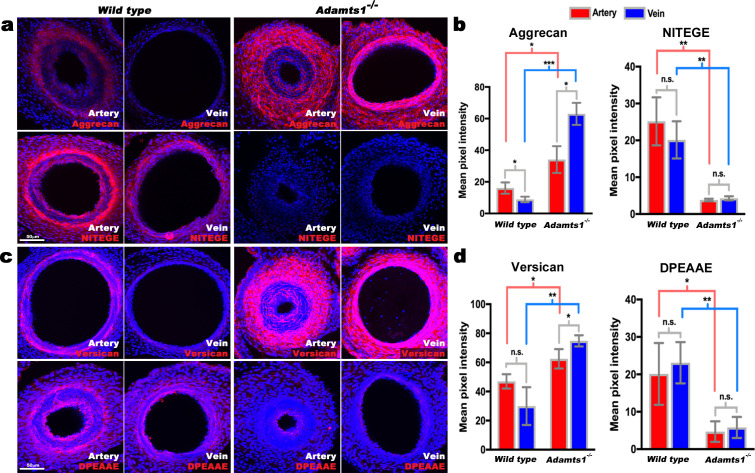
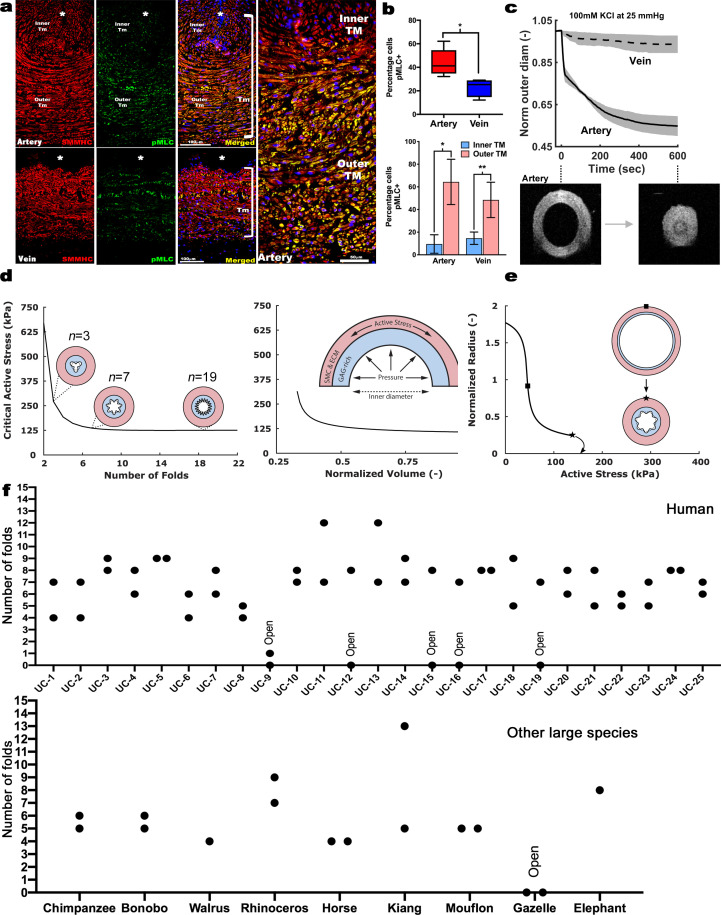
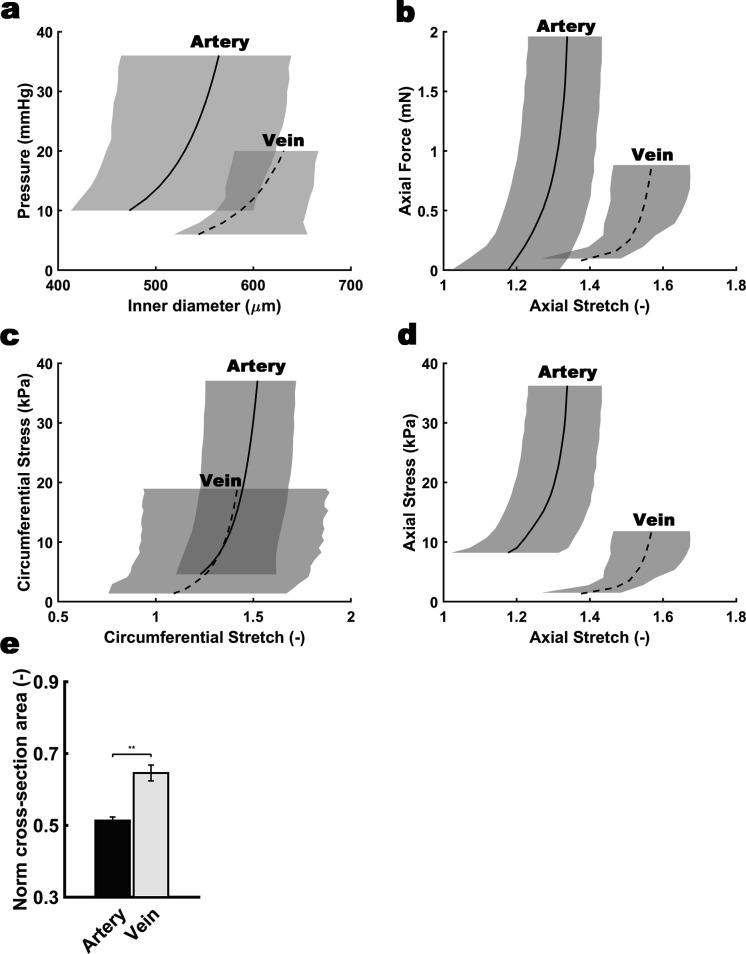
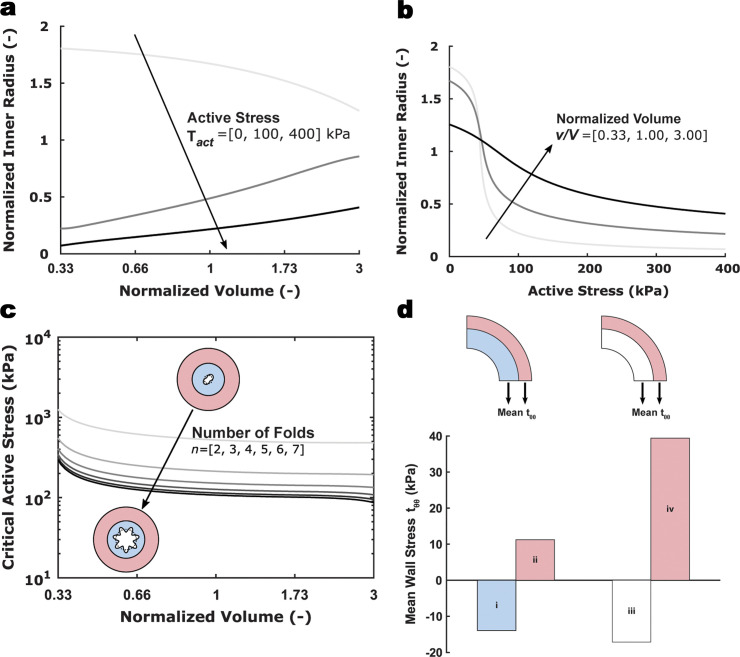
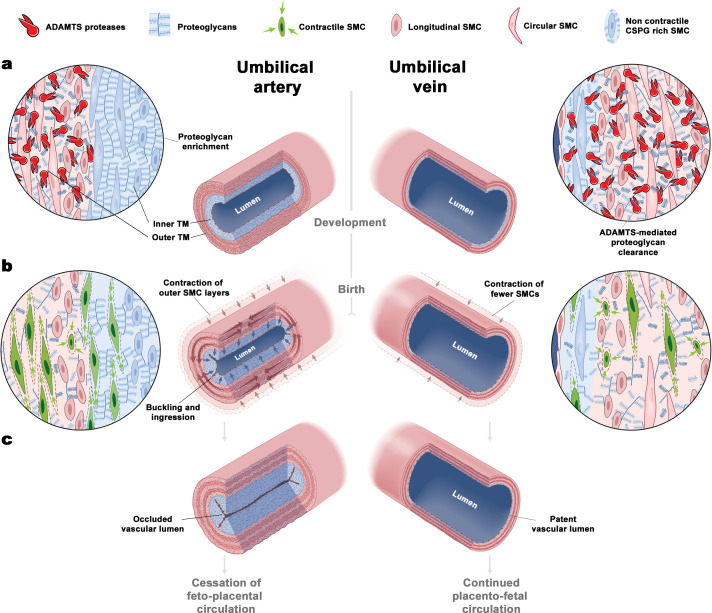
The umbilical artery lumen closes rapidly at birth, preventing neonatal blood loss, whereas the umbilical vein remains patent longer. Here, analysis of umbilical cords from humans and other mammals identified differential arterial-venous proteoglycan dynamics as a determinant of these contrasting vascular responses. The umbilical artery, but not the vein, has an inner layer enriched in the hydrated proteoglycan aggrecan, external to which lie contraction-primed smooth muscle cells (SMC). At birth, SMC contraction drives inner layer buckling and centripetal displacement to occlude the arterial lumen, a mechanism revealed by biomechanical observations and confirmed by computational analyses. This vascular dimorphism arises from spatially regulated proteoglycan expression and breakdown. Mice lacking aggrecan or the metalloprotease ADAMTS1, which degrades proteoglycans, demonstrate their opposing roles in umbilical vascular dimorphism, including effects on SMC differentiation. Umbilical vessel dimorphism is conserved in mammals, suggesting that differential proteoglycan dynamics and inner layer buckling were positively selected during evolution.

Keywords: birth; computational biology; developmental biology; extracellular matrix; human; mouse; proteoglycans; systems biology; umbilical cord; vascular engineering; vascular smooth muscle.


Conflict of interest statement

SN, JS, VP, SM, CK, AO, CN, CH, BC, MD, NS, KT, MV, DS, EP, JH, SA No competing interests declared

Figures

Figure 1.
Figure 1.. Dimorphism of the human umbilical artery and vein.
(a) Synchrotron imaging of umbilical vessels at birth illustrates a bilayered arterial wall comprising an inner buckled tunica media (TM) (red) and outer TM (purple) but no distinct inner layer or buckling in the vein. X-Y and Y-Z image planes are indicated by red dashed lines (n = 3 umbilical cords). (b) Quantitation of luminal cross-sectional area at birth shows that the umbilical arteries are occluded whereas the veins remain patent (top) and have significantly thicker walls (bottom) (n = 20 cords, error bars indicate mean ± S.E.M., whiskers indicate minimum and maximum values. ***, p<0.001). (c) Alcian blue, eosin (pink) and nuclear fast red staining of umbilical vessel cross-sections shows a proteoglycan-rich (blue) inner TM in the umbilical artery but not the vein. Quantified staining intensity is shown on the right (n = 6 umbilical cords, whiskers indicate minimum and maximum values, ***, p<0.001). (d) Chondroitin sulfate (CS), heparan sulfate (HS), aggrecan and versican immunofluorescence (n = 4 cords for each antibody) showing that CS staining corresponds with aggrecan and versican staining and alcian blue in (c). (e) Volcano plots illustrating differential gene expression between human umbilical artery (red) and vein (green) (top, n = 4 umbilical arteries and veins) and differential gene expression between human umbilical artery inner TM (red) and the outer TM (green) (bottom, n = 2). (f) RNA in situ hybridization shows robust ACAN and VCAN expression (red signal) in the inner artery TM and weak expression in the vein (n = 3 umbilical cords for each in situ probe). * marks the vessel lumen. Brackets in c,d,f mark the TM. Wj, Wharton’s jelly. Scale bars = 100 μm in c,d,f.
Figure 1—figure supplement 1.
Figure 1—figure supplement 1.. Morphological and cellular characteristics of the human umbilical arteries and veins at birth.
(a) Synchrotron image from Figure 1a without red and purple shading illustrates contrast between inner and outer arterial tunica media (TM) as well as inner TM buckling, compared with a uniform appearance of venous TM and lack of buckling (n = 3 umbilical cords). (b) Hematoxylin and eosin stained human umbilical artery cross-sections collected from the placental and fetal ends show occlusion of the umbilical artery with buckling of its interior, while the vein remains patent and lacks buckling (n = 25 umbilical cords). (c) Hematoxylin and eosin stained cross-sections show multiple cell layers composed of alternating circumferentially (C) or longitudinally (L) oriented smooth muscle cells (SMC) in the umbilical artery. Curved white arrows indicate internal protrusion of the inner TM of the umbilical artery arising from buckling. (d) α-SMA (α-smooth muscle actin, red) and DAPI (blue) staining of the umbilical artery and vein shows distinct orientation of the SMC layers as in (c) (n = 3 umbilical cords). (e) (Left) Alcian blue staining shows intense staining of the inner arterial TM, with radially-oriented rounded cells contrasting with outer TM cells having elongated morphology. Eosin (pink) and nuclear fast red counterstaining. (Right) Sox9 immunostaining shows nuclear staining of SMCs of the inner umbilical artery TM (n = 6 umbilical cords, * marks the vessel lumen in panels (c,d,e). White brackets in (c,d and e) mark the TM. Tm, tunica media). Scale bars = 200 μm in (b) and c, 100 μm in d and 50 μm in e.
Figure 1—figure supplement 2.
Figure 1—figure supplement 2.. Transcriptome comparison and pathway analysis of differences in the human umbilical artery and vein.
(a) Heat map of a subset of differentially expressed genes (1.9 fold-change) from umbilical artery vs vein (n = 4 umbilical cords). (b) Ingenuity pathway analysis (IPA) summary of the most significantly different pathways (n = 4 umbilical cords).
Figure 1—figure supplement 3.
Figure 1—figure supplement 3.. Transcriptome comparison and pathway analysis of differences in the human inner umbilical artery tunica media (TM) vs the outer tunica media.
(a) Heat map of a subset of differentially expressed genes (1.9 fold-change) (n = 2 umbilical arteries, two inner TM samples matched to two outer TM samples). (b) Ingenuity pathway analysis (IPA) showing significantly different pathways in the umbilical artery inner and outer tunica media (n = 2 umbilical arteries, two inner TM samples matched to two outer TM samples).
Figure 2.
Figure 2.. ADAMTS proteoglycanases are highly expressed and active in the human umbilical vein.
(a) RNA in situ hybridization shows robust ADAMTS1 and ADAMTS9 expression in umbilical vein endothelium and tunica media (TM) and in outer arterial TM. Robust ADAMTS4 and ADAMTS5 expression was confined to the venous endothelium, with moderate ADAMTS4 expression and minimal ADAMTS5 expression in SMC (n = 3 umbilical cords for each probe). (b) ADAMTS-cleaved aggrecan (anti-NITEGE, red) and versican (anti-DPEAAE, red) both showed strong ADAMTS proteolytic activity throughout the venous wall and the outer artery TM. Unlike aggrecan, extensive versican proteolysis is seen in the arterial intima and sub-intima (n = 4 umbilical cords for each antibody). Wj, Wharton’s jelly. The brackets mark TM boundaries. Scale bars in a-b = 100 μm.
Figure 3.
Figure 3.. Aggrecan enrichment in the inner umbilical artery tunica media (TM) and its proteolysis in the umbilical vein is a characteristic of large mammals.
(a) Alcian blue-eosin staining of umbilical cord sections shows proteoglycan enrichment (blue) in the inner arterial tunica media (TM). The elephant umbilical vein was unavailable. (b) Anti-CS immunofluorescence (7D4, green) shows enrichment in the inner arterial TM. Bonobo cords lacked 7D4 reactivity. (c,d) Aggrecan and anti-NITEGE immunostaining from reactive species showed aggrecan enrichment in the inner arterial TM and aggrecan proteolysis in the vein and outer artery TM. n = 3 for Gazelle and n = 1 for other mammals. Triplicate sections were stained from each animal cord. Scale bars = 100 μm and 200 μm. * indicates the vessel lumen.
Figure 3—figure supplement 1.
Figure 3—figure supplement 1.. Aggrecan cleavage site conservation in mammals.
The cleavage site location is shown over the sequence alignment by scissors, and the critical Glu(E) residue essential for cleavage is shown by red highlighting. Bold text identifies the cleavage-revealed neo-epitope NITEGE. Residue numbers are indicated for human and mouse aggrecan only.
Figure 4.
Figure 4.. Defective morphogenesis in Acan and Adamts1 mutant mouse umbilical cords.
(a) H and E staining of E18.5 wild-type cords showing thicker umbilical arterial (A) and thinner venous (V) wall (n = 6 umbilical cords). (b) Aggrecan and versican localization (red, DAPI counterstain blue) in E18.5 wild-type cords showing staining in the arterial inner tunica media (TM) and adventitia but not the vein (n = 3 umbilical cords). (c) β-gal (blue) and eosin (red) staining of E18.5 Adamts1LacZ/+ (Adamts1+/-) cord showing strong Adamts1 expression in venous endothelium and TM and outer artery TM (n = 3 umbilical cords). (d) Short umbilical cords in E18.5 Adamts1-/- and Acan-/- embryos compared to wild type. Red arrowhead indicates an omphalocele in Adamts1-/- embryos. (e) H & E staining of E18.5 wild type, Acan-/- and Adamts1-/- cord cross-sections showing thinner walls in Acan-/- umbilical vessels and thicker walls in Adamts1-/- umbilical vessels. (f–g) Cord length, TM thickness and vessel luminal area quantifications for Adamts1-/- (f) and Acan-/- mice (g) at E18.5 compared to wild-type littermates. Acan-/- umbilical cords show larger lumens and Adamts1-/- vessels show smaller lumens in (n = 7–11 umbilical cords each, whiskers indicate minimum and maximum values, *, p<0.05; **, p<0.01; ***, p<0.001; ****, p<0.0001). (h) Phospho-histone H3 (pHH3) staining shows significantly fewer proliferating cells (white arrowheads) in Acan-/- umbilical vessels. Dotted white lines mark the boundaries of vessel lumens (n = 4 cords each, whiskers indicate minimum and maximum values, **, p<0.001; *, p<0.05). Scale bars = 100 μm in (a), 25 μm in (c), 100 μm and 50 μm in (e).
Figure 4—figure supplement 1.
Figure 4—figure supplement 1.. ADAMTS, Vcan and Acan expression and impact of aggrecan loss on early mouse umbilical cord and vessel development.
(a) RNA in situ hybridization analysis of E12.5 and E18.5 mouse umbilical cord sections Acan, Vcan and relevant ADAMTS genes (n = 3 umbilical cords for each probe). (b) E12.5 and E14.5 wildtype and Acan-/- embryos have a comparable umbilical cord length (n = 2 Acan-/- at E12.5 and n = 3 at E14.5). (c) Observed and expected genotype ratios at different embryonic stages from Acan+/- and Adamts1+/- intercrosses. (d) Hematoxylin and eosin staining of E14.5 wild type and Acan-/- umbilical cords shows completion of longitudinal to circumferential reorientation of smooth muscle cells in the mutant arterial tunica media (TM). Upper panels show tangential longitudinal sections whereas the lower panels are taken through the approximate center of each vessel (n = 3 umbilical cords of each genotype). Adv, adventitia; Tm, tunica media. Scale bars in a = 100 μm, 3 mm and 7 mm in (b) and 50 μm in (d).
Figure 5.
Figure 5.. Contrasting smooth muscle cell (SMC) phenotype modulation in Acan and Adamts1-deficient umbilical vessels.
(a) Aggrecan (green) and α-SMA staining (red) in E18.5 umbilical cords show loss of aggrecan and weak α-SMA staining in Acan-/- vessels (n = 3 umbilical cords each genotype). (b) Smooth muscle myosin heavy chain (SMMHC, red) and phosphorylated myosin light chain (pMLC, green) staining in E18.5 umbilical cords showing dramatic signal attenuation in the Acan-/- vessels (n = 3 umbilical cords each genotype) (c) pMLC (green), endomucin (red), α-SMA (red, center panels) and SMMHC (red, right-hand panels) staining shows blunted dimorphism of Adamts1-/- umbilical artery and vein with stronger expression of differentiated SMC markers in Adamts1-/- umbilical vessels and acquisition of endomucin, a venous endothelium marker, by arterial endothelium (n = 3 umbilical cords each genotype) Scale bars = 100 μm in (a–c).
Figure 6.
Figure 6.. Reduced aggrecan and versican proteolysis in Adamts1-/-umbilical vessels.
(a,b) E17.5 Adamts1-/- umbilical vessels show increased aggrecan staining and reduced anti-NITEGE staining in (a), quantified in (b) (n = 3 cords each genotype, error bars indicate mean ±S.D.*, p<0.05; **, p<0.01; ***, p<0.001). (c,d) Adamts1-/- umbilical vessels show increased versican (c) and reduced anti-DPEAAE staining quantified in (d) (n = 3 cords each genotype, error bars indicate mean ±S.D. *, p<0.05; **, p<0.01). Scale bars = 50 μm in (a–c).
Figure 7.
Figure 7.. Contraction-induced buckling ensures effective closure of the umbilical artery at birth.
(a) Smooth muscle myosin heavy chain (SMMHC-red) and serine-20 phosphorylated myosin light-chain (pMLC-green) show more contraction-primed SMCs in the outer arterial tunica media (TM, white brackets) than the umbilical vein. Scale bars are 100 µm. (b) Quantitation of pMLC+ SMCs in the artery (red) and vein (blue) (top, n = 5 arteries, four veins, whiskers indicate minimum and maximum values, *, p<0.05) and inner and outer TM of both reveal similar distributions but more pMLC+ SMC in the outer artery TM (bottom, n = 3 arteries, four veins, error bars indicate mean ±S.D. *, p<0.05; **, p<0.01). (c) Differential contraction of murine umbilical artery and vein stimulated by 100 mM potassium chloride (KCl) under biaxial loading confirms greater contractility in the artery, with OCT images prior to and following contraction-induced arterial closure (n = 4 arteries and n = 4 veins). (d) Computational simulations of a bilayered artery with contractile SMCs in the outer layer and swollen inner layer: critical contractile stress values leading to buckling for (left) different numbers of folds for a normalized inner layer volume of 0.5 and (right) decreasing values of normalized volume of the inner layer for seven folds. (e) Normalized inner radius as a function of contractile stress for inner layer volume change of 0.5 and 7 folds. The states for the inflection (square) and critical active stress (star) are illustrated by the schematics; complete closure achieved with contraction-induced buckling. All simulations were run for 25 mmHg pressure. Due to the linear stability analysis, the amplitude of the folds in the buckled schematics is illustrative. (f) Number of buckles observed in human (top, indicated as umbilical cord (UC)1–25) and other large mammalian (bottom) umbilical arteries. Both arteries per cord were included. Open vessel lumens are indicated where observed.
Figure 7—figure supplement 1.
Figure 7—figure supplement 1.. Differential biomechanical properties of arteries and veins of the mouse umbilical cord.
Biaxial structural (a,b) and material (c,d) behaviors exhibited by umbilical arteries and veins harvested from wild type E18.5 umbilical cords. The curves show model predicted results for the mean behaviors based on best-fit parameters determined from seven different testing protocols performed individually on n = 4 arteries and n = 4 veins. Though based on data from all seven protocols, for illustrative purposes results are shown for pressure-diameter behaviors during quasi-static pressurization at a fixed vessel-specific in vivo length and quasi-static axial extension at fixed pressures (25 mmHg for the arteries, and 5 mmHg for the veins). Grey-shaded regions show S.D. (e) Change in normalized cross-sectional area for the umbilical vein at 5 mm Hg and for the umbilical artery at 25 mm Hg during isobaric contraction. Error bars indicate S.E.M, **, p<0.01.
Figure 7—figure supplement 2.
Figure 7—figure supplement 2.. Computational results for a model umbilical artery.
(a) Normalized inner radius as a function of normalized volume of the inner layer alone for different fixed values of the active stress parameter Tact and (b) inner radius as a function of the active stress parameter Tact for different fixed values of normalized volume in the inner layer. Loaded inner radius a was normalized by the unloaded inner radius A; the current volume of the vessel v was normalized by the original volume of the vessel V. (c) Critical value of the active stress parameter Tact as a function of the normalized volume in the inner layer for different numbers of buckling-induced luminal folds n. (d) Mean circumferential stress tθθ across the umbilical artery wall for varying normalized volumes: (i) and (ii) show circumferential stress for the case of shrinkage of the inner layer alone with v/V = 0.5 while (iii) and (iv) show the case of no swelling with v/V = 1.0. All simulations use the loading conditions, luminal pressure p=25 mmHg and fixed axial stretch λz=1.28.
Figure 8.
Figure 8.. The unique bilayered design of the umbilical artery underlies its rapid occlusion at birth.
(a) Differential expression of ADAMTS proteases and large CS-proteoglycans during development results in a bilayered artery with a hydrated proteoglycan-rich inner layer and most contractile SMCs located in the outer layer, contrasting with the umbilical vein (see key at top of figure identifying the illustrated major elements). (b) At birth, SMC contraction in the outer layer and fluid movement-induced inner layer buckling redirects the inner layer into the lumen. The single-layered vein does not undergo buckling. (c) Umbilical artery occlusion at birth prevents neonatal exsanguination, whereas the patent vein allows a final transfusion from the placenta.

Comment in

  • Severing umbilical ties.
    Wagenseil JE, Downs KM. Wagenseil JE, et al. Elife. 2020 Oct 12;9:e63128. doi: 10.7554/eLife.63128. Elife. 2020. PMID: 33044167 Free PMC article.

References

    1. Baek S, Gleason RL, Rajagopal KR, Humphrey JD. Theory of small on large: potential utility in computations of fluid–solid interactions in arteries. Computer Methods in Applied Mechanics and Engineering. 2007;196:3070–3078. doi: 10.1016/j.cma.2006.06.018. - DOI
    1. Bell L, Juriloff M, Harris MJ. A new mutation at the cmd locus in the mouse. Journal of Heredity. 1986;77:205–206. doi: 10.1093/oxfordjournals.jhered.a110215. - DOI - PubMed
    1. Dancevic CM, McCulloch DR, Ward AC. The ADAMTS hyalectanase family: biological insights from diverse species. Biochemical Journal. 2016;473:2011–2022. doi: 10.1042/BCJ20160148. - DOI - PubMed
    1. dela Paz NG, D'Amore PA. Arterial versus venous endothelial cells. Cell and Tissue Research. 2009;335:5–16. doi: 10.1007/s00441-008-0706-5. - DOI - PMC - PubMed
    1. Demirkoparan H, Pence TJ. Swelling of an internally pressurized nonlinearly elastic tube with fiber reinforcing. International Journal of Solids and Structures. 2007;44:4009–4029. doi: 10.1016/j.ijsolstr.2006.11.006. - DOI

Publication types