Review
. 2021 Mar 1;41(1):77-92.
doi: 10.1097/WNO.0000000000001078.

Optical Coherence Tomography Neuro-Toolbox for the Diagnosis and Management of Papilledema, Optic Disc Edema, and Pseudopapilledema

Affiliations
Review

Optical Coherence Tomography Neuro-Toolbox for the Diagnosis and Management of Papilledema, Optic Disc Edema, and Pseudopapilledema

Patrick A Sibony et al. J Neuroophthalmol. .

Abstract

Background: Distinguishing optic disc edema from pseudopapilledema is a common, sometimes challenging clinical problem. Advances in spectral-domain optical coherence tomography (SD-OCT) of the optic nerve head (ONH) has proven to be a cost effective, noninvasive, outpatient procedure that may help. At its core are tools that quantify the thickness of the retinal nerve fiber layer (RNFL) and ganglion cell-inner plexiform layer (GC-IPL). The SD-OCT also provides a set of tools that may be qualitatively interpreted in the same way that we read an MRI. They include the transverse axial, en face, and circular tomogram. Our goal is to describe a practical office-based set of tools using SD-OCT in the diagnosis and monitoring of papilledema, optic disc edema, and pseudopapilledema.

Evidence acquisition: Searches on PubMed were performed using combinations of the following key words: OCT, papilledema, pseudopapilledema, optic disc drusen, retinal folds (RF), and choroidal folds (CF).

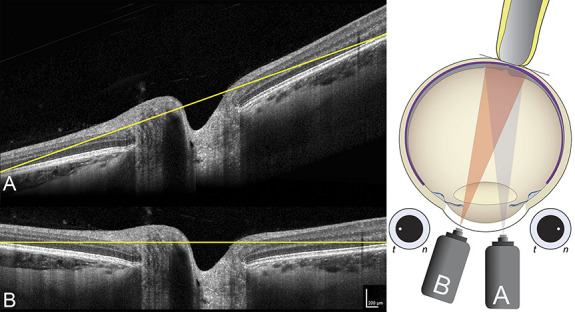
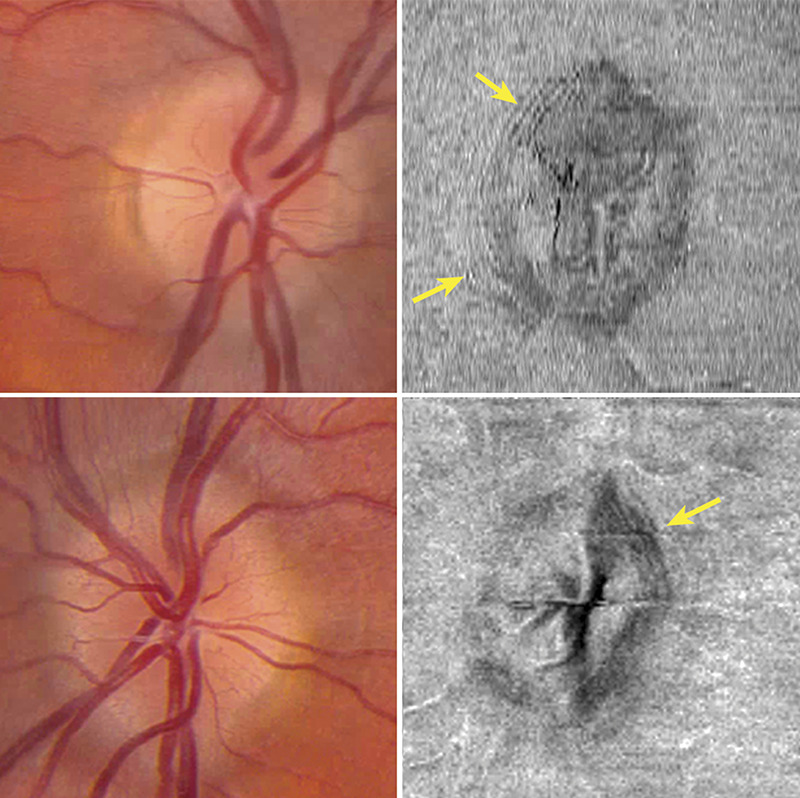
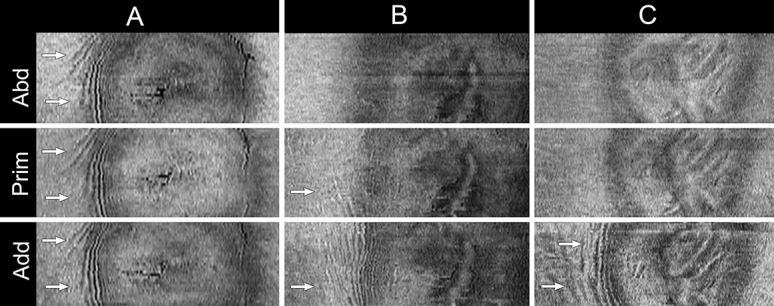
Results: The principal elements of SD-OCT analysis of the ONH are the RNFL and GC-IPL thickness; however, these metrics have limitations when swelling is severe. Qualitative interpretation of the transverse axial SD-OCT aids in assessing peripapillary shape that may help distinguish papilledema from pseudopapilledema, evaluate atypical optic neuropathies, diagnose shunt failures, and identify outer RF and CF. There is a consensus that the SD-OCT is the most sensitive way of identifying buried optic disc drusen. En face SD-OCT is especially effective at detecting peripapillary wrinkles and outer retinal creases, both of which are common and distinctive signs of optic disc edema that rule out pseudopapilledema. Mechanically stressing the ONH in the adducted eye position, in patients with papilledema, may expose folds and peripapillary deformations that may not be evident in primary position. We also discuss how to optimize the acquisition and registration of SD-OCT images.

Conclusions: The SD-OCT is not a substitute for a complete history and a careful examination. It is, however, a convenient ancillary test that aids in the diagnosis and management of papilledema, optic disc edema, and pseudopapilledema. It is particularly helpful in monitoring changes over the course of time and distinguishing low-grade papilledema from buried drusen. The application of the SD-OCT toolbox depends on optimizing the acquisition of images, understanding its limitations, recognizing common artifacts, and accurately interpreting images in the context of both history and clinical findings.


Conflict of interest statement

P. A. Sibony received honorariums from Heidelberg Engineering for invited lectures in 2018. Heidelberg Engineering has provided unrestricted educational and research support to the Department of Neurology at Mt Sinai Medical Center (M. J. Kupersmith and P. A. Sibony) and Department of Ophthalmology University of Iowa (R. H. Kardon). This review does not refer to nor endorse any specific commercial OCT device.

Figures

FIG. 1.
FIG. 1.
A. MRI showing distended optic nerve sheaths with flattening of the globe. Corresponding (B) unstretched transverse axial OCT and (C) 3× vertically scaled transverse axial OCT. OCT, optical coherence tomography.
FIG. 2.
FIG. 2.
Peripapillary shape patterns on transverse axial OCT (30°, 3× vertically scaled; left side of each inset is temporal to the disc). Shapes are defined by the configuration of Bruch's membrane layer (BML, illustrated in bottom row with a red line) relative to horizontal yellow line that connects the peripheral ends of BML. The most frequent pattern (V-Flat column) is a continuum that falls between an F (flat)-shape and V-shape that lies at or entirely below the horizontal reference line. There are 3, sometimes overlapping, shape patterns associated with anterior deformation or displacement (columns WSDome). The W-shape consists of symmetrical anterior deflection (toward the vitreous) of the inner margins of the BML. The S-shape is anteriorly displaced toward the vitreous nasally above the reference line, and posteriorly displaced temporally, below the horizontal reference that tilts Bruch's membrane opening. The D or dome shape is a broad-based symmetrical, anterior displacement of the peripapillary BML above the horizontal reference line. The white arrows depict the forces acting on the optic nerve head that presumably give rise to these shape patterns. OCT, optical coherence tomography.
FIG. 3.
FIG. 3.
Transverse axial (30°, 3× vertical stretch) OCT of a 32-year-old man with a history of hydrocephalus and ventriculoperitoneal shunt. A. Baseline OCT with a functioning shunt has a relatively flat or F-shape with optic atrophy (mean RNFL thickness 45 μm). B. Six months later, shunt failure is associated with an anterior deformation (D-shape) and a slight increase in the mean RNFL thickness to 54 μm. C. One month after shunt revision showing normal V-shape and the mean RNFL thickness of 46 μm. Shape changes are independent of the degree of papilledema and particularly helpful in patients with optic atrophy and intracranial hypertension. OCT, optical coherence tomography; RNFL, retinal nerve fiber layer. Red line delineates the shape of Bruch's membrane layer (BML). Yellow line is a reference line that joins the peripheral margins of BML.
FIG. 4.
FIG. 4.
A 66-year-old diabetic woman with sudden painless vision loss, 20/40, an afferent pupillary defect, a nasal step, and unilateral optic disc edema in the right eye (A). The left eye was normal with cup-to-disc ratio of 0.2 (B). A presumptive diagnosis of nonarteritic anterior ischemic optic neuropathy was made. Because the transverse axial OCT showed anterior deformation with a W-shape in the right eye (C) vs V-shape in the left eye (D), we obtained an MRI (E) that showed a presumed optic nerve sheath meningioma. OCT, optical coherence tomography. Yellow line is a reference that joins the peripheral margins of Bruch's membrane layer. The white arrow highlights the anterior displacement or BML relative to the yellow reference line.
FIG. 5.
FIG. 5.
Tilted image artifact (A) vs horizontal flat (B) image. To obtain a symmetrical, flat image the camera needs to be positioned approximately 12° temporal to the pupillary axis, aimed nasally at the posterior pole so that the scan is symmetrically positioned over the optic disc (camera B). The precise position of the scanning beam on the pupillary axis may vary but can be adjusted using the preview screen.
FIG. 6.
FIG. 6.
Registration of two 30° transverse axials (3× vertically scaled), from the same patient obtained at (A) baseline and (B) 6 weeks later on acetazolamide. The landmarks on the peripheral Bruch's membrane layer (BML, black circles in A) and (white circles in B) are superimposed in image (C) so that the Bruch's membrane opening (BMO) is aligned with the vertical dashed lines. At baseline, the mean retinal nerve fiber layer (RNFL) thickness was 118 μm with a mild V-shaped configuration of BML relative to the horizontal dotted reference line (A). One month later, on treatment there is a decrease in the mean RNFL at 96 μm. The BMO was displaced 160 µm posteriorly and the V-shape of the BML is steeper (B). Comparison of sequential transverse axials can be performed in the outpatient setting by superimposing tracings of printed reports on a light box.
FIG. 7.
FIG. 7.
Salient features of optic disc drusen on the transverse axial includes: (A) signal poor core occasionally associated with a (B) hyperreflective cap or (C) multiple small hyperreflective aggregates within a signal poor core. Small horizontal bands are also shown in (D). Peripapillary hyperreflective ovoid mass like structure (PHOMS, white arrowhead) are not drusen.
FIG. 8.
FIG. 8.
Pseudopapilledema without drusen. A. Tilted optic disc syndrome with significant rotation, an oval shape, situs inversus; (B) ophthalmoscopic features of the myopic obliquely inserted disc (MOID) consist of a pale nasal C-shaped halo (white arrowhead), nasal elevation, obscuration of the nasal disc margin, and little if any rotation. C. A slightly rotated MOID with an asymptomatic peripapillary subretinal hemorrhage (white arrow); (D) late staining of the nasal disc on fluorescein angiography sometimes seen in a MOID; (E, F) salient optical coherence tomography features of MOID with corresponding fundus photograph showing nasal elevation, (E, F) oblique entry of the optic nerve (white arrow), peripapillary hypopigmentation temporally, and peripapillary hyperreflective ovoid mass like structure (yellow arrowhead) that corresponds to the C-shaped halo nasally in the photograph. Yellow lines in (E, F) show corresponding locations in the OCT image and the optic disc photo.
FIG. 9.
FIG. 9.
Transverse axial images: (A) Nonarteritic anterior ischemic optic neuropathy with peripapillary subretinal fluid and macular edema, serous pigment epithelial detachment (a); (B) neuroretinitis (85) with (b) epipapillary inflammatory infiltrates, (c) vitreous cells, (d) peripapillary wrinkles and inner retinal folds, (e) outer retinal creases, and (f) peripapillary subretinal fluid; (C) Papilledema with (h) peripapillary fluid, (i) choroidal neovascular membrane and subretinal hemorrhage, and (g) inner retinal folds.
FIG. 10.
FIG. 10.
Four types of folds in papilledema (columns AD) shown with photographs (row 1), en face OCT (row 2), and cross-sectional OCT (row 3). A. Peripapillary wrinkles (PPW) or Paton's folds are closely spaced (∼110 μm) undulations temporal to the optic nerve head (ONH) in the RNFL (arrows). The pattern is usually concentric to the optic disc or may spiral toward the macula. PPW can occur in any type of optic disc edema and best imaged with en face OCT (A2). B. Peripapillary outer retinal folds or creases are widely spaced (∼300 to 450 μm) and spare the RNFL. Funduscopically, they are commonly referred to as “high-water marks” (B1, black arrows). Early on they may be associated with subretinal fluid. As the fluid resorbs it leaves behind a deeply furrowed self-contacting crease in the outer retina that appears en face as circumpapillary ring (B2, white arrow) and a vertical line on the transverse axial (B3, black arrow). C. Inner retina folds (∼230 μm) spare the choroid. In papilledema they tend to radiate out from the ONH (C1, 2) or consist of horizontal folds in the papillomacular bundle. They are best imaged with en face OCT (C2) or perpendicularly oriented line scans (C3) or circle tomogram. D. Choroidal folds are widely spaced (∼530 μm) full-thickness folds distributed horizontally or obliquely across the posterior pole (D1, 2) and funduscopically associated with the RPE striations (D1). In patients with intracranial hypertension, choroidal folds correlate with intracranial pressure and anterior shape deformation of the peripapillary tissues. They are best imaged with a perpendicularly oriented cross-sectional OCT (D3) or circle tomogram. OCT, optical coherence tomography. RPE, retinal pigment epithelial.
FIG. 11.
FIG. 11.
A 31-year-old woman with occasional headaches for 2 years, body mass index 30.5. Examination was otherwise normal. No drusen by B-scan or OCT; the mean RNFL thickness was 106 μm in the right eye, 101 μm in the left eye; no anterior deformation; en face OCT showed peripapillary wrinkles temporally in both eyes (yellow arrows). MRI/MRV was normal. Cerebrospinal fluid pressure was 33 cm. Some patients adapt to long-standing intracranial hypertension with minimal swelling, preservation of vision, in effect a chronic “compensated” papilledema. OCT, optical coherence tomography; RNFL, retinal nerve fiber layer. MRV, Magnetic resonance venography.
FIG. 12.
FIG. 12.
A 16-year-old girl with optic disc drusen and papilledema (98). Baseline examination of left eye (AC) showed an elevated optic nerve head and optic disc drusen confirmed by ultrasound, autofluorescence, and OCT (C, yellow arrow). However, the patient has peripapillary wrinkles (PPW) on the en face OCT (B, white arrows), and transverse axial showed an anterior (S-shaped) deformation (C) with a mean RNFL thickness of 373 μm. MRI revealed hydrocephalus due to an aqueductal stenosis. She was treated with an endoscopic third ventriculostomy. Six months later, the mean RNFL thickness decreased to 84 μm and OCT showed a reduction in the PPW (D, E) and a V-shape (F). Optic disc drusen are more visible (F, yellow arrows) on transverse axial OCT. The right eye (not shown) was similar in all respects. OCT, optical coherence tomography; RNFL, retinal nerve fiber layer.
FIG. 13.
FIG. 13.
Transverse axial, sagittal, and circular optical coherence tomography from the same subject with horizontal choroidal and inner retinal folds. Folds parallel to the transverse axial scan are not visible (A). Vertical scans perpendicular to the folds clearly display folds (B). Circular tomogram (C) will sometimes include a segment of the circumference that perpendicularly intersects with folds if they cross the circular scan. Red lines in the scanning laser images (left column) shows the relative location of the corresponding cross sectional. B. Scans in the right column. Green lines show location and orientation of the cross sectional B scans.
FIG. 14.
FIG. 14.
Transverse axial optical coherence tomography (vertical stretch of 1.4×) acquired in primary position, 30° abduction and 30° adduction (A). The images obtained in abduction (black) and adduction (white) are superimposed in (B). The 2 lines that connect the naso–temporal margins of the Bruch's membrane opening obtained in abduction (black line) and adduction (white line) intersect to form the tilt angle (ta). In adduction the temporal side of the Bruch's membrane opening is posteriorly displaced (away from the vitreous, white line) relative to the nasal side. In abduction displacement is reversed. Folds can be seen on the temporal slope of the optic nerve head in adduction only (white arrow, in B).
FIG. 15.
FIG. 15.
En face optical coherence tomographies at the vitreoretinal interface obtained in primary position (prim), 30° abduction (abd), and 30° adduction (add). Three patterns are displayed. A. Peripapillary wrinkles (PPW) in primary position that are not affected by changes in eye position; (B) PPW in primary that become more evident in adduction and absent in abduction; (C) an example of PPW that are absent in primary and visible only when the eye is adducted. The white arrows in each case highlight the area of folds temporal to the optic disc.

Comment in

References

    1. Kardon R. Optical coherence tomography in papilledema: what am I missing? J Neuroophthalmol. 2014;34(suppl l):S10–S17. - PubMed
    1. Costello F, Malmqvist L, Hamann S. The role of optical coherence tomography in differentiating optic disc drusen from optic disc edema. Asia Pac J Ophthalmol. 2018;7:271–279. - PubMed
    1. Chen JJ. Optical coherence tomography and neuro-ophthalmology. J Neuroophthalmol. 2018;38:e5–e8. - PubMed
    1. Chen JJ, Costello F. The role of optical coherence tomography in neuro-ophthalmology. Ann Eye Sci. 2018;3:1–18.
    1. Hayreh SS. Pathogenesis of optic disc edema in raised intracranial pressure. Prog Retin Eye Res. 2016;50:108–144. - PMC - PubMed

Publication types

MeSH terms

Supplementary concepts