. 2021 Feb;34(1):49-56.
doi: 10.1007/s10334-020-00884-y. Epub 2020 Sep 10.

Probing hepatic metabolism of [2-13C]dihydroxyacetone in vivo with 1H-decoupled hyperpolarized 13C-MR

Affiliations

Probing hepatic metabolism of [2-13C]dihydroxyacetone in vivo with 1H-decoupled hyperpolarized 13C-MR

Irene Marco-Rius et al. MAGMA. 2021 Feb.

Abstract

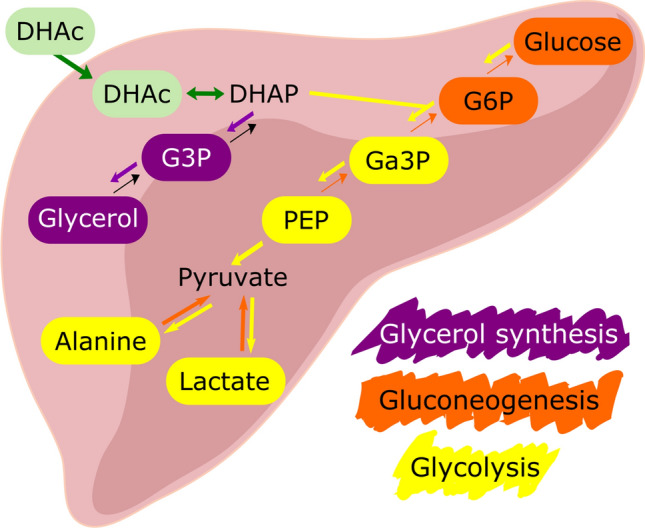
Objectives: To enhance detection of the products of hyperpolarized [2-13C]dihydroxyacetone metabolism for assessment of three metabolic pathways in the liver in vivo. Hyperpolarized [2-13C]DHAc emerged as a promising substrate to follow gluconeogenesis, glycolysis and the glycerol pathways. However, the use of [2-13C]DHAc in vivo has not taken off because (i) the chemical shift range of [2-13C]DHAc and its metabolic products span over 144 ppm, and (ii) 1H decoupling is required to increase spectral resolution and sensitivity. While these issues are trivial for high-field vertical-bore NMR spectrometers, horizontal-bore small-animal MR scanners are seldom equipped for such experiments.

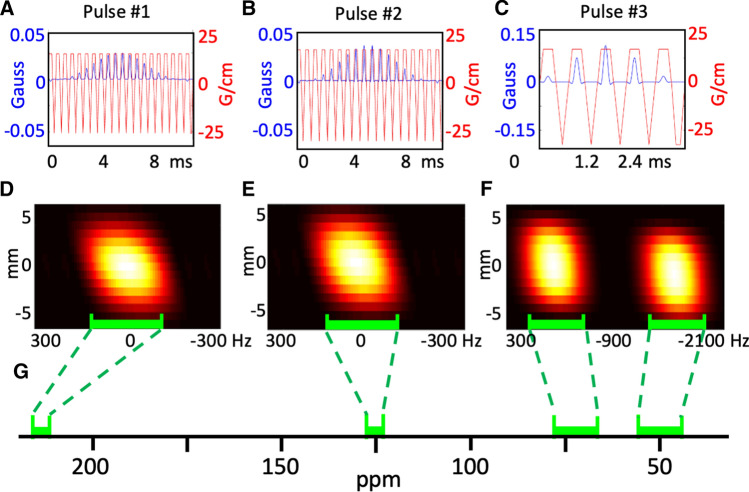
Methods: Real-time hepatic metabolism of three fed mice was probed by 1H-decoupled 13C-MR following injection of hyperpolarized [2-13C]DHAc. The spectra of [2-13C]DHAc and its metabolic products were acquired in a 7 T small-animal MR scanner using three purpose-designed spectral-spatial radiofrequency pulses that excited a spatial bandwidth of 8 mm with varying spectral bandwidths and central frequencies (chemical shifts).

Results: The metabolic products detected in vivo include glycerol 3-phosphate, glycerol, phosphoenolpyruvate, lactate, alanine, glyceraldehyde 3-phosphate and glucose 6-phosphate. The metabolite-to-substrate ratios were comparable to those reported previously in perfused liver.

Discussion: Three metabolic pathways can be probed simultaneously in the mouse liver in vivo, in real time, using hyperpolarized DHAc.

Keywords: Carbon-13 magnetic resonance spectroscopy; Dynamic Nuclear Polarisation; Gluconeogenesis; Glycolysis; Hyperpolarisation; Liver; Metabolism.


Conflict of interest statement

The authors declare that they do have no conflict of interest.

Figures

Fig. 1
Fig. 1
Metabolism of dihydroxyacetone in the liver. Metabolites highlighted in either purple (glycerol synthesis) or yellow (gluconeogenesis/glycolysis) were observed in the present 13C-MR study. DHAc dihydroxyacetone, DHAP dihydroxyacetone phosphate, G3P glycerol-3-phosphate, G6P glucose-6-phosphate, Ga3P glyceraldehyde 3-phosphate, PEP phosphoenolpyruvate
Fig. 2
Fig. 2
Radiofrequency (blue; G) and magnetic field gradient (red; G/cm) profiles of the spectral-spatial RF pulses used to excite a dihydroxyacetone (DHAc), b phosphoenolpyruvate (PEP) and c other metabolites of interest. Simulations of their frequency and spatial profiles, shown as transverse magnetization, for the three pulses are shown in: (d) DHAc, (e) PEP and (f) the other metabolites of interest. g A chemical shift axis showing the regions of the spectrum that are excited by the spectral-spatial pulses
Fig. 3
Fig. 3
Acquisition scheme and spectra acquired from the liver of a mouse infused with hyperpolarized [2-13C]dihydroxyacetone (DHAc). a Three spectral regions were acquired in an interleaved fashion. b Spectrum showing DHAc resonance at 212.9 ppm (acquired using pulse #1). c Spectrum (×10 vertical scale relative to (b)) showing the phosphoenolpyruvate (PEP) resonance (acquired using pulse #2). d Spectrum (×10 vertical scale relative to (b)) showing resonances from C5-β-glucose-6-phosphate (G6P-C5), C2-3-phosphoglycerate (3PG-C2), C2-β-glucose (Glc-C2), C2-β-glucose-6-phosphate (G6P-C2), C2- glyceraldehyde 3-phosphate (Ga3P), C2-glyceraldehyde-3-phosphate (Ga3P-C2), C2 -glycerol (Gly-C2), C2-glycerol-3-phosphate (G3P-C2), C2-lactate (Lac-C2) and C2-alanine (Ala-C2) (acquired using pulse #3). e, f T2-weighted images of the mouse (84 × 42 mm 512 × 256 data points, fast-spin-echo; effective echo time 25 ms; repetition time 1.5 s). The location and orientation of the 10-mm receive coil is represented by the bold white line and the 8- mm- thick acquisition slice is indicated by the dotted lines
Fig. 4
Fig. 4
Ratio of metabolite peak areas to that of dihydroxyacetone (DHAc) 20 s after the injection of a bolus of the hyperpolarized 13C-labeled substrate. The mean ratio is shown in grey with the standard deviation indicated by an error bar. The diagonal striped bars indicate the calculated ratios at 20 s mark after the start of DHAc infusion based on the analysis described by Kirpich et al. [23]

References

    1. Michalopoulos GK. Liver regeneration. J Cell Physiol. 2007;213(2):286–300. doi: 10.1002/jcp.21172. - DOI - PMC - PubMed
    1. Eddowes PJ, et al. Utility and cost evaluation of multiparametric magnetic resonance imaging for the assessment of non-alcoholic fatty liver disease. Aliment Pharmacol Ther. 2018;47(5):631–644. doi: 10.1111/apt.14469. - DOI - PubMed
    1. Pavlides M, et al. Multiparametric magnetic resonance imaging for the assessment of non-alcoholic fatty liver disease severity. Liver Int. 2017;37(7):1065–1073. doi: 10.1111/liv.13284. - DOI - PMC - PubMed
    1. Wong VWS, et al. Noninvasive biomarkers in NAFLD and NASH—current progress and future promise. Nat Rev Gastroenterol Hepatol. 2018;15:461–478. doi: 10.1038/s41575-018-0014-9. - DOI - PubMed
    1. Morze C, et al. Non-invasive detection of divergent metabolic signals in insulin deficiency vs insulin resistance in vivo. Sci Rep. 2018;8(1):2088. doi: 10.1038/s41598-018-20264-w. - DOI - PMC - PubMed

LinkOut - more resources