

National tuberculosis prevalence surveys in Africa, 2008-2016: an overview of results and lessons learned
- PMID: 32910557
- PMCID: PMC8043149
- DOI: 10.1111/tmi.13485
National tuberculosis prevalence surveys in Africa, 2008-2016: an overview of results and lessons learned
Abstract
Objective and methods: Worldwide, tuberculosis (TB) is the leading cause of death from a single infectious agent. In many countries, national TB prevalence surveys are the only way to reliably measure the burden of TB disease and can also provide other evidence to inform national efforts to improve TB detection and treatment. Our objective was to synthesise the results and lessons learned from national surveys completed in Africa between 2008 and 2016, to complement a previous review for Asia.
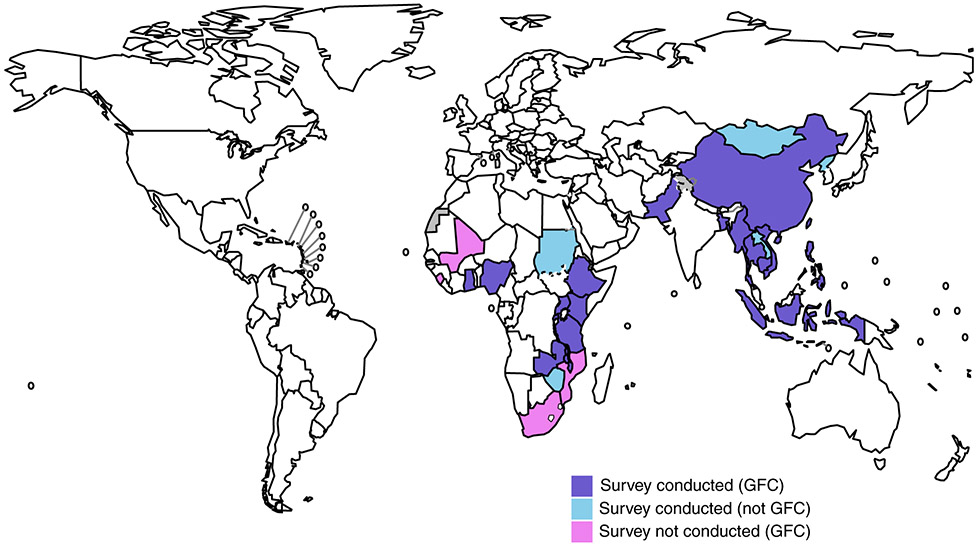
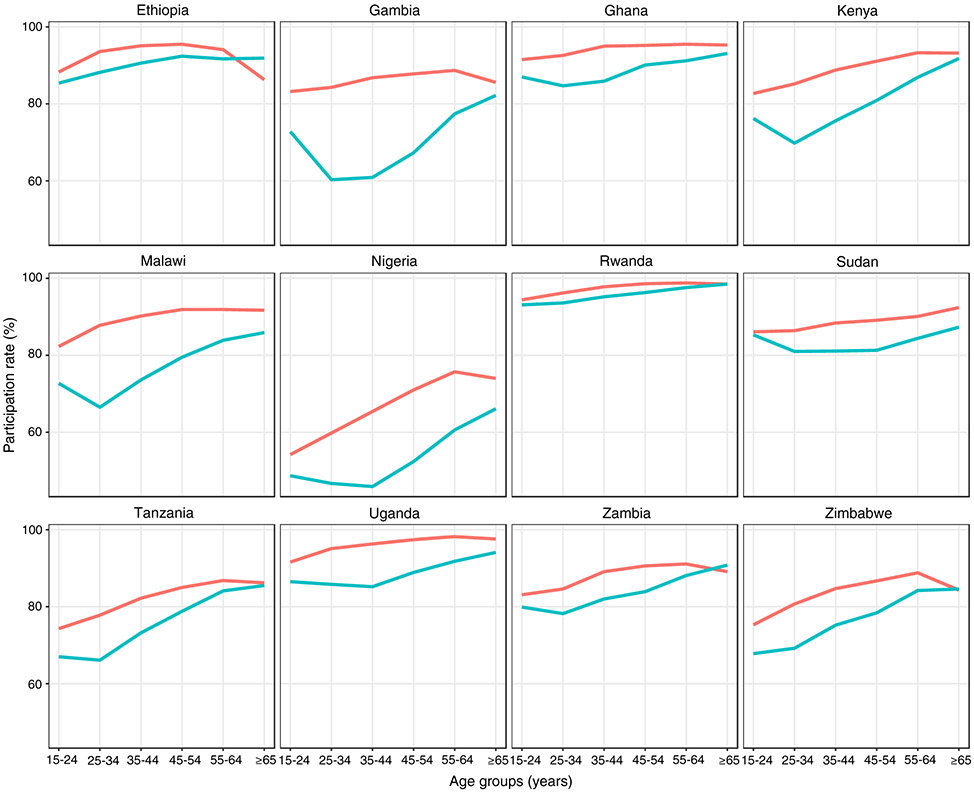
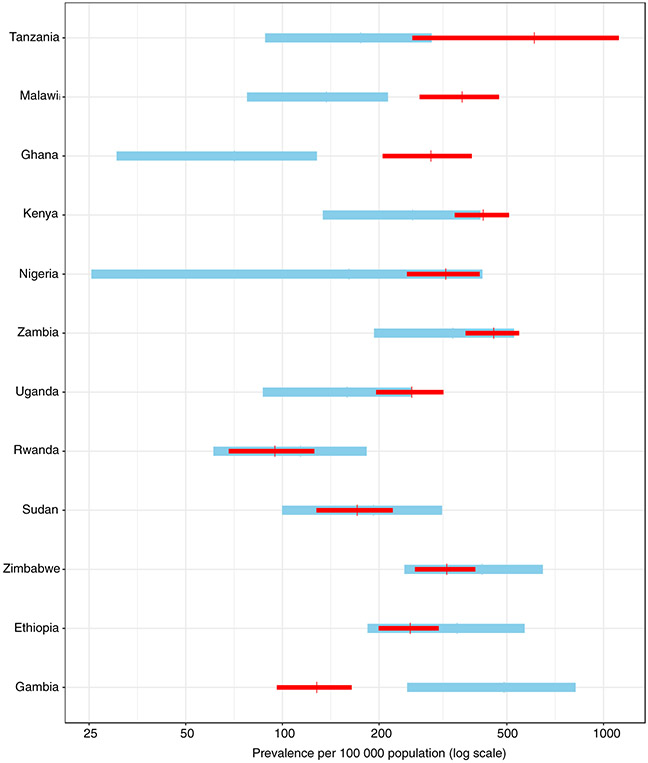
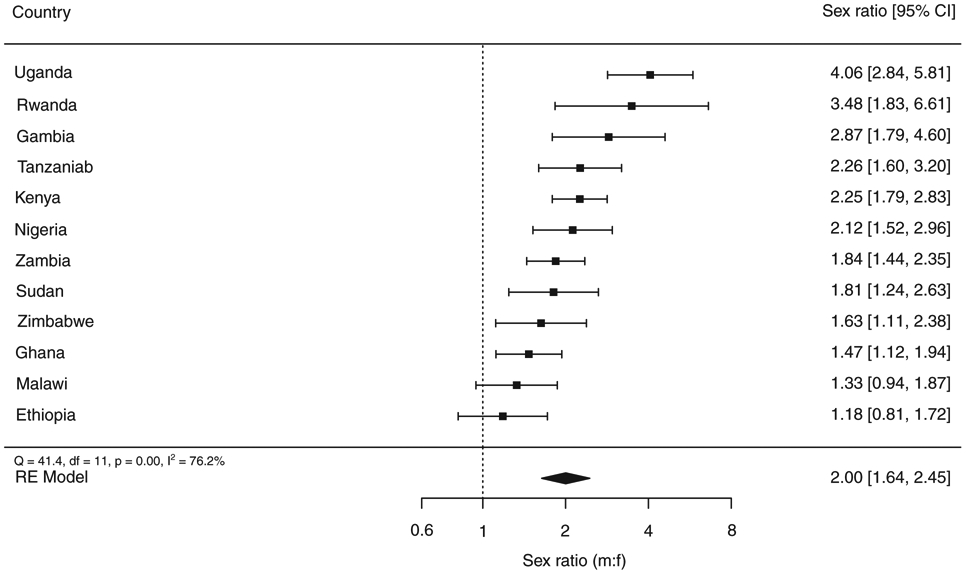
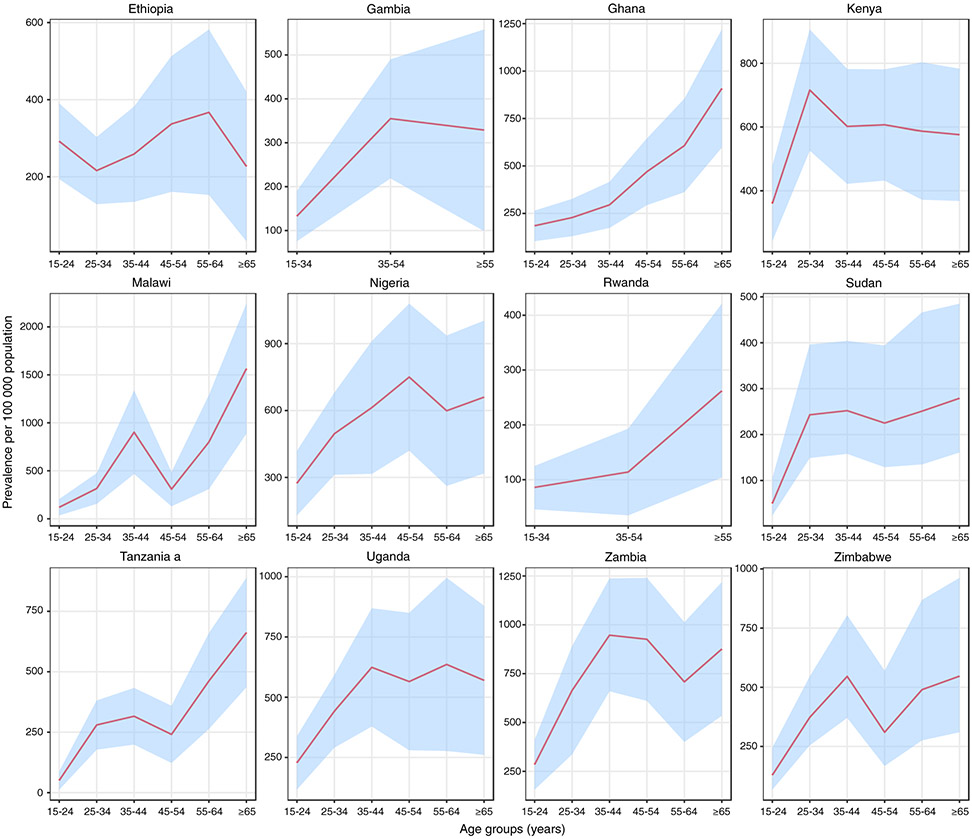
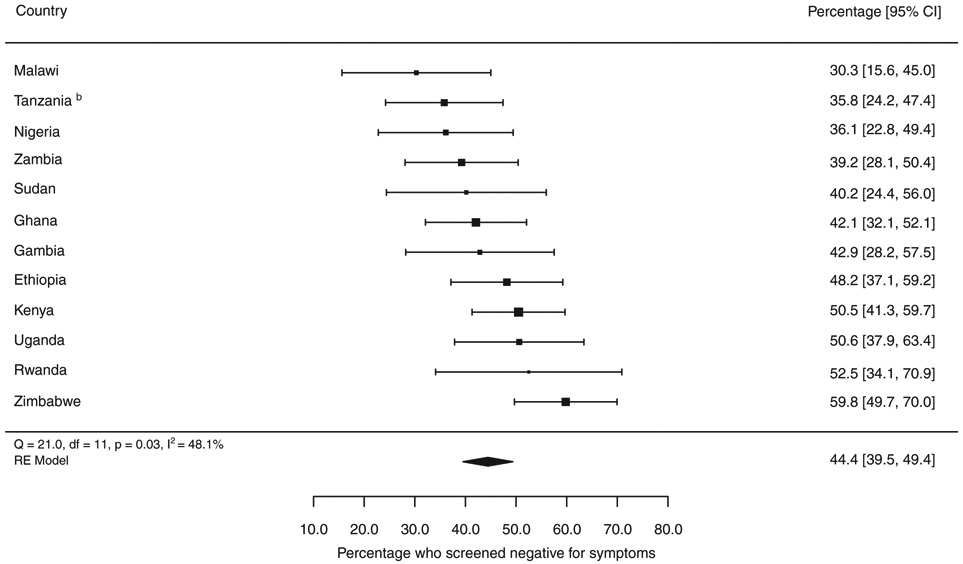
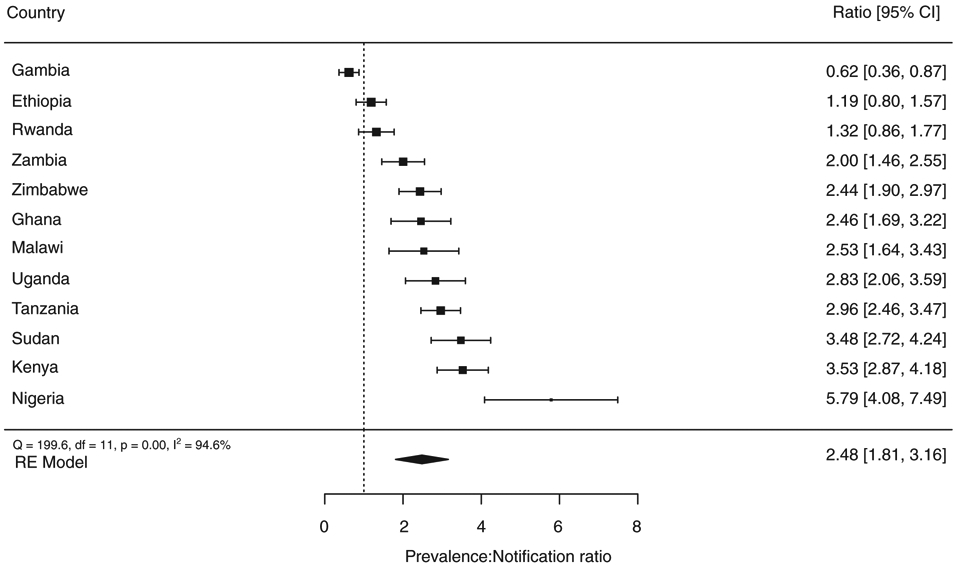
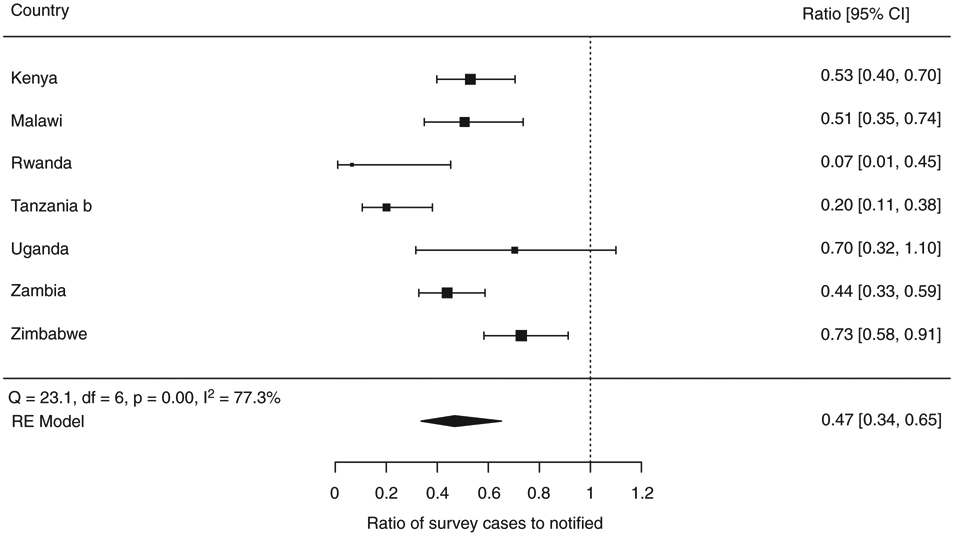
Results: Twelve surveys completed in Africa were identified: Ethiopia (2010-2011), Gambia (2011-2013), Ghana (2013), Kenya (2015-2016), Malawi (2013-2014), Nigeria (2012), Rwanda (2012), Sudan (2013-2014), Tanzania (2011-2012), Uganda (2014-2015), Zambia (2013-2014) and Zimbabwe (2014). The eligible population in all surveys was people aged ≥15 years who met residency criteria. In total 588 105 individuals participated, equivalent to 82% (range 57-96%) of those eligible. The prevalence of bacteriologically confirmed pulmonary TB disease in those ≥15 years varied from 119 (95% CI 79-160) per 100 000 population in Rwanda and 638 (95% CI 502-774) per 100 000 population in Zambia. The male:female ratio was 2.0 overall, ranging from 1.2 (Ethiopia) to 4.1 (Uganda). Prevalence per 100 000 population generally increased with age, but the absolute number of cases was usually highest among those aged 35-44 years. Of identified TB cases, 44% (95% CI 40-49) did not report TB symptoms during screening and were only identified as eligible for diagnostic testing due to an abnormal chest X-ray. The overall ratio of prevalence to case notifications was 2.5 (95% CI 1.8-3.2) and was consistently higher for men than women. Many participants who did report TB symptoms had not sought care; those that had were more likely to seek care in a public health facility. HIV prevalence was systematically lower among prevalent cases than officially notified TB patients with an overall ratio of 0.5 (95% CI 0.3-0.7). The two main study limitations were that none of the surveys included people <15 years, and 5 of 12 surveys did not have data on HIV status.
Conclusions: National TB prevalence surveys implemented in Africa between 2010 and 2016 have contributed substantial new evidence about the burden of TB disease, its distribution by age and sex, and gaps in TB detection and treatment. Policies and practices to improve access to health services and reduce under-reporting of detected TB cases are needed, especially among men. All surveys provide a valuable baseline for future assessment of trends in TB disease burden.
OBJECTIF ET MÉTHODES: Dans le monde entier, la tuberculose (TB) est la principale cause de décès par un seul agent infectieux. Dans de nombreux pays, les surveillances nationales de prévalence de la TB sont le seul moyen de mesurer de manière fiable la charge de la TB et peuvent également fournir d'autres données pour éclairer les efforts nationaux visant à améliorer la détection et le traitement de la TB. Notre objectif était de synthétiser les résultats et les leçons tirées des surveillances nationales réalisées en Afrique entre 2008 et 2016, pour complémenter une analyse précédente pour l'Asie. RÉSULTATS: Douze surveillances réalisées en Afrique ont été identifiés: Ethiopie (2010-2011), Gambie (2011-2013), Ghana (2013), Kenya (2015-2016), Malawi (2013-2014), Nigeria (2012), Rwanda (2012), Soudan (2013-2014 ), Tanzanie (2011-2012), Ouganda (2014-2015), Zambie (2013-2014) et Zimbabwe (2014). La population éligible dans toutes les surveillances était des personnes ≥15 ans qui répondaient aux critères de résidence. Au total, 588.105 personnes ont participé, ce qui équivaut à 82% (entre 57% et 96% ) des personnes éligibles. La prévalence de la TB pulmonaire bactériologiquement confirmée chez les ≥15 ans variait de 119 (IC95%: 79-160) pour 100.000 habitants au Rwanda et 638 (IC95%: 502 à 774) pour 100.000 habitants en Zambie. Le ratio hommes/femmes était globalement de 2,0, allant de 1,2 (Ethiopie) à 4,1 (Ouganda). La prévalence pour 100.000 habitants augmentait généralement avec l'âge, mais le nombre absolu de cas était généralement le plus élevé chez les 35 à 44 ans. Parmi les cas de TB identifiés, 44% (IC95%: 40-49) n'ont pas rapporté de symptômes de TB lors du dépistage et n'ont été identifiés comme éligibles aux tests de diagnostic qu'en raison d'une radiographie pulmonaire anormale. Le rapport global entre la prévalence et les notifications de cas était de 2,5 (IC95%: 1,8-3,2) et était systématiquement plus élevé pour les hommes que pour les femmes. De nombreux participants qui avaient rapporté des symptômes de TB n'avaient pas recherché des soins; ceux qui en avaient étaient plus susceptibles de rechercher des soins dans un établissement de santé publique. La prévalence du VIH était systématiquement plus faible parmi les cas prévalents que chez les patients TB officiellement notifiés avec un rapport global de 0,5 (IC95% 0,3 - 0,7). Les deux principales limitations de l'étude étaient les suivantes: aucune des surveillances n'incluait des personnes de moins de 15 ans et 5 des 12 surveillances ne contenaient pas de données sur le statut VIH. CONCLUSIONS: Les surveillances nationales sur la prévalence de la TB en Afrique menées entre 2010 et 2016 ont fourni de nouvelles données sur la charge de morbidité de la TB, la répartition par âge et par sexe, et les lacunes dans la détection et le traitement de la TB. Des politiques et des pratiques pour améliorer l'accès aux services de santé et réduire la sous-déclaration des cas de TB détectés sont nécessaires, en particulier chez les hommes. Toutes les surveillances fournissent une base précieuse pour l'évaluation future des tendances de la charge de morbidité TB.
Keywords: Africa; Tuberculosis; epidemiology; prevalence survey; public health.
© 2020 John Wiley & Sons Ltd.
Figures
References
-
- World Health Organization. Global Tuberculosis Report. World Health Organization: Geneva, Switzerland, 2019. https://www.who.int/tb/publications/global_report/en/
-
- United Nations. Millennium development goals. (Available from: http://www.un.org/millenniumgoals/) [10 December 2018].
-
- World Health Organization. The Global Plan to Stop TB, 2006–2015: Actions for Life Towards a World Free of Tuberculosis. World Health Organization: Geneva, Switzerland, 2006. https://www.who.int/tb/features_archive/global_plan_to_stop_tb/en/
-
- World Health Organization. The Stop TB Strategy. World Health Organization: Geneva, Switzerland, 2006. Contract No.: WHO/HTM/TB/2006.368. https://apps.who.int/iris/bitstream/handle/10665/69241/WHO_HTM_STB_2006....
-
- Onozaki I, Law I, Sismanidis C, Zignol M, Glaziou P, Floyd K. National tuberculosis prevalence surveys in Asia, 1990–2012: an overview of results and lessons learned. Trop Med Int Health 2015: 20: 1128–1145. - PubMed
Publication types
MeSH terms
Grants and funding
LinkOut - more resources
Full Text Sources
Medical
Miscellaneous
