. 2020 Oct 15;5(20):e141217.
doi: 10.1172/jci.insight.141217.

Liver epithelial focal adhesion kinase modulates fibrogenesis and hedgehog signaling

Affiliations

Liver epithelial focal adhesion kinase modulates fibrogenesis and hedgehog signaling

Yun Weng et al. JCI Insight. .

Abstract

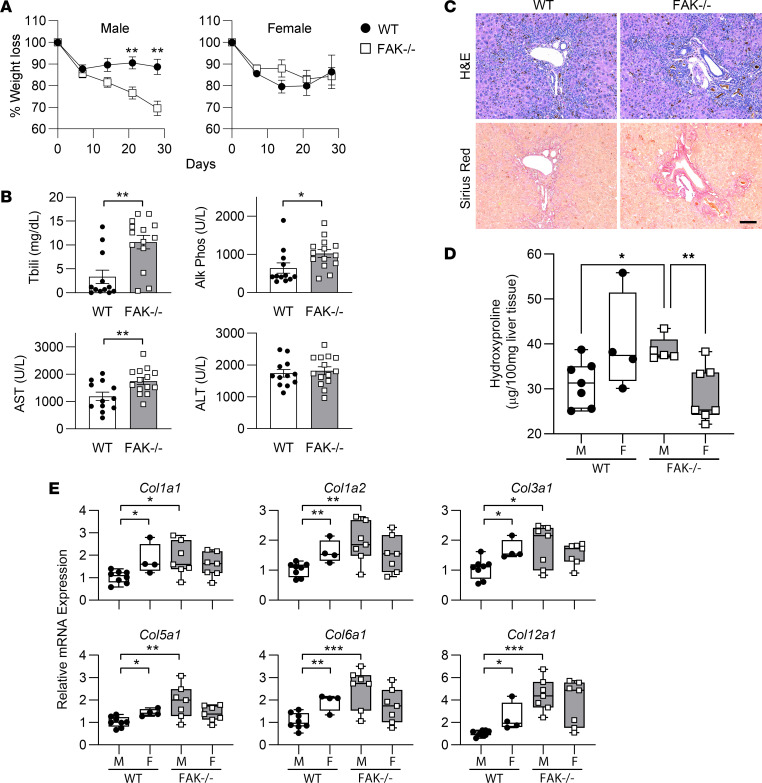
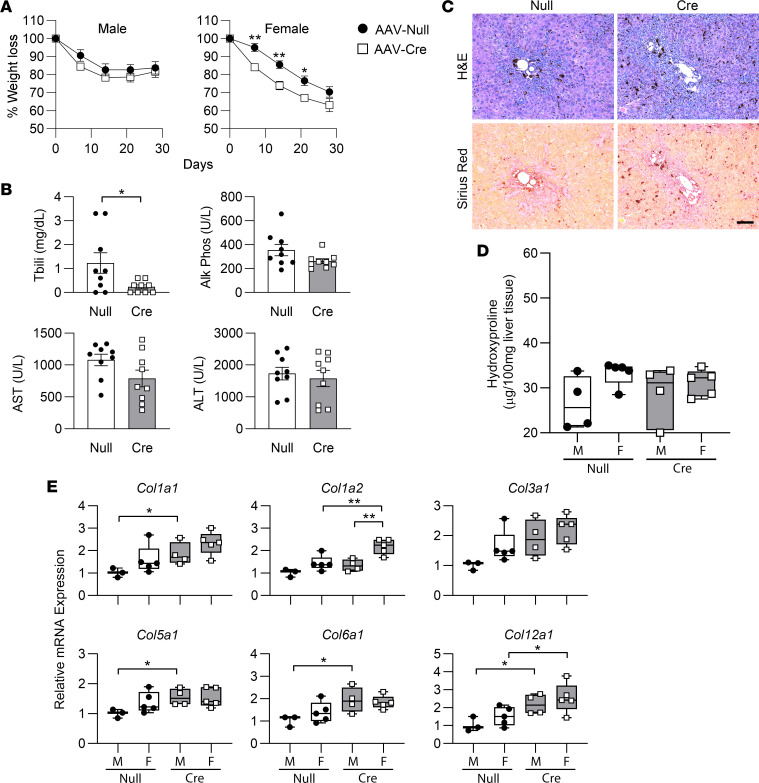
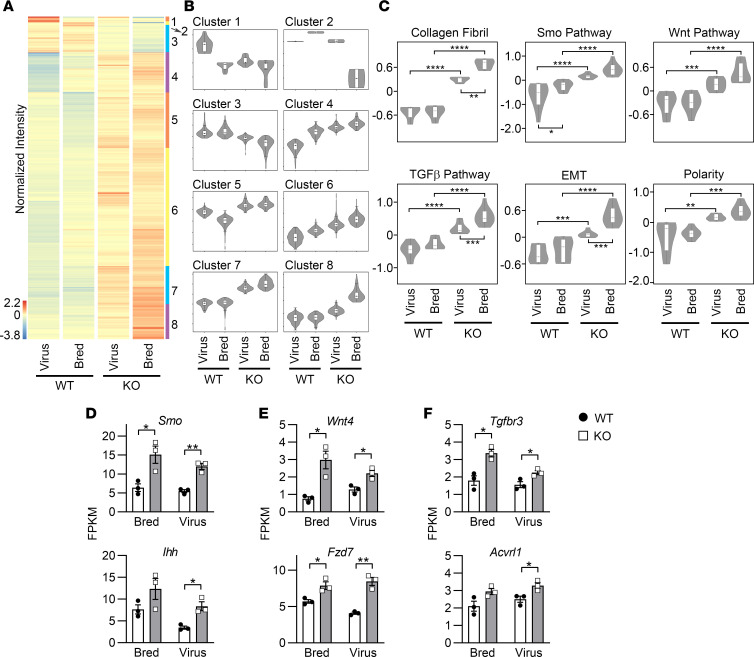
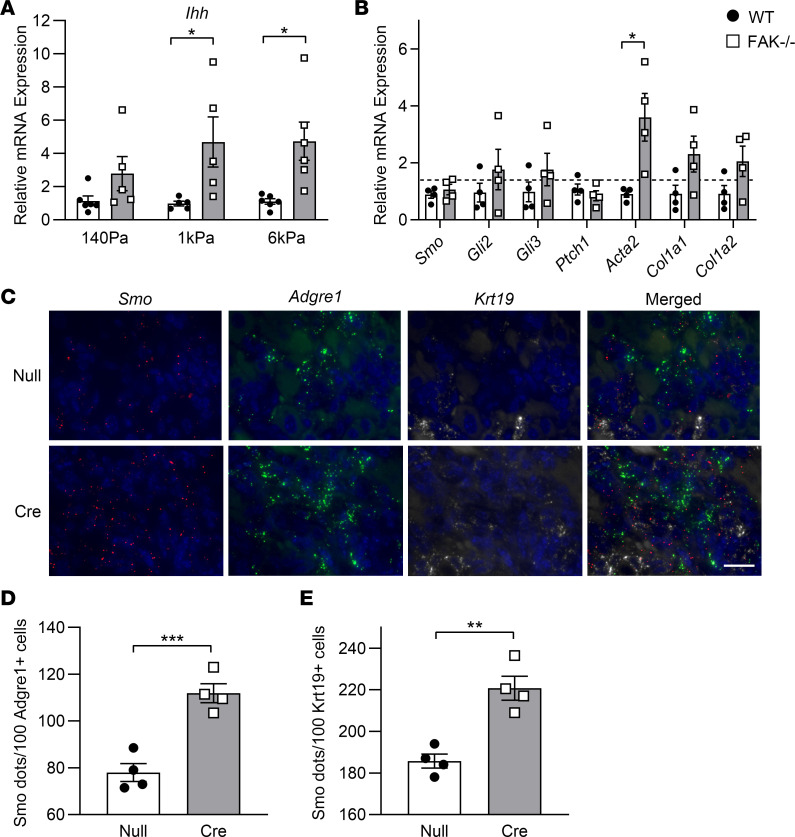
Focal adhesion kinase (FAK) is an important mediator of extracellular matrix-integrin mechano-signal transduction that regulates cell motility, survival, and proliferation. As such, FAK is being investigated as a potential therapeutic target for malignant and fibrotic diseases, and numerous clinical trials of FAK inhibitors are underway. The function of FAK in nonmalignant, nonmotile epithelial cells is not well understood. We previously showed that hepatocytes demonstrated activated FAK near stiff collagen tracts in fibrotic livers. In this study, we examined the role of liver epithelial FAK by inducing fibrotic liver disease in mice with liver epithelial FAK deficiency. We found that mice that lacked FAK in liver epithelial cells developed more severe liver injury and worse fibrosis as compared with controls. Increased fibrosis in liver epithelial FAK-deficient mice was linked to the activation of several profibrotic pathways, including the hedgehog/smoothened pathway. FAK-deficient hepatocytes produced increased Indian hedgehog in a manner dependent on matrix stiffness. Furthermore, expression of the hedgehog receptor, smoothened, was increased in macrophages and biliary cells of hepatocyte-specific FAK-deficient fibrotic livers. These results indicate that liver epithelial FAK has important regulatory roles in the response to liver injury and progression of fibrosis.

Keywords: Cell Biology; Fibrosis; Hepatology; Integrins; Signal transduction.


Conflict of interest statement

Conflict of interest: The authors have declared that no conflict of interest exists.

Figures

Figure 1
Figure 1. Whole-liver tissue or isolated hepatocytes from adult 6- to 8-week-old FAKfl/fl Alb-Cre+ mice (FAK–/–) or FAKfl/fl Alb-Cre littermate controls (WT) were analyzed by RNA-Seq.
Heatmap shows hierarchical clustering of 782 significantly differentially expressed genes. Each column represents the averaged normalized expression of 4 samples (n = 4). Four major clusters emerged based on expression comparison to WT.
Figure 2
Figure 2. GO analysis of RNA-Seq revealed numerous gene categories that are differentially regulated in whole-liver tissue (Tissue) and isolated hepatocytes (Hep) of adult 6- to 8-week-old FAKfl/fl Alb-Cre+ mice (FAK–/–) compared with FAKfl/fl Alb-Cre littermate controls (WT).
Expression of representative genes are shown for the GO terms (A) coagulation, (B) epithelial cell proliferation, (C) response to stress, and (D) lipid metabolism. Some genes are predominantly expressed in whole-liver tissue and not hepatocytes, indicating a non–parenchymal cell source, and include (E) extracellular matrix and (F) biliary-specific genes. Sample size n = 4 per group; *P < 0.05, **P < 0.01, and ***P < 0.001 by Student’s 2-tailed t test. Data represent individual data points and mean ± SEM. FPKM, fragments per kilobase of transcript per million base pairs.
Figure 3
Figure 3. Male and female FAKfl/fl Alb-Cre+ mice (FAK–/–) or FAKfl/fl Alb-Cre littermate controls (WT) were aged to 6 months.
(A) Serum liver function tests: aspartate transaminase (AST), alanine transaminase (ALT), and alkaline phosphatase (Alk Phos). (B) Representative liver H&E and trichrome histology of 6-month-old male WT and FAK–/– mice. Scale bar: 200 μm. (C) The degree of steatosis as scored by a liver pathologist. For A and C, sample sizes are WT male n = 6, WT female n = 7, FAK–/– male n = 7, and FAK–/– female n = 7. Two-way ANOVA was performed with genotype (WT vs. FAK–/–) and sex (male vs. female) as independent variables; *P < 0.05 by post hoc Tukey’s honestly significant difference test. Data represent individual data points and mean ± SEM.
Figure 4
Figure 4. Male and female FAKfl/fl Alb-Cre+ mice (FAK–/–) or FAKfl/fl Alb-Cre littermate controls (WT) were subjected to bile duct ligation.
(A) Kaplan-Meier survival analysis indicated significantly higher early mortality in FAK–/– mice (male n = 8, female n = 6) compared with WT (male n = 12, female n = 8) after bile duct ligation, P < 0.01 by log-rank test. (B) Representative liver histology of FAK–/– mice that died 1 day after bile duct ligation or survived until day 35. WT controls were sacrificed at the same time points for comparison. Scale bar: 200 μm.
Figure 5
Figure 5. Male and female FAKfl/fl Alb-Cre+ mice (FAK–/–) or FAKfl/fl Alb-Cre littermate controls (WT) were given 0.1% DDC diet to induce liver fibrosis.
(A) Male FAK–/– mice (n = 7) lost significantly more weight than sex-matched controls (n = 12). Linear regression analysis showed that slopes of the 2 lines for male mice were significantly different (P < 0.05). Percentage weight loss in male mice was significantly different comparing WT and FAK–/– by Student’s 2-tailed t test at days 21 and 28, **P < 0.01. Weight loss was not significantly different between female WT (n = 4) and FAK–/– (n = 8). Data represent mean ± SEM. (B) Serum liver function tests for WT (male n = 8, female n = 4) and FAK–/– mice (male n = 7, female n = 7). Data show individual data points and mean ± SEM. Tbili, total bilirubin. (C) Representative liver histology. Scale bar: 100 μm. (D) Liver hydroxyproline content of WT male (M; n = 7) and female (F; n = 4) compared with FAK–/– male (n = 5) and female (n = 7) mice. (E) mRNA expression of various collagen species as determined by qRT-PCR in WT (M, n = 8; F, n = 4) and FAK–/– (M, n = 7; F, n = 7) mice. Two-way ANOVA showed significant interaction between FAK genotype and sex (P < 0.05) for (D) and every collagen species except Col12a1 in E; genotype contributed significantly to the overall variation for Col5a1, Col6a1, and Col12a1 (P < 0.05). Groups were also compared by Student’s 2-tailed t test in B, D, and E, *P < 0.05, **P < 0.01, and ***P < 0.001. Box plots show individual data points, median, interquartile range, and range.
Figure 6
Figure 6. Male and female FAKfl/fl mice were treated with AAV8-TBG-Cre (AAV-Cre) or AAV8-TBG-Null (AAV-Null) and then given 0.1% DDC diet to induce liver fibrosis.
(A) Weight changes were not significantly different between male AAV-Null (n = 7) and AAV-Cre (n = 7) mice. Percentage weight loss in female mice was significantly different between AAV-Null (n = 5) and AAV-Cre (n = 5) at days 7, 14, and 21 by Student’s 2-tailed t test (*P < 0.05, **P < 0.01). Linear regression analysis showed that elevations of the AAV-Null and AAV-Cre female weight loss lines were significantly different (P < 0.0001). Data represent mean ± SEM. (B) Serum liver function tests for AAV-Null (male n = 4, female n = 5) and AAV-Cre mice (male n = 4, female n = 5). Data show individual data points and mean ± SEM. (C) Representative liver histology. Scale bar: 100 μm. (D) Liver hydroxyproline content of AAV-Null male (M; n = 4) and female (F; n = 5) compared with AAV-Cre male (n = 4) and female (n = 5) mice. (E) mRNA expression of various collagen species as determined by qRT-PCR in AAV-Null (M, n = 4; F, n = 5) and AAV-Cre (M, n = 4; F, n = 5) mice. For all collagen genes, 2-way ANOVA showed no significant interaction between AAV genotype and sex, whereas genotype contributed significantly to the overall variation (P < 0.05). For B and E, *P < 0.05 and **P < 0.01 by Student’s 2-tailed t test. Box plots show individual data points, median, interquartile range, and range.
Figure 7
Figure 7. FAKfl/fl mice treated with AAV8-TBG-Null (Virus WT) or AAV8-TBG-Cre (Virus KO), as well as FAKfl/fl Alb-Cre (Bred WT) and FAKfl/fl Alb-Cre+ (Bred KO) mice, were given 0.1% DDC diet to induce liver fibrosis.
Whole-liver tissue from these mice was analyzed by RNA-Seq. (A) Heatmap shows hierarchical clustering of 896 significantly differentially expressed genes. Each column represents the averaged normalized expression of 3 samples (n = 3). (B) There were 8 gene clusters based upon expression patterns across the 4 groups. Cluster 1 contained 16 genes; cluster 2, 2 genes; cluster 3, 82 genes; cluster 4, 110 genes; cluster 5, 156 genes; cluster 6, 327 genes; cluster 7, 110 genes; and cluster 8, 93 genes. (C) GO analysis identified several processes and pathways that were upregulated in KO mice in both Virus and Bred methods of FAK deletion. Two-way ANOVA showed that there was significant interaction between the method of FAK deletion (Virus vs. Bred) and the genotype (WT vs. KO) for differentially regulated genes in the collagen fibril and epithelial-mesenchymal transition (EMT) categories (P < 0.05). The method of FAK deletion was a significant source of variation for collagen fibril, Smo, TGF-β, and EMT pathways (P < 0.01). For all 6 categories, genotype was a significant source of variation (P < 0.0001). Post hoc Tukey’s honestly significant difference test between the groups showed *P < 0.05, **P < 0.01, ***P < 0.001, and ****P < 0.0001. Expression levels of representative genes in the (D) Smo, (E) Wnt, and (F) TGF-β pathways were compared by Student’s 2-tailed t test, *P < 0.05 and **P < 0.01. For DF, sample size was 3 per group (n = 3). Data represent individual data points and mean ± SEM.
Figure 8
Figure 8. Hh/Smo pathway gene expression was determined in FAK-deficient hepatocytes and fibrotic hepatocyte-specific FAK-deficient liver.
(A) Isolated hepatocytes from 6- to 8-week-old FAKfl/fl Alb-Cre (WT) and FAKfl/fl Alb-Cre+ (FAK–/–) mice on normal chow diet were cultured on collagen-coated polyacrylamide gels of 140 Pa, 1 kPa, or 6 kPa stiffness. Ihh mRNA expression was determined by qRT-PCR 24 hours later. Sample size n = 5–6 per group. (B) Stellate cells were isolated from WT and FAK–/– mice with DDC-induced fibrosis. Expression of Hh/Smo pathway genes and stellate cell activation markers was determined by qRT-PCR. Sample size n = 4 per group. (C) Three-color multiplexed RNAscope analysis of Smo, Adgre1, and Krt19 was performed on DDC-induced fibrotic liver tissues of FAKfl/fl mice treated with AAV8-TBG-Null (Null) or AAV8-TBG-Cre (Cre). Images are representative of n = 4 per group. Scale bar: 20 μm. (D) Number of Smo+ dots that were colocalized with Adgre1+ macrophages. (E) Number of Smo+ dots that were colocalized with Krt19+ biliary cells. For D and E, 10 portal areas were analyzed per mouse, and at least 20 Adgre1+ or Krt19+ cells were analyzed per portal area; sample size was n = 4 per group. *P < 0.05, **P < 0.01, and ***P < 0.001 by Student’s 2-tailed t test. Data represent individual data points and mean ± SEM.

Similar articles

Cited by

References

    1. Geiger B, Bershadsky A, Pankov R, Yamada KM. Transmembrane crosstalk between the extracellular matrix--cytoskeleton crosstalk. Nat Rev Mol Cell Biol. 2001;2(11):793–805. doi: 10.1038/35099066. - DOI - PubMed
    1. Wozniak MA, Modzelewska K, Kwong L, Keely PJ. Focal adhesion regulation of cell behavior. Biochim Biophys Acta. 2004;1692(2-3):103–119. - PubMed
    1. Kleinschmidt EG, Schlaepfer DD. Focal adhesion kinase signaling in unexpected places. Curr Opin Cell Biol. 2017;45:24–30. doi: 10.1016/j.ceb.2017.01.003. - DOI - PMC - PubMed
    1. Tomakidi P, Schulz S, Proksch S, Weber W, Steinberg T. Focal adhesion kinase (FAK) perspectives in mechanobiology: implications for cell behaviour. Cell Tissue Res. 2014;357(3):515–526. doi: 10.1007/s00441-014-1945-2. - DOI - PubMed
    1. Ling K, et al. Tyrosine phosphorylation of type Igamma phosphatidylinositol phosphate kinase by Src regulates an integrin-talin switch. J Cell Biol. 2003;163(6):1339–1349. doi: 10.1083/jcb.200310067. - DOI - PMC - PubMed

Publication types

MeSH terms