Review
. 2020 Aug 1:180:79-88.
doi: 10.1016/j.ymeth.2020.08.008. Epub 2020 Sep 8.

Structural biology of human GPCR drugs and endogenous ligands - insights from NMR spectroscopy

Affiliations
Review

Structural biology of human GPCR drugs and endogenous ligands - insights from NMR spectroscopy

Guillaume Ferré et al. Methods. .

Abstract

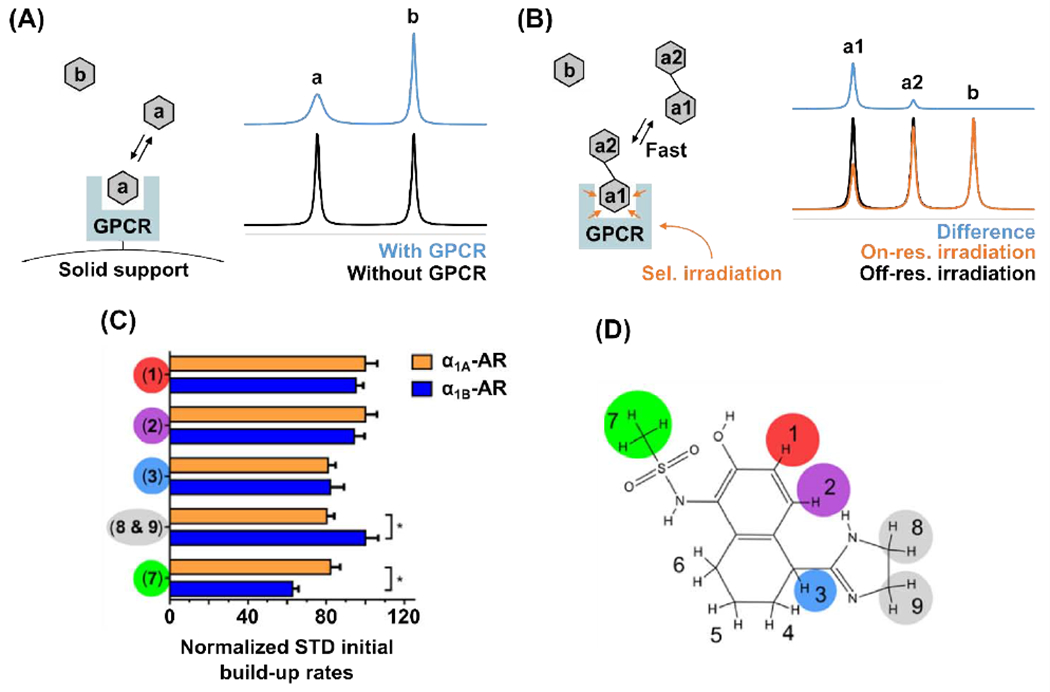
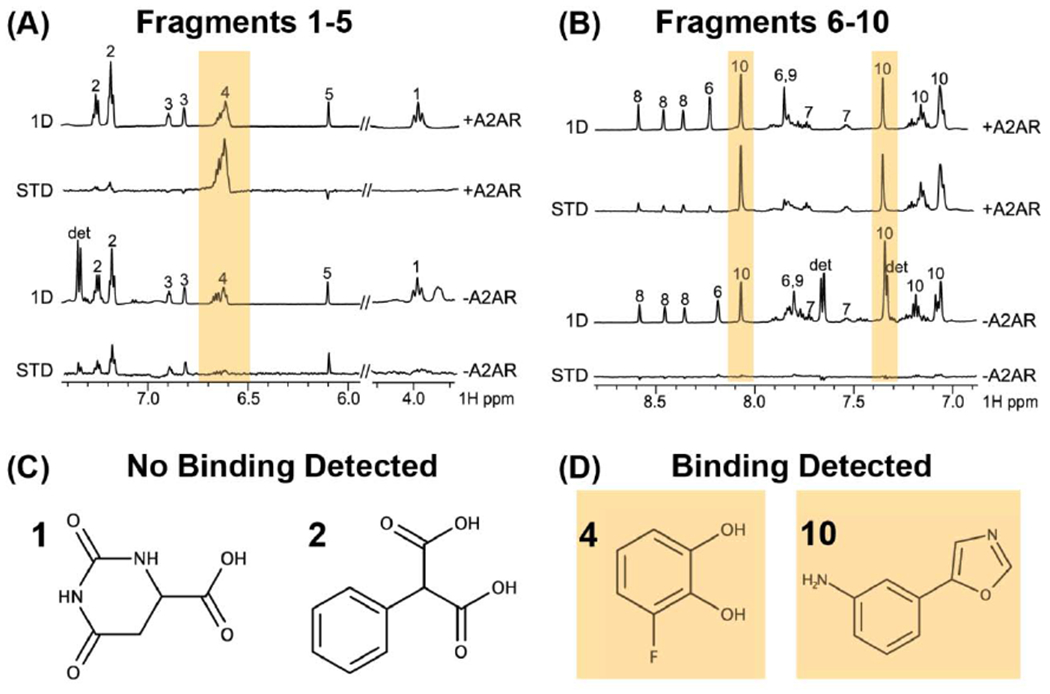
G protein-coupled receptors (GPCRs) represent the largest class of "druggable" proteins in the human genome. For more than a decade, crystal structures and, more recently, cryoEM structures of GPCR complexes have provided unprecedented insight into GPCR drug binding and cell signaling. Nevertheless, structure determination of receptors in complexes with weakly binding molecules or complex polypeptides remains especially challenging, including for hormones, many of which have so far eluded researchers. Nuclear magnetic resonance (NMR) spectroscopy has emerged as a promising approach to determine structures of ligands bound to their receptors and to provide insights into the dynamics of GPCR-bound drugs. The capability to investigate compounds with weak binding affinities has also been leveraged in NMR applications to identify novel lead compounds in drug screening campaigns. We review recent structural biology studies of GPCR ligands by NMR, highlighting new methodologies enabling studies of GPCRs with native sequences and in native-like membrane environments that provide insights into important drugs and endogenous ligands.

Keywords: Endogenous ligands; GPCR drugs; Integrative structural biology; Membrane proteins; NMR spectroscopy.


Figures

Figure 1.
Figure 1.
Workflows for determining structures of GPCR bound polypeptides and representative structural ensembles of receptor-bound polypeptides calculated from these approaches. (A) In aqueous solutions, trNOE restraints and chemical shifts are used as input data to calculate receptor-bound polypeptide structures, and (B) in solids, chemical shifts provide experimental restraints and are also used to evaluate molecular models. (C and D) Two examples from the first approach are Dynorphin bound to the κ-opioid receptor (KOP; PDB ID 2N2F) [46] (C) and Ghrelin bound to the growth hormone secretagogue receptor (GHSR; PDB ID 6H3E) [27, 37] shown with ordered side chains in stick representation (one conformer) or lines (other conformers) (D). (E and F) Two examples from the second approach are desArg-kallidin (DAKD) bound to the bradykinin 1 receptor (B1R; PDB ID 6F3Y) [29] (E) and Neuropeptide Y (NPY) bound to the Y2 receptor (Y2R) [33] (F). Panels C, D, E, and F adapted with permission from references [37], [27], [33], and [60].
Figure 2.
Figure 2.
1H-detected solid and solution NMR data of the chemokine IL-8 enable visualization of interactions of the polypeptide with its receptor CXCR1. (A and B) solid state MAS NMR data of [2H, 15N] IL-8 bound to unlabeled full-length CXCR1, and (C and D) bound to an unlabeled CXCR1 variant where the first 38 residues have been removed. 1H-detected solid state NMR data (red and green) are superimposed on solution NMR spectra of unbound IL-8 (grey). The red spectra were measured using cross-polarization (CP) magnetization transfers, which yield spectra containing predominantly signals from more rigid regions of IL-8. The green spectra were measured using INEPT transfers, which yield spectra containing signals from more flexible regions of IL-8. (E and F) Solution NMR structure of IL-8 (PDB ID 5WDZ) where the individual residues have been color coded to indicate if they were observed in CP- or INEPT-based solid-state spectra. Comparison of the two patterns of colors mapped onto IL-8 for complexes with full length CXCR1 (E) and the CXCR1 variant with the first 38 residues removed (F) reveals the role of the interaction between the CXCR1 N-terminus and IL-8. Figure adapted with permission from reference [26].
Figure 3.
Figure 3.
Structure of a polypeptide bound to human bradykinin receptor determined by dynamic nuclear polarization (DNP) NMR. (A) Schematic illustrating the basic principles of DNP NMR. The sample contains the polypeptide-bound receptor in a partially deuterated matrix doped with the radical containing molecule AMUPol[81]. Continuous microwave irradiation is applied to the sample, transferring polarization from electrons in the sample to the bound polypeptide. (B) DNP spectra of stable-isotope labeled DAKD polypeptide bound to B1 with microwaves applied (purple) are enhanced by a factor of 169 in sensitivity compared to spectra when microwaves are turned off (black). (C) Assignments of observed signals were accomplished with DNP MAS NMR 2-dimensional 15N-13C TEDOR (top), 13C-13C DQ-SQ (middle), and 1-dimensional TEDOR and REDOR-filtered 13C experiments (bottom). Figure adapted with permission from reference [30].
Figure 4.
Figure 4.
Conformational dynamics of a GPCR neuropeptide in complex with an opioid receptor. (A) 15N R2 relaxation rate constants were measured for stable-isotope labeled dynorphin bound to the KOR (red) and upon addition of the high affinity antagonist JDTic (blue), which displaces the polypeptide from the receptor. (B) Order parameter profile, S2/S2max, derived from experimentally measured R2 relaxation rate constants (grey bars) and MD simulations with the NMR structure of dynorphin docked into a crystal structure of KOR (white bars). (C) NMR structure of dynorphin (blue) superimposed on the crystal structure of JDTic (green) bound to KOR (PDB ID 4DJH). (D) Visualization of order parameters from NMR data displayed on the NMR structure of dynorphin. The relative width of the superimposed cones indicates the magnitude of dynamics. Figure adapted with permission from reference [37].
Figure 5.
Figure 5.
(A and B) Schematic representation of ligand-observed NMR experiments for drug screening: target-immobilized NMR screening (TINS) (A) and saturation transfer difference (STD) (B). In the TINS experiment, detection of the binding of molecule “a” to the receptor is observed by a decrease in signal intensity in the NMR spectrum. In the STD NMR experiment, detection of the binding of molecule “a1-a2” to the receptor is observed as a positive difference between spectra measured with and without RF irradiation applied to the protein target. The difference in signal intensities observed for the two chemical moieties “a1” and “a2” of the compound are due to different spatial proximities of each chemical group to the ligand binding pocket and provide information on the binding mode of the ligand. (C and D) STD NMR enabled epitope mapping of the compound A-61603 to the α1A- and α1B-adrenergic receptors. (C) A histogram of normalized STD NMR build-up rates observed upon binding of A-61603 to α1Aor to α1B. Differences in the normalized STD rates between the different chemical groups indicate which chemical groups of the molecule interact more closely with the receptor, and differences observed between the α1A or to α1B receptors indicates selectivity of the drug for a specific receptor subtype. (D) Chemical structure of A-61603 with numbered chemical groups color coded to correspond with the observed STD NMR signals. Panels C and D adapted from reference [19]
Figure 6.
Figure 6.
NMR identification of small molecule fragments that bind the full length human GPCR A2AAR. (A and B) 1-dimensional 1H NMR spectra of solutions containing mixtures of small molecules recorded in the presence and absence of the receptor. Saturation transfer different (STD) data were obtained from subtracting spectra recorded with and without RF irradiation applied to the target receptor. Yellow bars highlight signals detected in the STD NMR data that indicate the observation of the small molecule binding to the receptor. (C and D) Chemical structures of molecules that were observed to not bind A2AAR (C) and to bind A2AAR (D) identified from the STD NMR experiments. Figure was adapted with permission from reference [69] under a Creative Commons Attribution 4.0 International License (https://creativecommons.org/licenses/by/4.0/)

Similar articles

Cited by

References

    1. Hauser AS, Attwood MM, Rask-Andersen M, Schiöth HB, Gloriam DE, Trends in GPCR drug discovery: new agents, targets and indications, Nat. Rev. Drug Discov 16(12) (2017) 829–842. - PMC - PubMed
    1. Wacker D, Stevens RC, Roth BL, How ligands illuminate GPCR molecular pharmacology, Cell 170(3) (2017)414–427. - PMC - PubMed
    1. Manglik A, Kim TH, Masureel M, Altenbach C, Yang Z, Hilger D, Lerch MT, Kobilka TS, Thian FS, Hubbell WL, Prosser RS, Kobilka BK, Structural insights into the dynamic process of β2-adrenergic receptor signaling, Cell 161(5) (2015) 1101–11. - PMC - PubMed
    1. Nygaard R, Zou Y, Dror RO, Mildorf TJ, Arlow DH, Manglik A, Pan AC, Liu CW, Fung JJ, Bokoch MP, Thian FS, Kobilka TS, Shaw DE, Mueller L, Prosser RS, Kobilka BK, The dynamic process of β2-adrenergic receptor activation, Cell 152(3) (2013) 532–42. - PMC - PubMed
    1. Shiraishi Y, Natsume M, Kofuku Y, Imai S, Nakata K, Mizukoshi T, Ueda T, Iwaï H, Shimada I, Phosphorylation-induced conformation of β2-adrenoceptor related to arrestin recruitment revealed by NMR, Nat. Commun 9(1) (2018) 194. - PMC - PubMed

Publication types

LinkOut - more resources