. 2020 Aug 8:22:50-61.
doi: 10.1016/j.omtn.2020.08.005. Online ahead of print.

Direct Delivery of Apatite Nanoparticle-Encapsulated siRNA Targeting TIMP-1 for Intractable Abnormal Scars

Affiliations

Direct Delivery of Apatite Nanoparticle-Encapsulated siRNA Targeting TIMP-1 for Intractable Abnormal Scars

Masayo Aoki et al. Mol Ther Nucleic Acids. .

Abstract

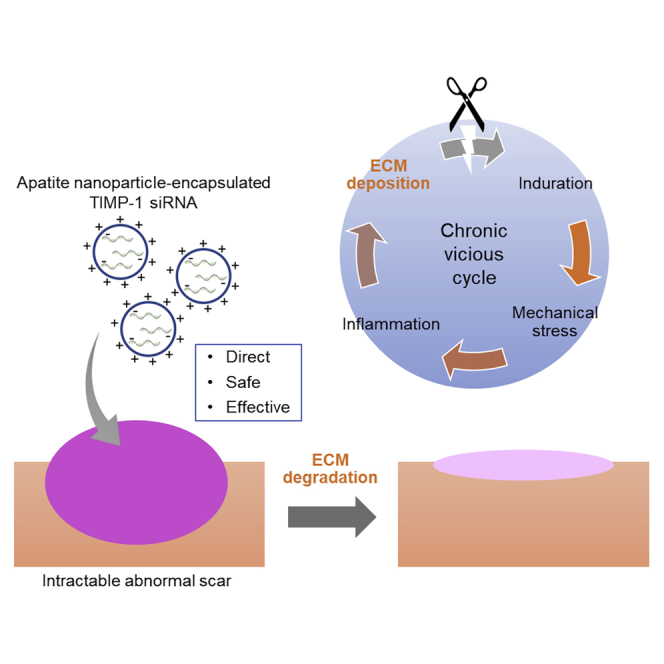
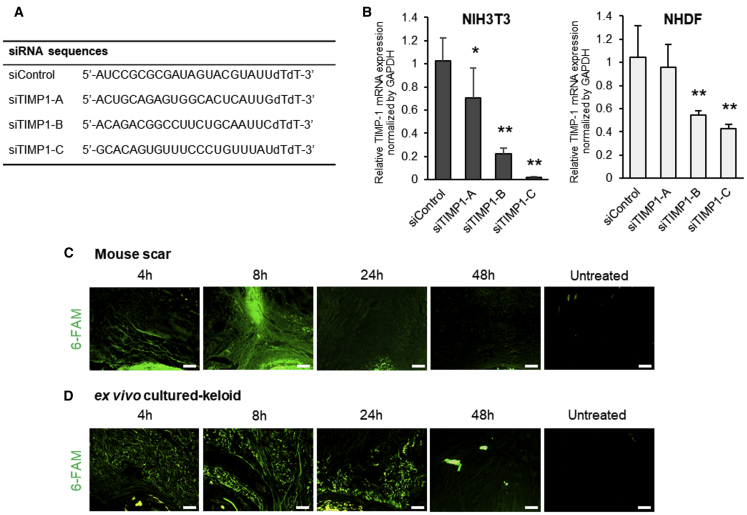
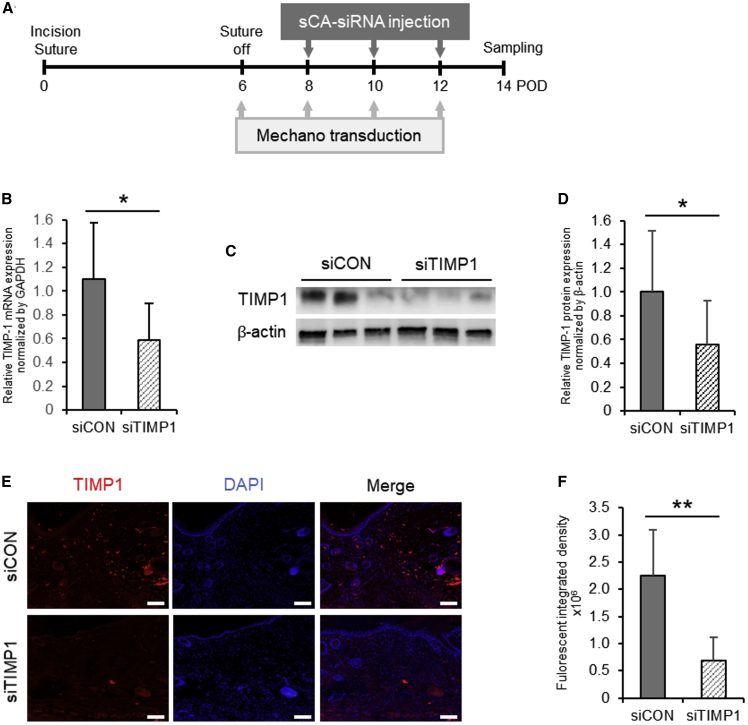
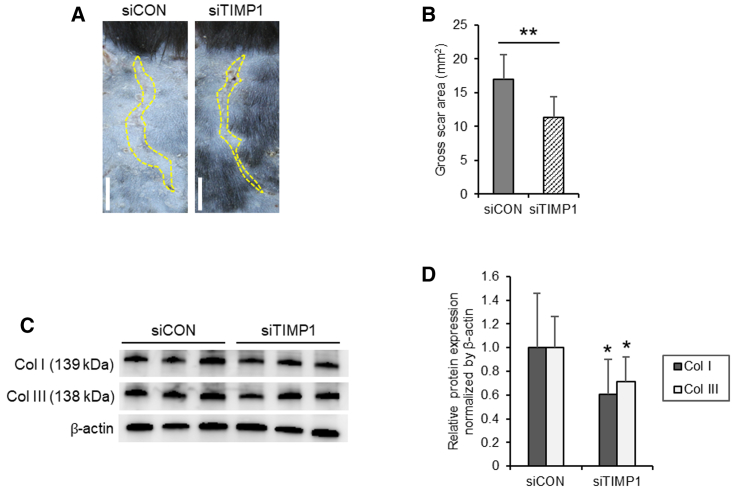
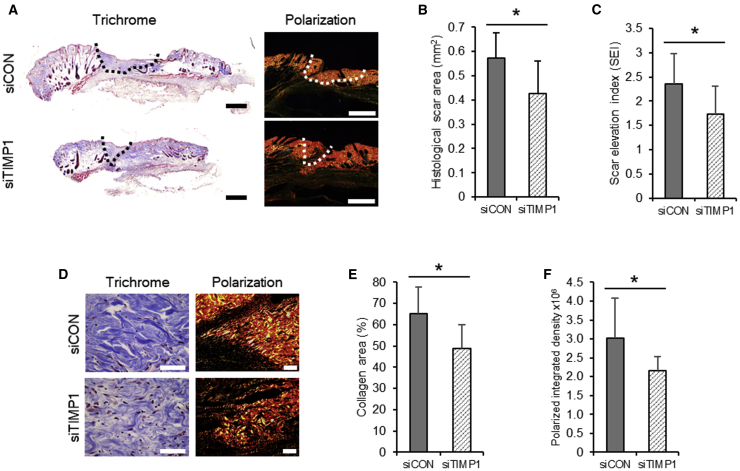
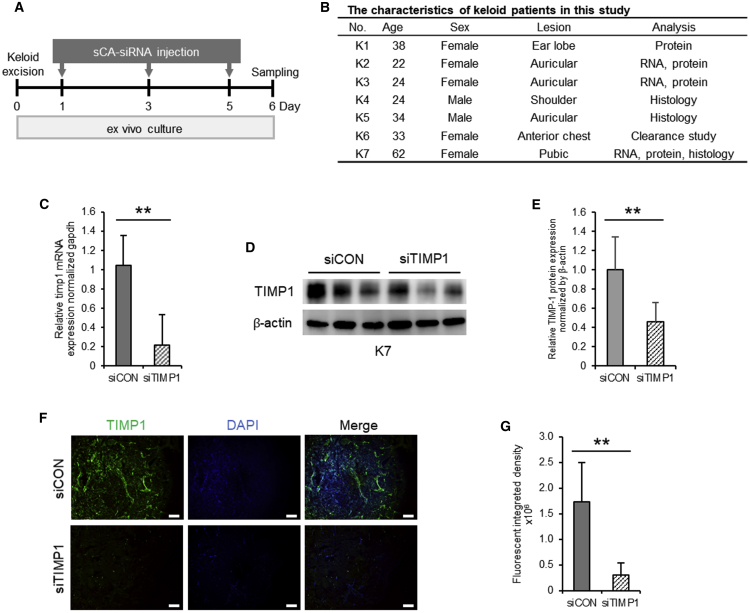
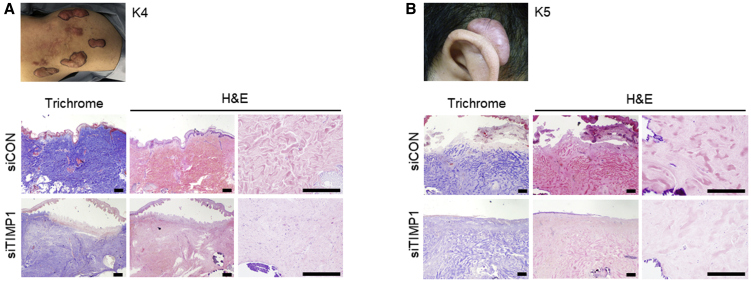
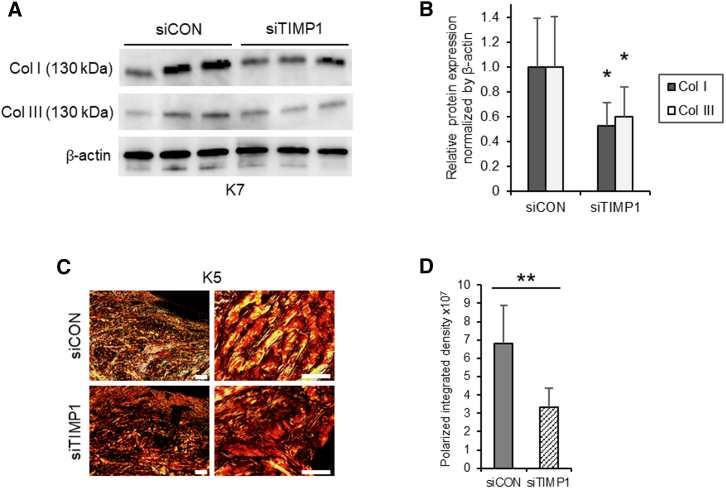
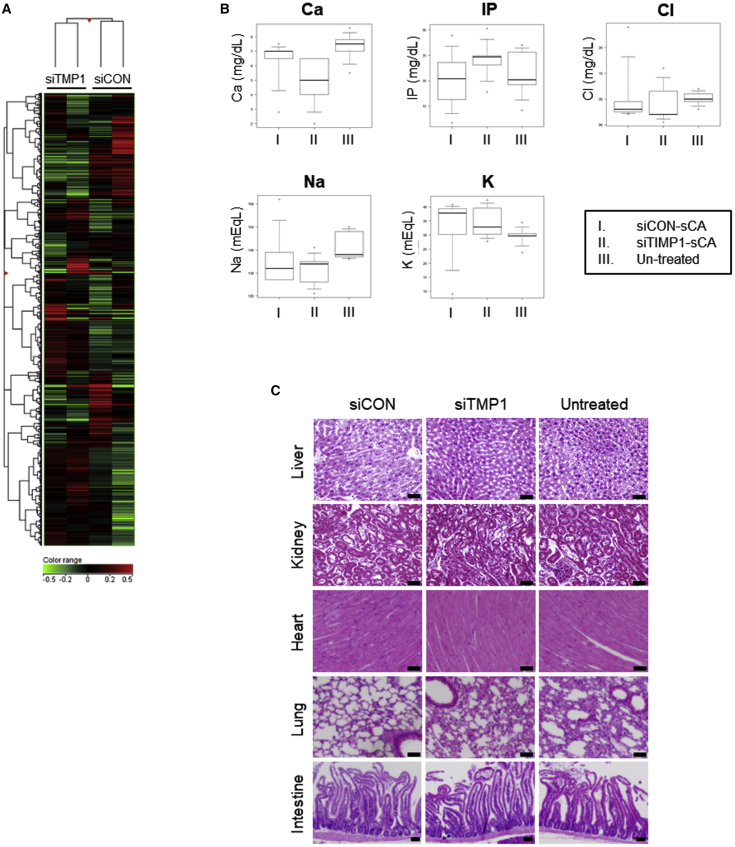
Hypertrophic scars (HSs) and keloids are histologically characterized by excessive extracellular matrix (ECM) deposition. ECM deposition depends on the balance between matrix metalloproteinases (MMPs) and tissue inhibitors of metalloproteases (TIMPs). TIMP-1 has been linked to ECM degradation and is therefore a promising therapeutic strategy. In this study, we generated super carbonate apatite (sCA) nanoparticle-encapsulated TIMP-1 small interfering RNA (siRNA) (siTIMP1) preparations and examined the effect of local injections on mouse HSs and on ex vivo-cultured keloids. The sCA-siTIMP1 injections significantly reduced scar formation, scar cross-sectional areas, collagen densities, and collagen types I and III levels in the lesions. None of the mice died or exhibited abnormal endpoints. Apatite accumulation was not detected in the other organs. In an ex vivo keloid tissue culture system, sCA-siTIMP1 injections reduced the thickness and complexity of collagen bundles. Our results showed that topical sCA-siTIMP1 injections during mechanical stress-induced HS development reduced scar size. When keloids were injected three times with sCA-siTIMP1 during 6 days, keloidal collagen levels decreased substantially. Accordingly, sCA-siRNA delivery may be an effective approach for keloid treatment, and further investigations are needed to enable its practical use.

Keywords: ECM; TIMP; abnormal scar; hyprtrophic scar; keloid; nanoparticle; siRNA.


Figures

None
Graphical abstract
Figure 1
Figure 1
siRNA Design, Knockdown Efficiency In Vitro, and Clearance of sCA-siRNA after Injection into Murine HSs and Cultured Keloids (A) siRNA sequences used in this study. (B) qRT-PCR analysis of TIMP1 mRNA levels in NIH 3T3 cells and NHDFs 18 h after transfection with three transduction units per cell of three sCA-siRNAs targeting TIMP-1 (siTIMP1) (A–C) or a control sequence (siCON). All values were normalized to the level of GAPDH (n = 6 wells per treatment per cell type). (C and D) Murine HSs (C) and cultured keloids (representative of four mice) (D) were injected with 6-FAM-labeled sCA-siCON and subjected to fluorescence imaging 4, 8, 24, and 48 h later (scale bars, 100 μm). The values shown are means ± SD. ∗p < 0.05, ∗∗p < 0.01, as determined by the Tukey-Kramer method after one-way factorial ANOVA.
Figure 2
Figure 2
Effectiveness of sCA-siRNA-Mediated TIMP-1 Knockdown in Murine HSs (A) Schematic depiction of the schedule for the generation of mechanical force-induced HSs in mice and injection with sCA-siTIMP1 or siCON. This experiment was repeated independently five times with three to four mice per treatment, and the RNA and protein levels estimated in two and four of these experiments were used for the analyses, respectively. (B) qRT-PCR analysis of TIMP1 mRNA levels in the siCON- and siTIMP1-injected HSs on day 14. All values were normalized to the level of GAPDH (n = 12 mice per treatment). (C) Western blot showing TIMP-1 protein expression in the siCON- and siTIMP1-injected HSs on day 14. (D) Quantitation of the day 14 western blot data. All values were normalized to the level of β-actin (n = 12 mice per treatment). ∗∗p < 0.01, as determined by a Wilcoxon signed-rank test. (E) Representative images after fluorescence immunoassay of TIMP-1 expression in the siCON- and siTIMP1-treated HSs on day 14 (scale bars, 100 μm). (F) Quantitation of the integrated fluorescent density on day 14 (n = 9 mice per treatment). ∗p < 0.05, as determined by a Student’s t test or Welch’s t test after F tests. All values are means ± SD.
Figure 3
Figure 3
Effect of Injections of sCA-siRNA against TIMP-1 on Murine HS Growth and Collagen Expression (A) Representative images of the gross scar area (dotted lines) of the sCA-siTIMP1- and sCA-siCON-injected HSs on day 14 (scale bars, 5 mm). (B) Quantitation of the gross scar area on day 14 (n = 16 mice per treatment). (C) Western blot images showing collagen type I (Col I) and III (Col III) protein expression in the siCON- and siTIMP1-injected HSs on day 14. (D) Quantitation of the day 14 western blot data. All values were normalized to the level of β-actin (n = 12 mice per treatment). All values are means ± SD. ∗p < 0.05, ∗∗p < 0.01, as determined by a Student’s t test or Welch’s t test after F tests.
Figure 4
Figure 4
Histological Effect of the Injection of sCA-siRNA against TIMP-1 on Murine HS Growth and Collagen Density (A) Representative images of the Masson’s trichrome-stained cross-sectional scar area (dotted line) (scale bar: 500 μm) of the siCON- and siTIMP1-injected HSs on day 14. Polarization images of the same samples are also shown (scale bars, 500 μm). (B) Quantitation of the cross-sectional scar area on day 14 (n = 9 mice per treatment). (C) Cross-sectional scar elevation index (SEI) of the siCON- and siTIMP1-injected HSs on day 14 (n = 9 mice per treatment). SEI is defined as the scar thickness divided by the thickness of the adjacent normal skin. (D) Representative images of the Masson’s trichrome-stained collagen density in the siCON- and siTIMP1-injected HSs on day 14 (scale bars, 50 μm). Polarization images of the same samples are also shown (scale bars, 50 μm). (E) Quantitation of the percentage of scar area that was occupied by collagen on day 14 (n = 9 mice per treatment). (F) Quantitation of the polarized integrated density on day 14 (n = 9 mice per treatment). All values are means ± SD. ∗p < 0.05, as determined by a Student’s t test or Welch’s t test after F tests.
Figure 5
Figure 5
Ability of sCA-siRNA against TIMP-1 to Knock Down TIMP-1 Levels in Ex Vivo-Cultured Keloid Tissues (A) Schematic depiction of the schedule for the injection of ex vivo-cultured keloid tissues with sCA-siTIMP1 or sCA-siCON. (B) Characteristics of patients with keloids included in this study. (C) qRT-PCR analysis of TIMP1 mRNA levels in the siCON- and siTIMP1-injected keloid tissues on day 6. All values were normalized to the level of GAPDH (n = 10 keloid pieces from three patients per treatment). (D) Western blot image showing TIMP-1 protein expression in the siCON- and siTIMP1-injected scars on day 6. (E) Quantitation of the day 14 western blot data. All values were normalized to the level of β-actin (n = 9 keloid pieces from four patients per treatment). (F) Fluorescent TIMP-1-immunostained images of the siCON- and siTIMP1-injected keloid tissues on day 6 (scale bars, 200 μm). (G) Quantitation of the fluorescent integrated density in day 6 (n = 10 keloid pieces from three patients per treatment). All values are means ± SD. ∗p < 0.05, ∗∗p < 0.01, as determined by a Student’s t test or Welch’s t test after F tests.
Figure 6
Figure 6
Effect of Injection with sCA-siTIMP1 on Keloidal Collagen in Ex Vivo-Cultured Keloid Tissues (A and B) Keloids were resected from K4 (a 24-year-old male with a shoulder keloid) (A) and K5 (a 34-year-old male with an auricular keloid) (B). Preoperative findings are shown. The keloids were subjected to ex vivo culture and injected with sCA-siCON or sCA-siTIMP1. Representative images of the keloid tissues on day 6 after Masson’s trichrome and H&E staining are shown (scale bars, 300 μm).
Figure 7
Figure 7
Effect of Injection with sCA-siTIMP1 on Collagen Expression and Density in Ex Vivo-Cultured Keloid Tissues (A) Western blot images showing Col I and Col III protein expression in the siCON- and siTIMP1-injected keloid tissues on day 6. (B) Quantitation of the day 14 western blot data. All values were normalized to the level of β-actin (n = 8 keloid pieces from four patients per treatment). (C) Representative images of polarization microscopy of the same keloid tissues are also shown (scale bars, left, 200 μm; right, 50 μm). (D) Quantitation of the polarized integrated density on day 6 (n = 10 keloid pieces from the three patients per treatment). All values are means ± SD. ∗p < 0.05, ∗∗p < 0.01 as determined by a Student’s t test or Welch’s t test after F tests.
Figure 8
Figure 8
In Vitro Gene Expression, Blood Electrolyte Levels, and Histopathology of the Other Organs in Mice with sCA-siRNA-Injected HSs (A) Heatmap of gene expression profiling in NIH 3T3 cells 18 h after transfection with sCA-encapsulated siRNAs that targeted TIMP-1 (siTIMP1) or a non-targeting siRNA (siCON) (n = 2). (B) The murine HSs were injected with sCA-encapsulated siRNAs as shown in Figure 2A and the effects of the treatment on blood electrolyte levels on day 14 were determined. The electrolytes that were examined were calcium (Ca), inorganic phosphorus (IP), chlorine (Cl), sodium (Na), and potassium (K). (C) The livers, kidneys, hearts, lungs, or intestines of the mice on day 14 were subjected to histology and H&E staining. Representative images are shown (scale bars, 50 μm). All values are means ± SD (n = 8 mice per treatment). The control and TIMP-1 siRNAs did not differ significantly in terms of any of these variables, as determined by the Tukey-Kramer method after one-way factorial ANOVA.

Similar articles

Cited by

References

    1. Jumper N., Paus R., Bayat A. Functional histopathology of keloid disease. Histol. Histopathol. 2015;30:1033–1057. - PubMed
    1. Ehrlich H.P., Desmoulière A., Diegelmann R.F., Cohen I.K., Compton C.C., Garner W.L., Kapanci Y., Gabbiani G. Morphological and immunochemical differences between keloid and hypertrophic scar. Am. J. Pathol. 1994;145:105–113. - PMC - PubMed
    1. Matsumoto N.M., Peng W.X., Aoki M., Akaishi S., Ohashi R., Ogawa R., Naito Z. Histological analysis of hyalinised keloidal collagen formation in earlobe keloids over time: collagen hyalinisation starts in the perivascular area. Int. Wound J. 2017;14:1088–1093. - PMC - PubMed
    1. Lee J.Y., Yang C.C., Chao S.C., Wong T.W. Histopathological differential diagnosis of keloid and hypertrophic scar. Am. J. Dermatopathol. 2004;26:379–384. - PubMed
    1. Ogawa R., Okai K., Tokumura F., Mori K., Ohmori Y., Huang C., Hyakusoku H., Akaishi S. The relationship between skin stretching/contraction and pathologic scarring: the important role of mechanical forces in keloid generation. Wound Repair Regen. 2012;20:149–157. - PubMed