. 2020 Oct 29;136(18):2003-2017.
doi: 10.1182/blood.2019004381.

An intact gut microbiome protects genetically predisposed mice against leukemia

Affiliations

An intact gut microbiome protects genetically predisposed mice against leukemia

Carolina Vicente-Dueñas et al. Blood. .

Abstract

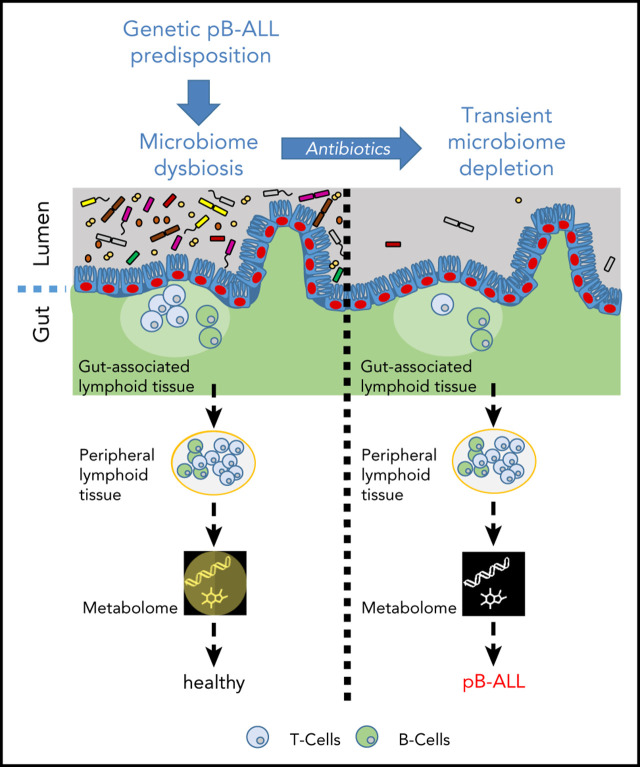
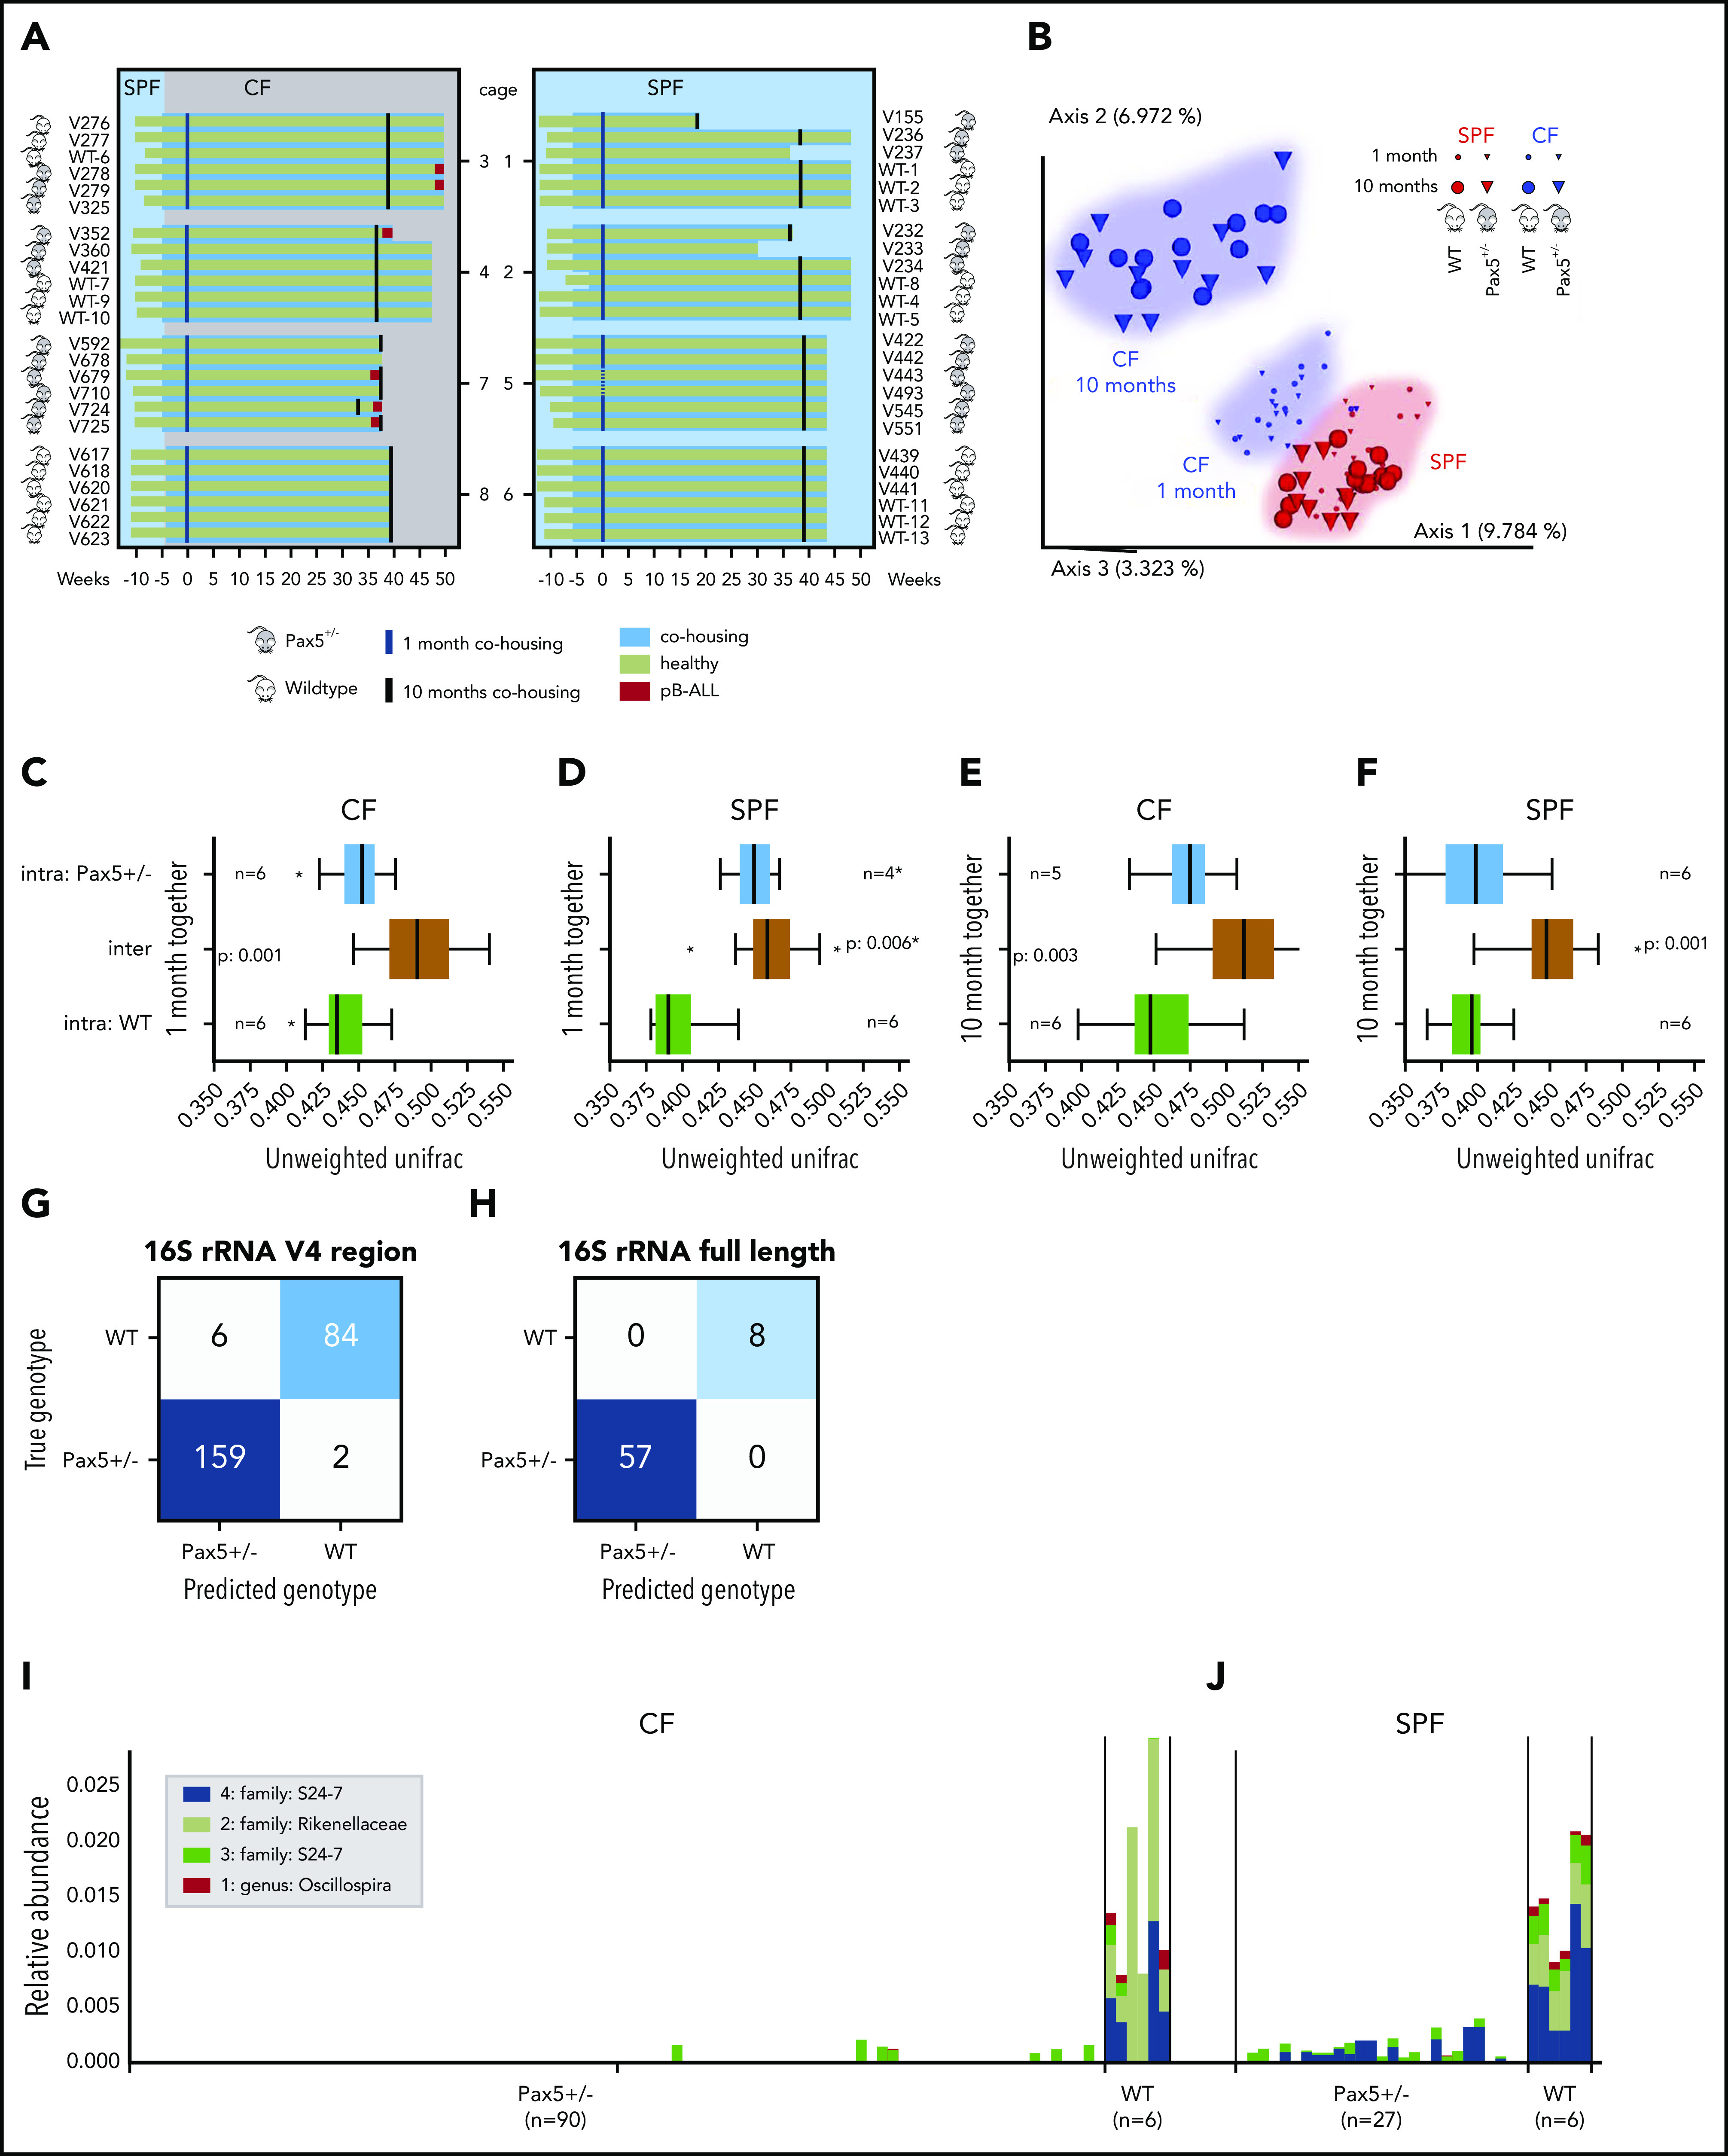
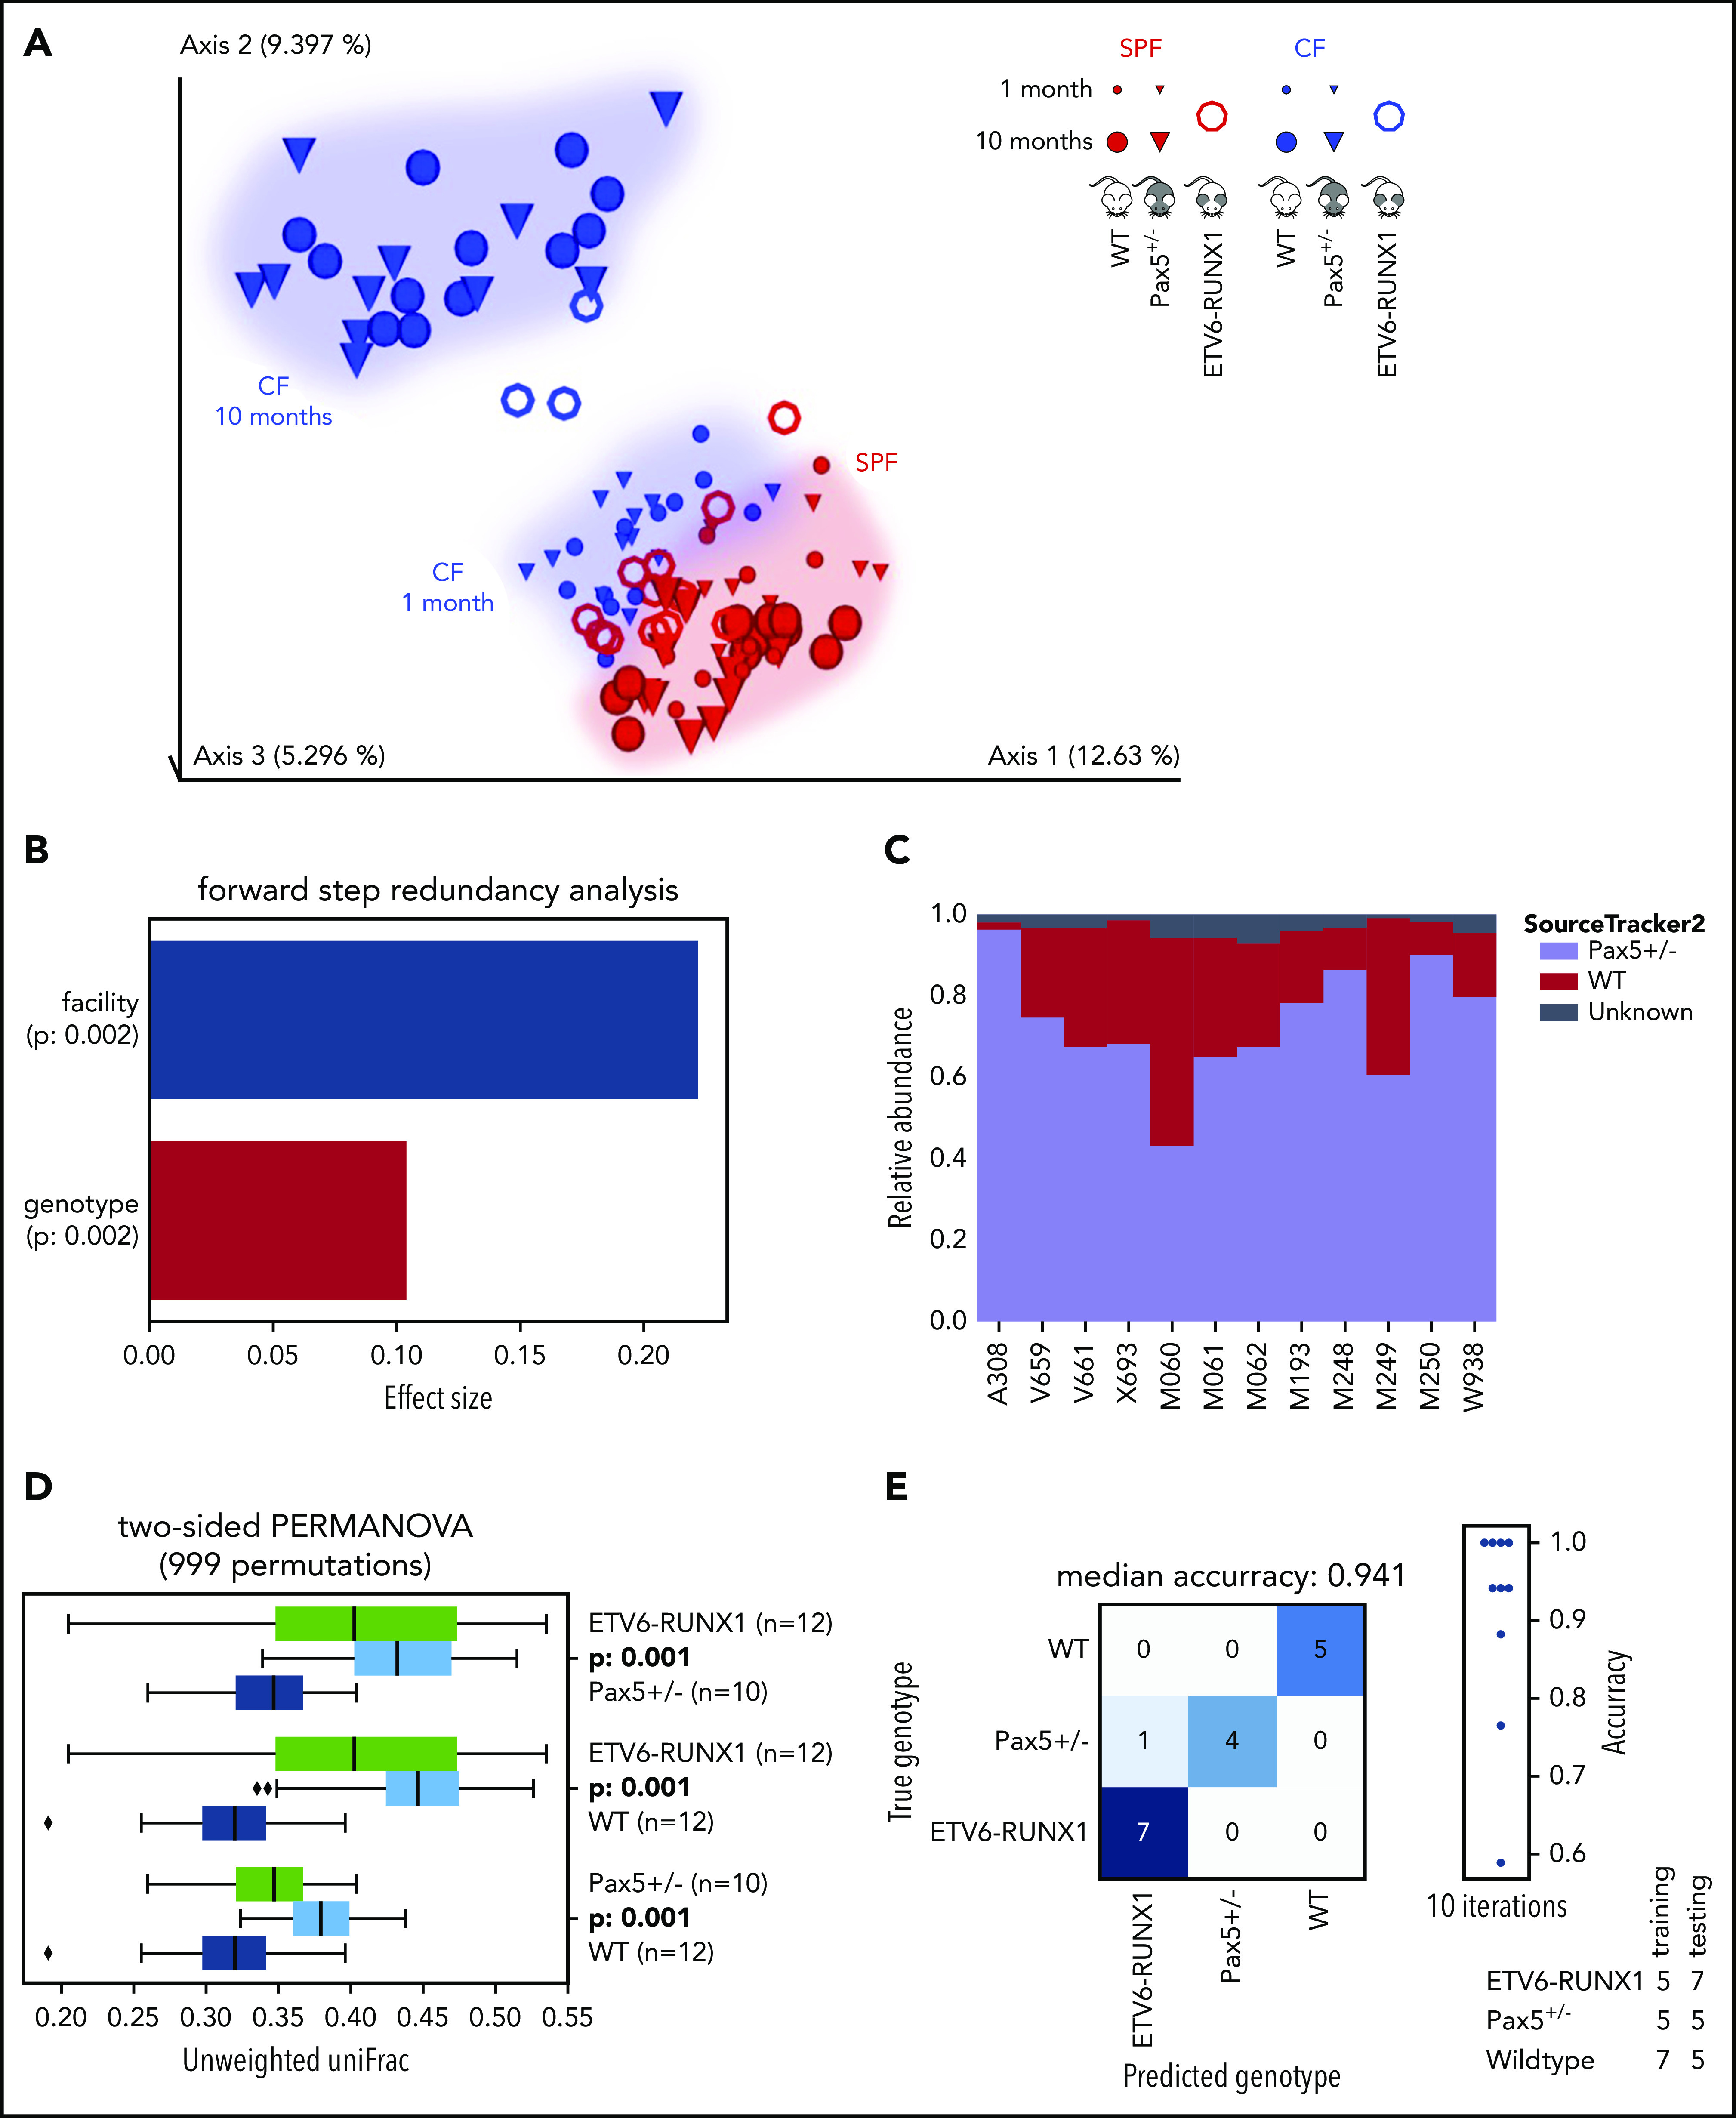
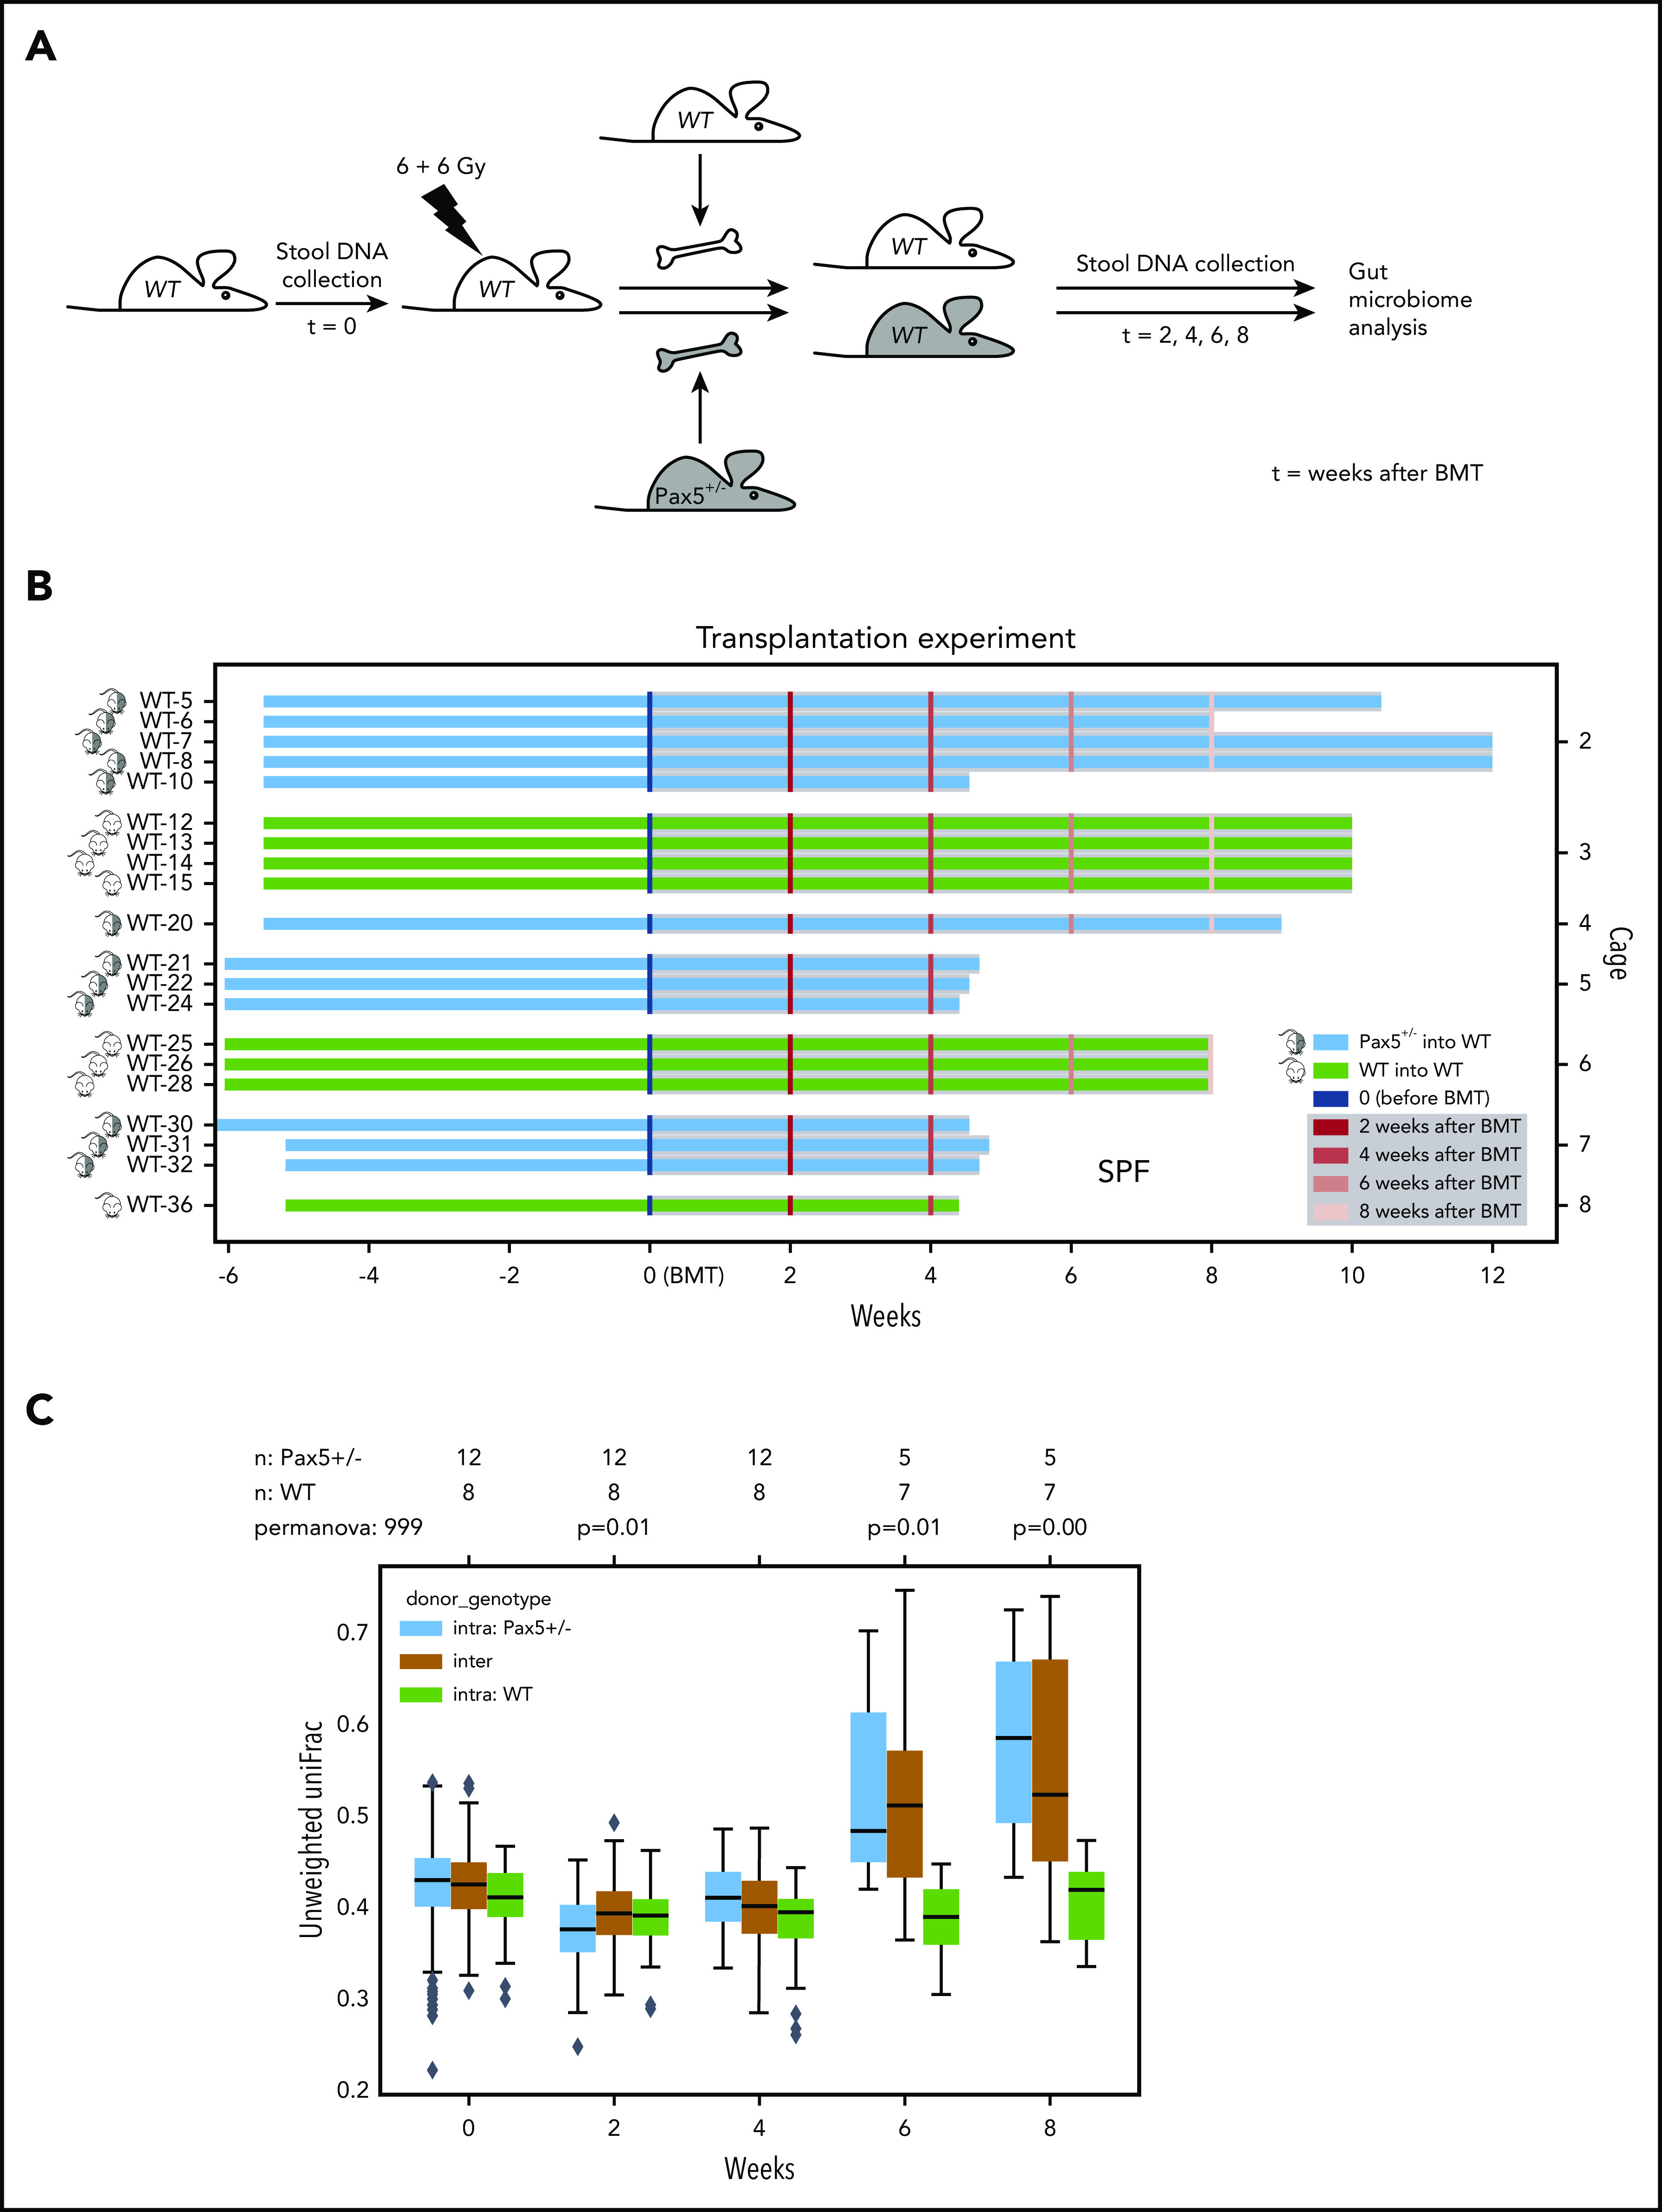
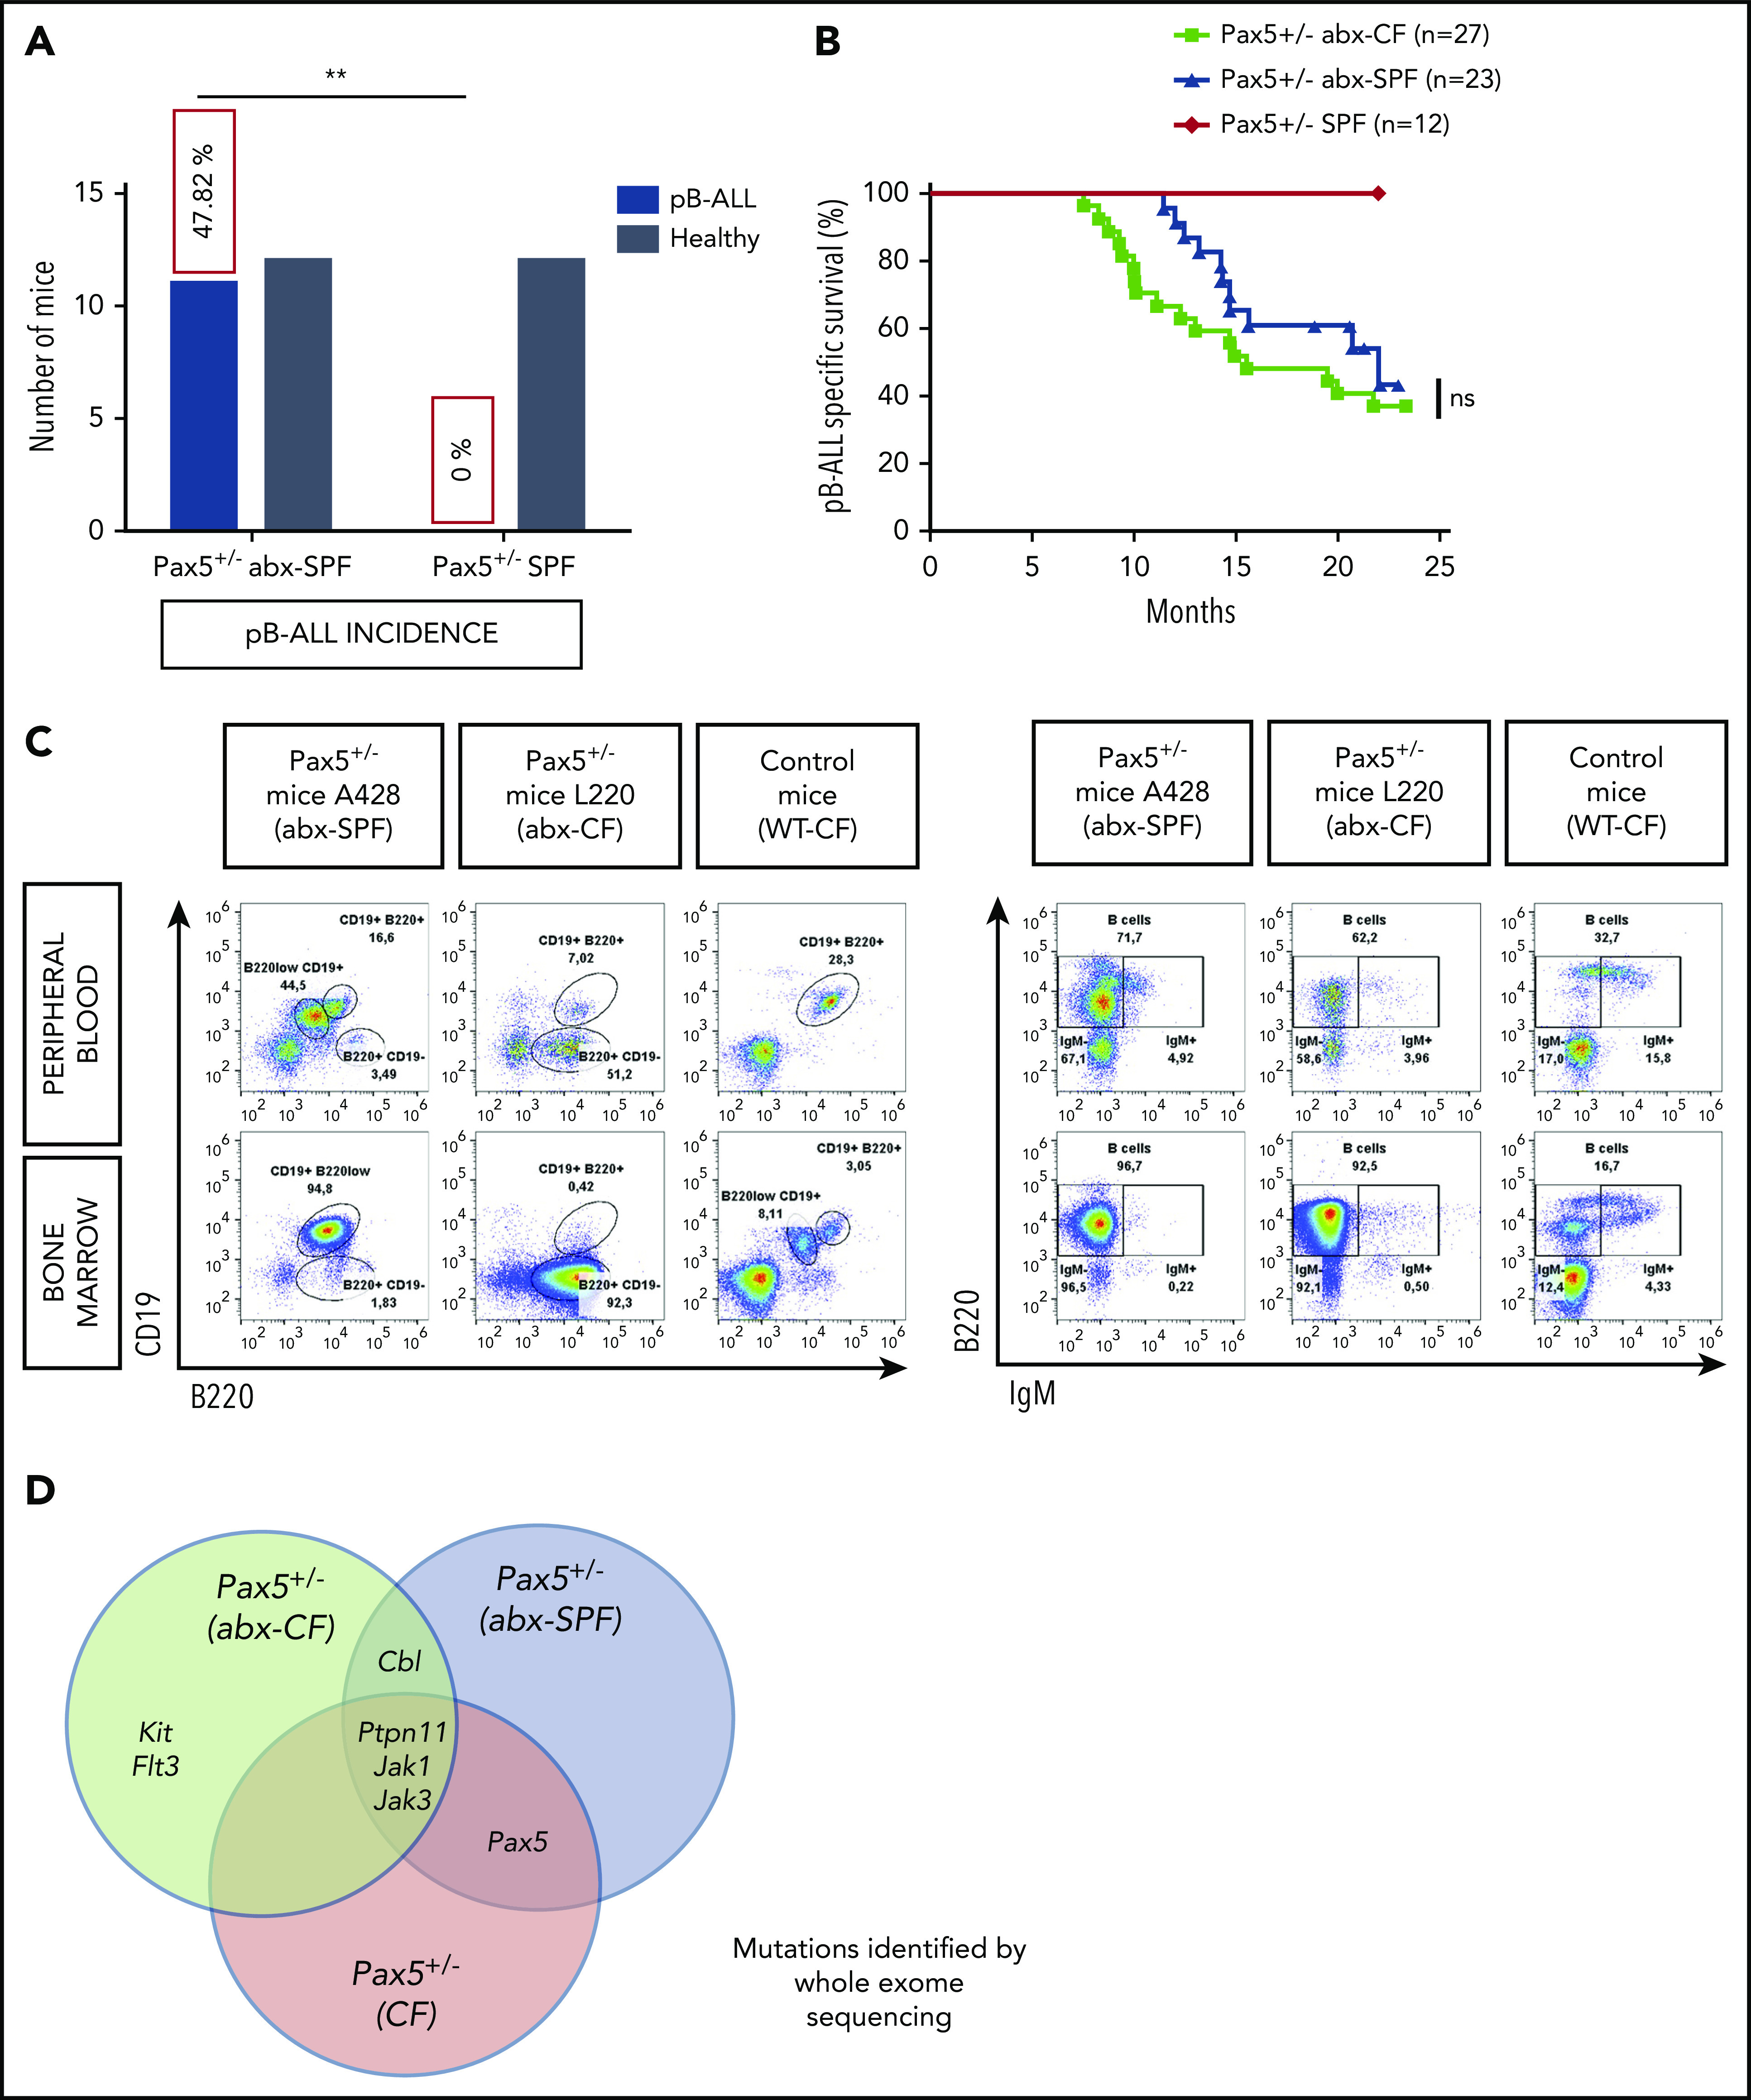
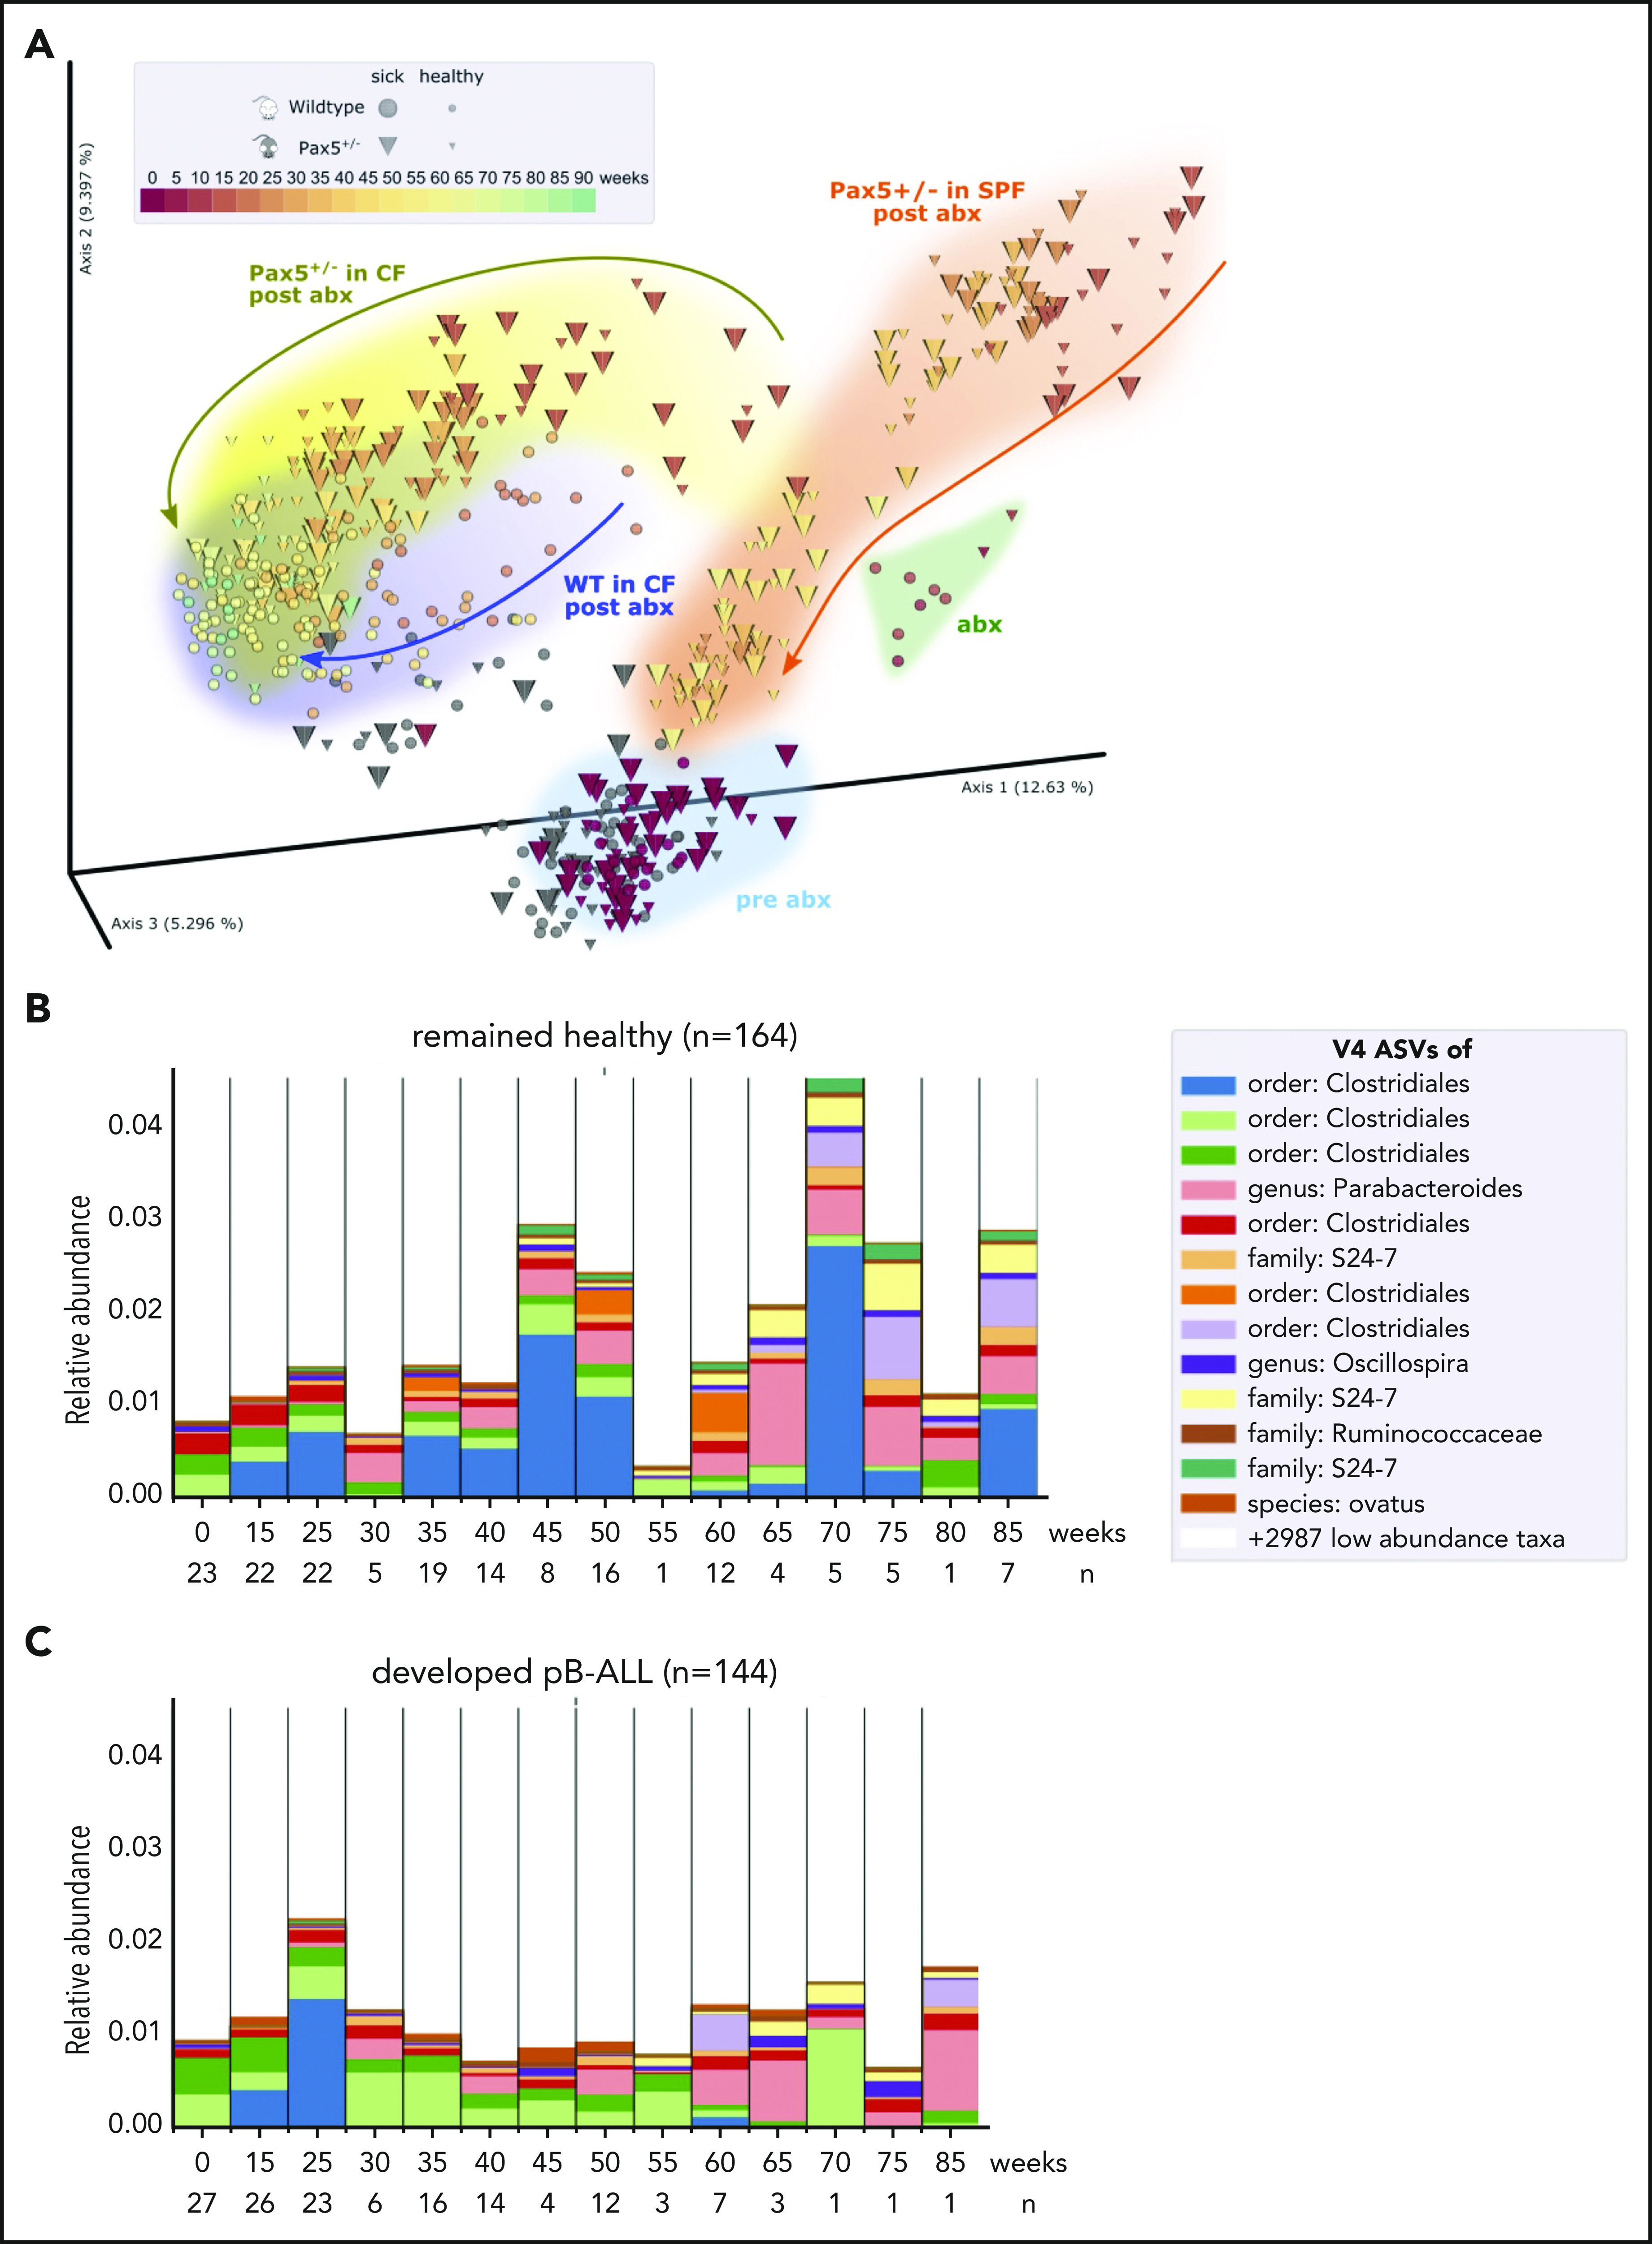
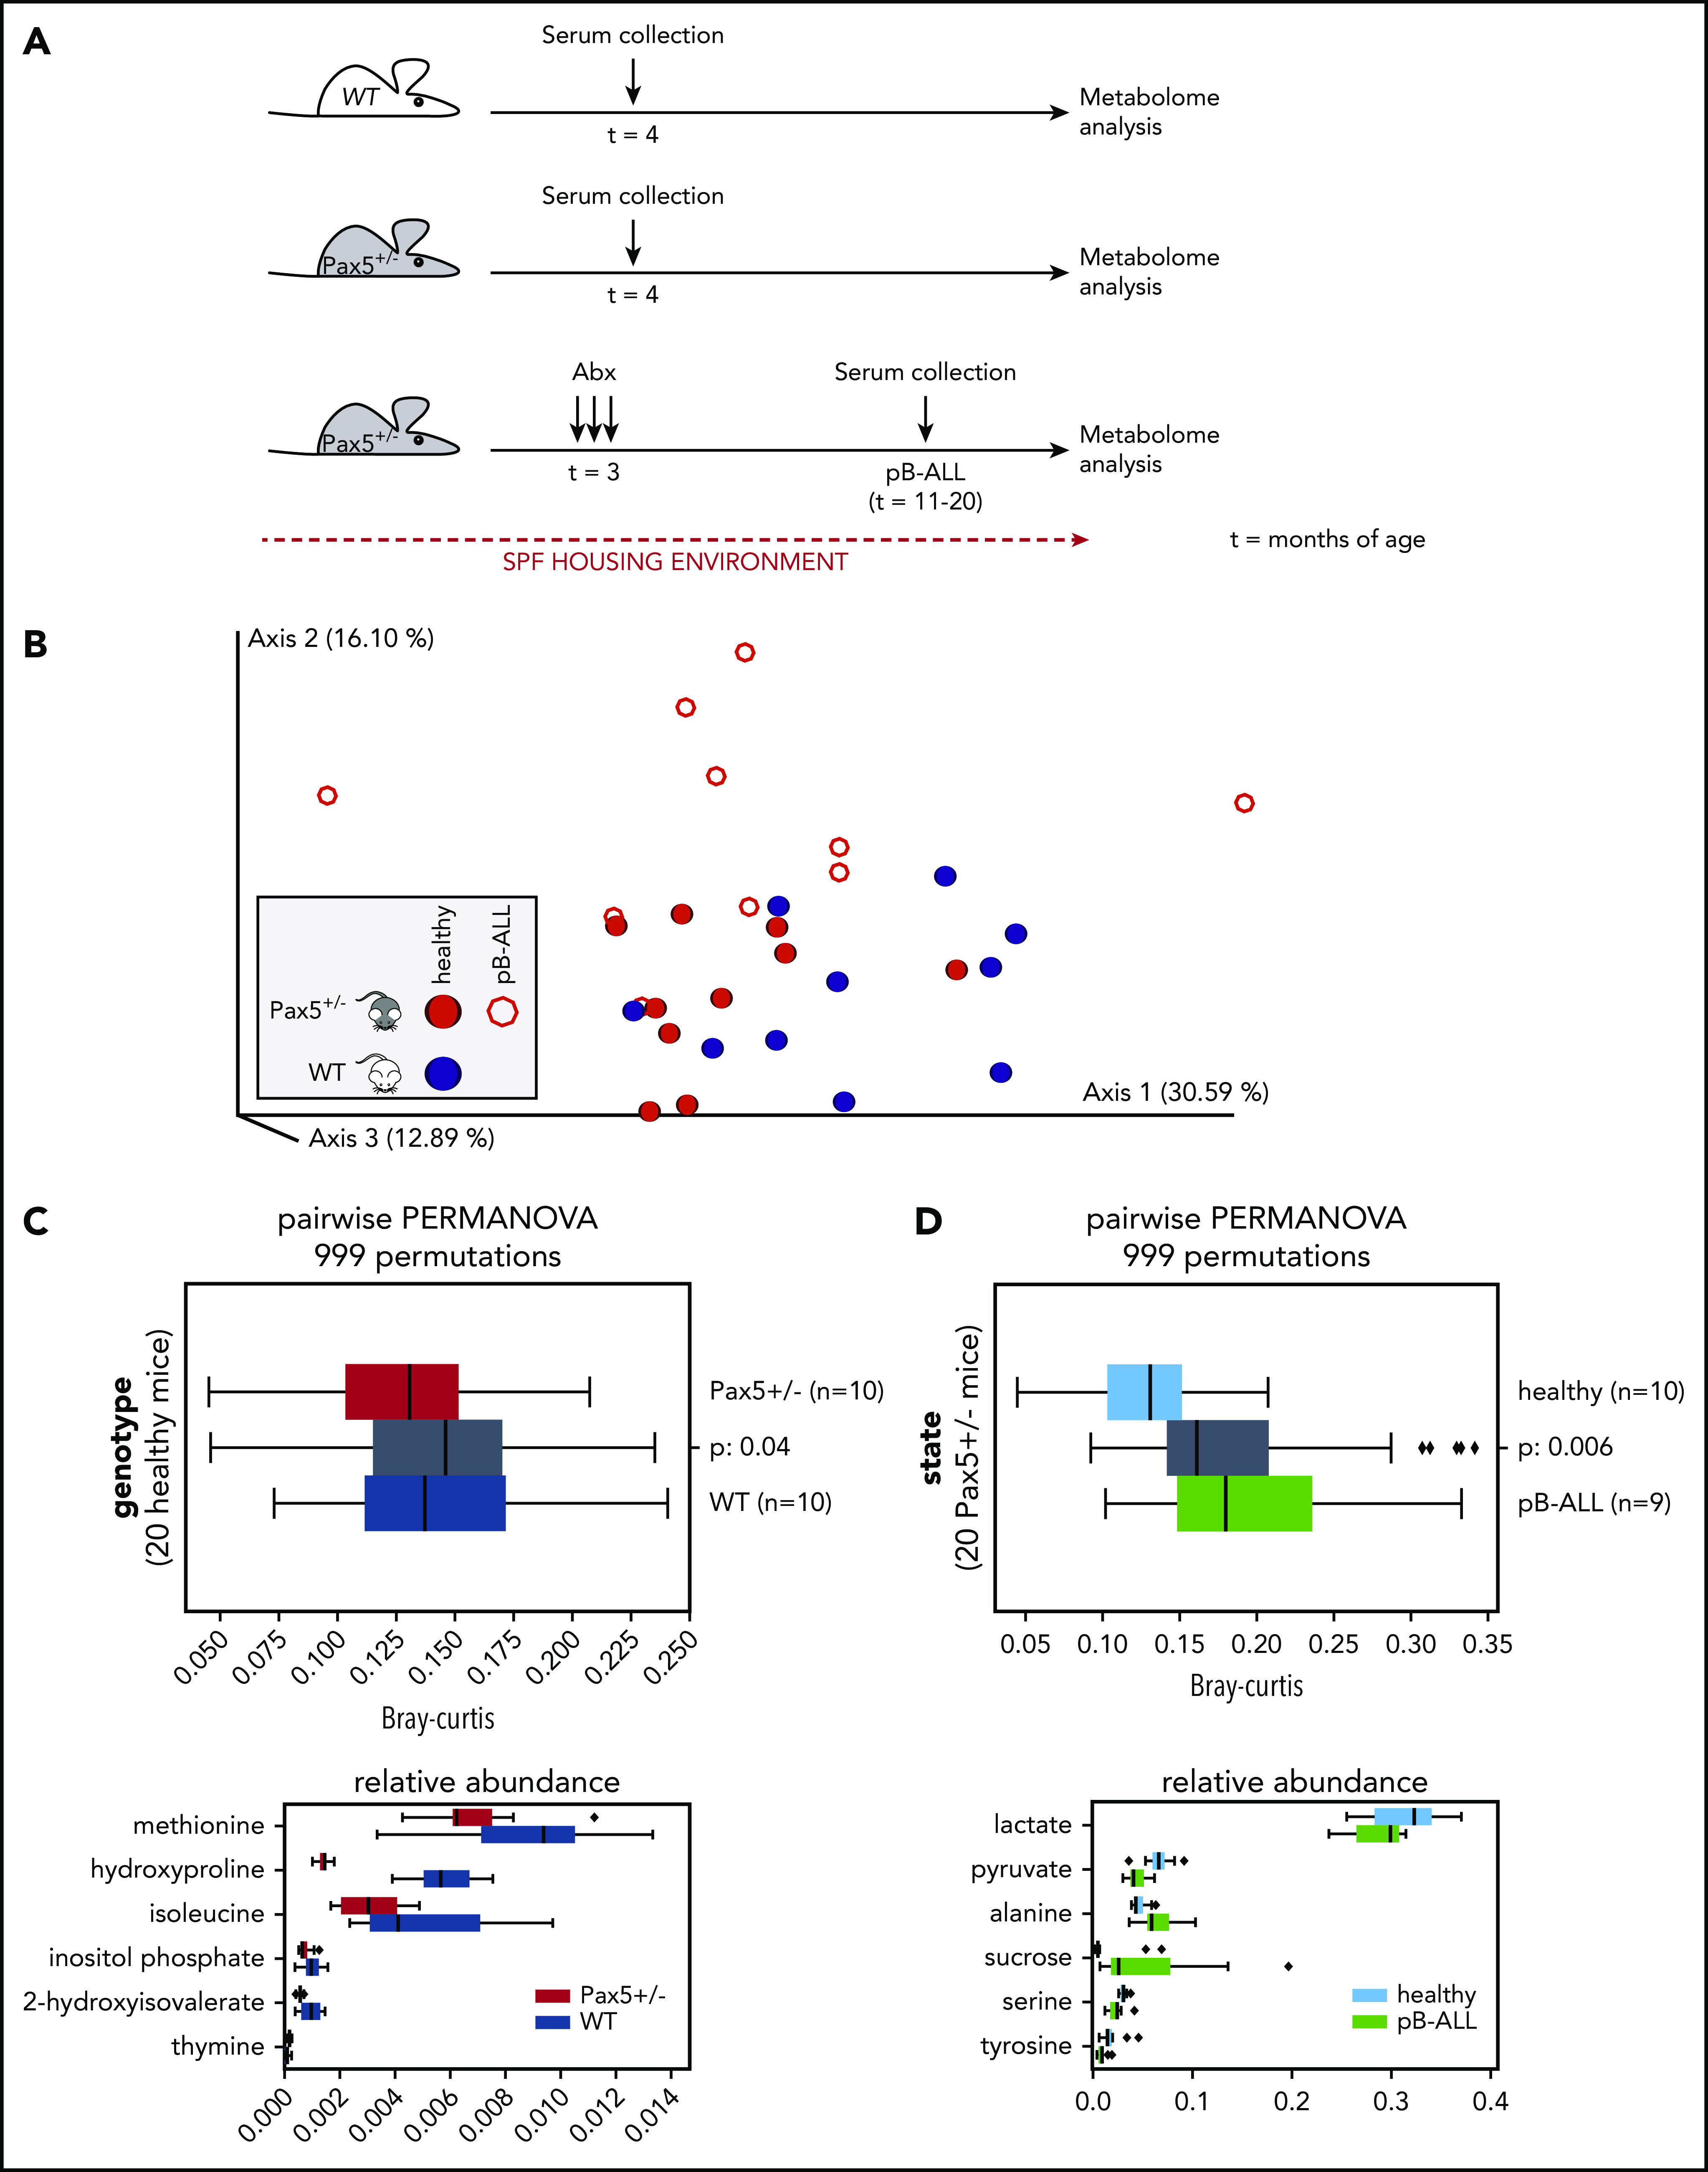
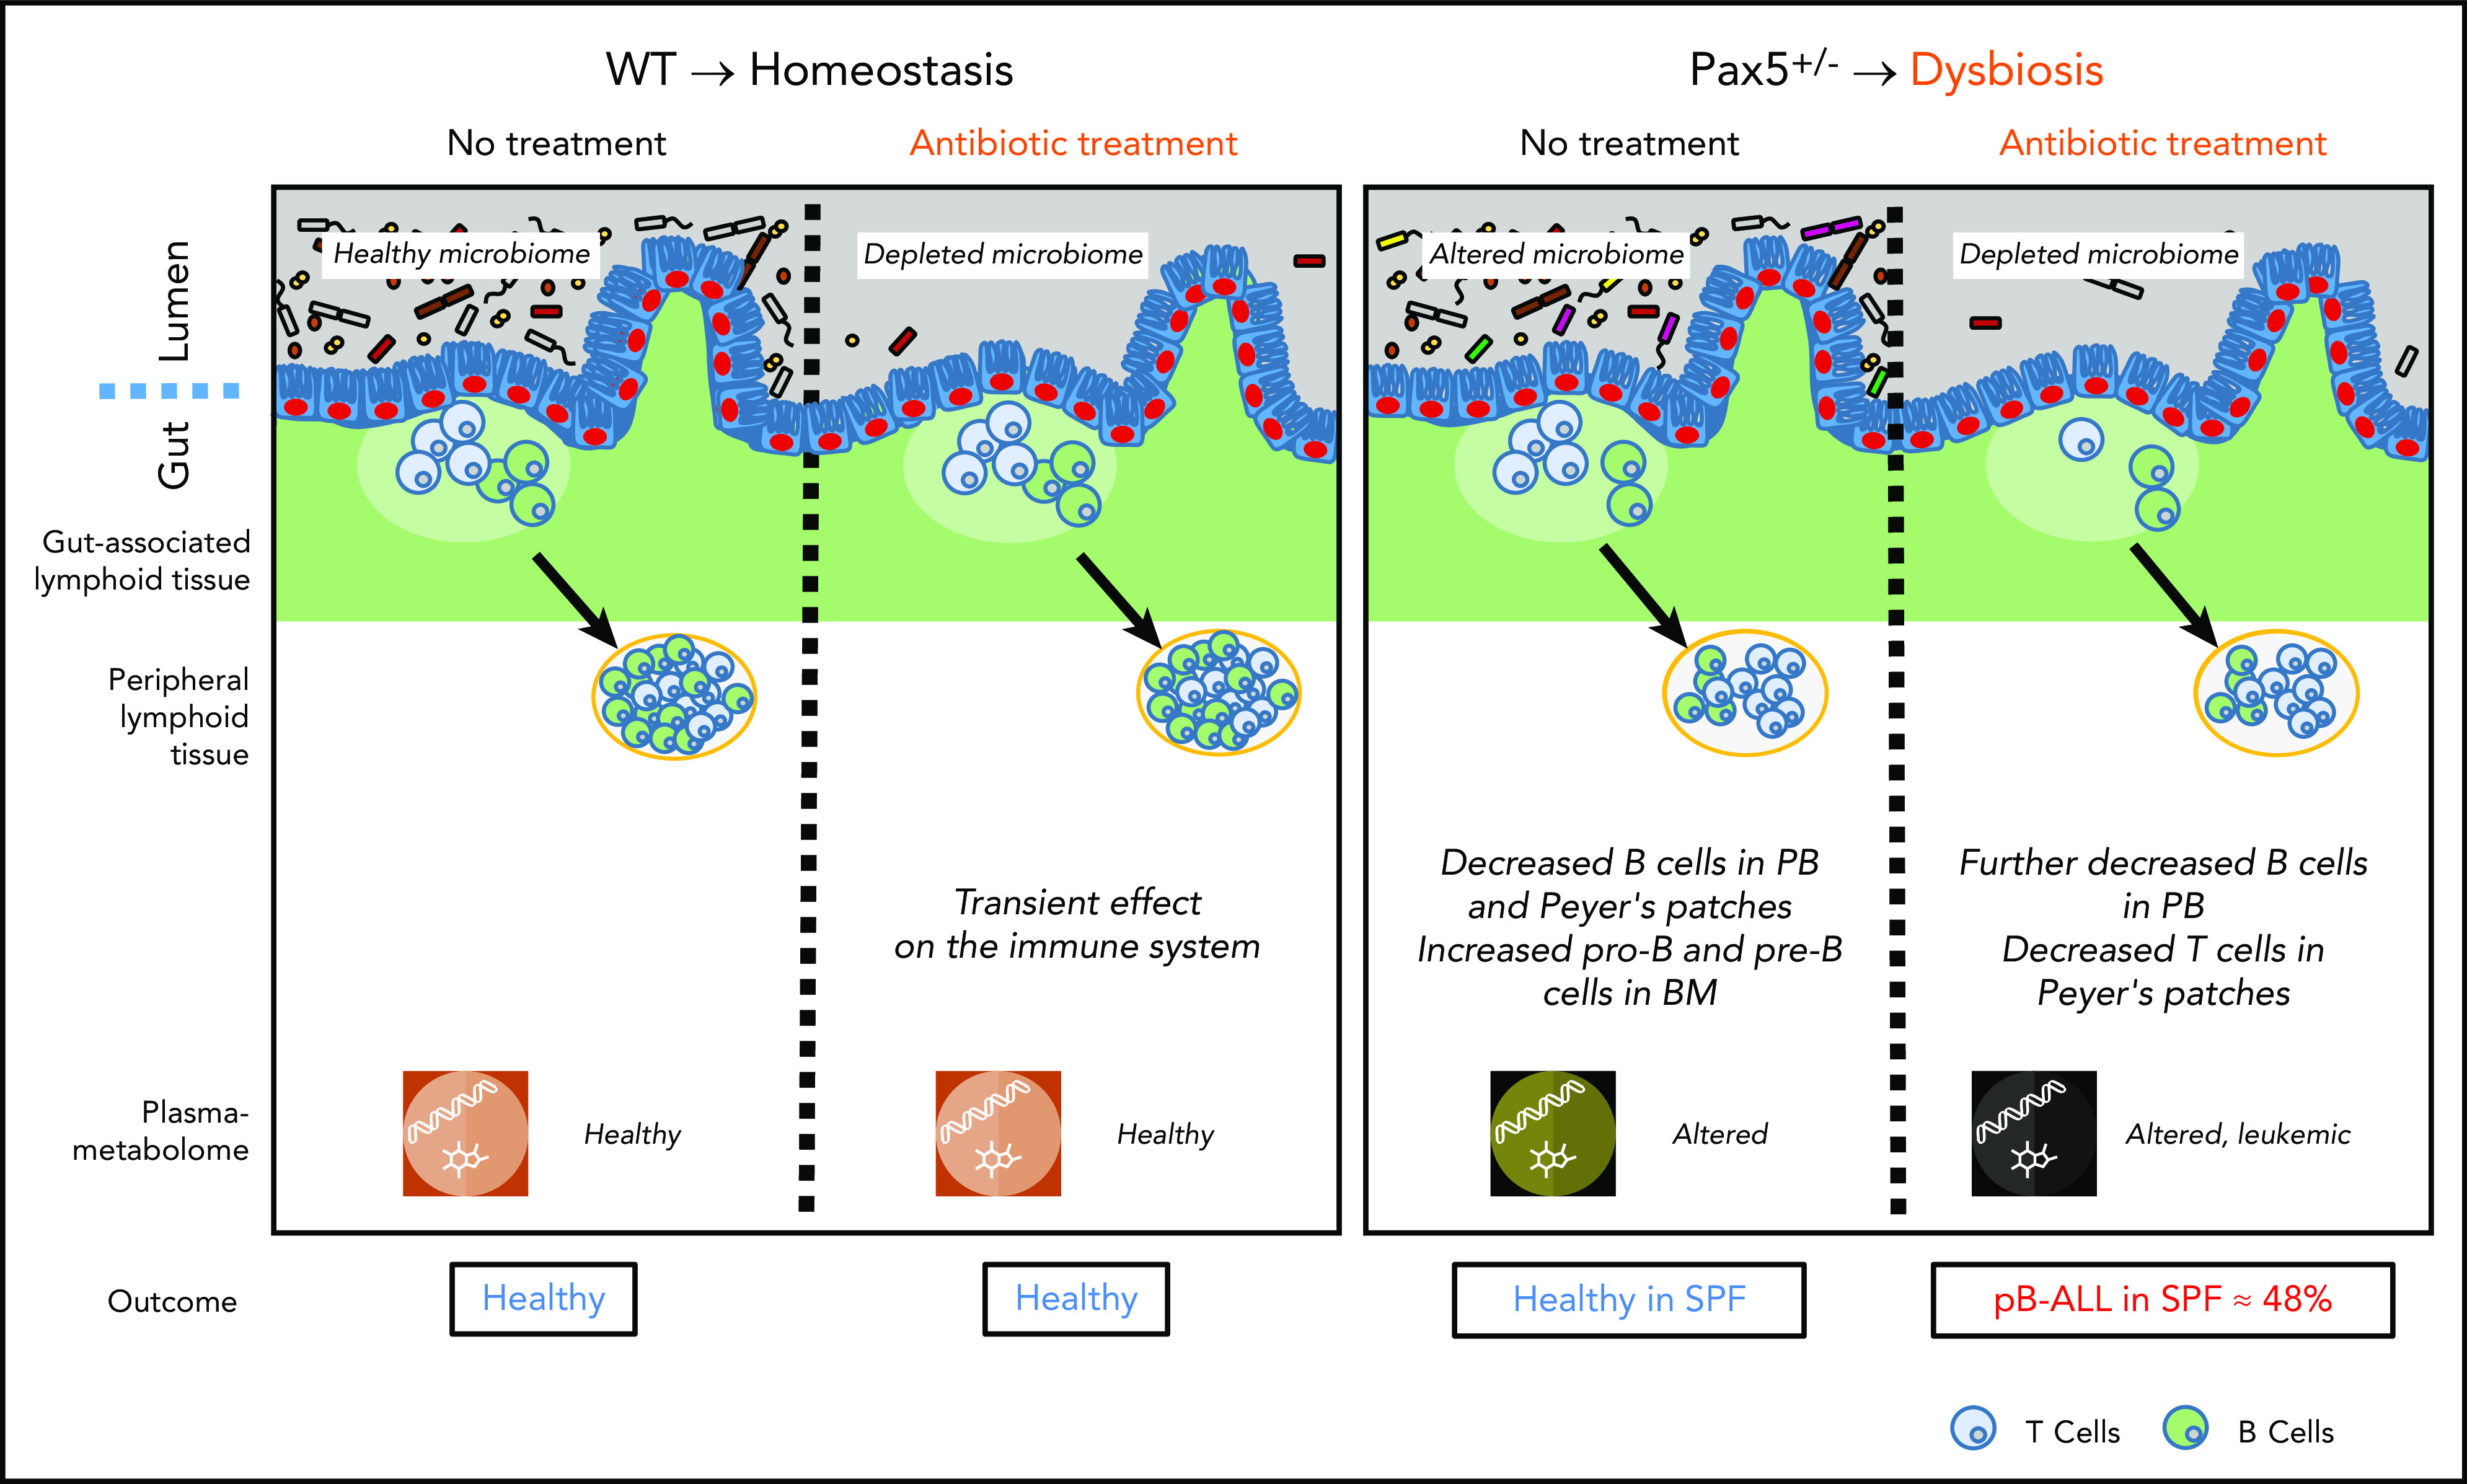
The majority of childhood leukemias are precursor B-cell acute lymphoblastic leukemias (pB-ALLs) caused by a combination of prenatal genetic predispositions and oncogenic events occurring after birth. Although genetic predispositions are frequent in children (>1% to 5%), fewer than 1% of genetically predisposed carriers will develop pB-ALL. Although infectious stimuli are believed to play a major role in leukemogenesis, the critical determinants are not well defined. Here, by using murine models of pB-ALL, we show that microbiome disturbances incurred by antibiotic treatment early in life were sufficient to induce leukemia in genetically predisposed mice, even in the absence of infectious stimuli and independent of T cells. By using V4 and full-length 16S ribosomal RNA sequencing of a series of fecal samples, we found that genetic predisposition to pB-ALL (Pax5 heterozygosity or ETV6-RUNX1 fusion) shaped a distinct gut microbiome. Machine learning accurately (96.8%) predicted genetic predisposition using 40 of 3983 amplicon sequence variants as proxies for bacterial species. Transplantation of either wild-type (WT) or Pax5+/- hematopoietic bone marrow cells into WT recipient mice revealed that the microbiome is shaped and determined in a donor genotype-specific manner. Gas chromatography-mass spectrometry (GC-MS) analyses of sera from WT and Pax5+/- mice demonstrated the presence of a genotype-specific distinct metabolomic profile. Taken together, our data indicate that it is a lack of commensal microbiota rather than the presence of specific bacteria that promotes leukemia in genetically predisposed mice. Future large-scale longitudinal studies are required to determine whether targeted microbiome modification in children predisposed to pB-ALL could become a successful prevention strategy.


Conflict of interest statement

Conflict-of-interest disclosure: The authors declare no competing financial interests.

Figures

None
Graphical abstract
Figure 1.
Figure 1.
Pax5+/–associated genetic susceptibility to pB-ALL shapes a specific gut microbiota. (A) A diagram of the study design is shown. Pax5+/– (gray) and WT (white) mice were born in SPF facilities (light blue). Lifespan (in weeks) of an individual mouse is indicated by a horizontal bar. A green bar indicates that the mouse remained healthy throughout the experiment, a red end label indicates development of pB-ALL. After weaning, 6 mice were cohoused per cage (blue-shaded horizontal boxes). Three Pax5+/– and 3 WT mice were housed together in cages 1 to 4 (mixed genotype cages), and mice of the same genotypes were housed in cages 5 to 8 (same genotype). At ∼6.3 weeks of age, mice in cages 3, 4, 7, and 8 were transferred to the conventional facilities (CFs) where there is a natural infectious environment (gray). Fecal pellets for microbial profiling were collected 1 month (blue vertical lines) and 10 months (black vertical lines) after the beginning of cohousing. Dotted vertical lines correspond to samples that were excluded because of failed quality control (cage 5; first time point; mice V443 and V493). (B) Exposure of mice to a naturally infectious environment altered their gut microbiome composition over time. Pairwise unweighted UniFrac distances (beta diversity) were computed for all cohousing samples. Distance metric was ordinated via principal coordinates analysis (PCoA) into 3D and visualized via EMPeror. Axes indicate percentage of explained variance. Cones were used to visualize microbiomes of Pax5+/– mice, whereas spheres correspond to WT mice. First-time-point samples were drawn with smaller shapes than those for the second time point. A huge shift over time becomes obvious for CFs (blue) compared with the much smaller difference in SPF facilities (red). (C-F) Heterozygous loss of Pax5 shaped a specific gut microbiota. Stratified by time point (1 month or 10 months of cohousing) and facility (CF or SPF facility), pairwise PERMANOVA tests with 999 permutations were applied to test for differences in beta diversity grouped by mouse genotype for same-genotype cages (5, 6, 7, 8). Boxes visualize unweighted UniFrac distances between samples of the same genotype (ie, intragroup distances) (blue for Pax5+/– and green for WT) and distances across genotypes (mustard, intergroup; ie, all pairs in which 1 partner has a Pax5+/– genotype and the other partner has a WT genotype). The boxes show the quartiles of the dataset, while the whiskers (error bars) show the rest of the distribution, except for points that are determined to be outliers, using 1.5-fold of the interquartile range. P value is from the PERMANOVA test. Note that PERMANOVA requires a minimum of 5 samples per group, which is minimally undercut in the first time point for SPF facilities. Boxes and PERMANOVA operate on the same data. (G-H) Pax5+/– and WT genotypes were accurately predicted using machine learning. Accurate genotype prediction from relative abundances of 40 V4-ASVs (G) or 4 full-length rRNA (H) features. The full rarefied feature table was randomly split and contained relative abundances of 3983 V4-ASVs and 502 samples from the abx and the cohousing cohorts (excluding samples from mixed-genotype cohousing cages and the antibiotics treatment phase) with a 1:1 ratio into a training and a testing set of samples. For training, 168 Pax5+/– and 83 WT samples were used, and for testing, 161 Pax5+/– and 90 WT samples were used. In a first pass, the machine learning random forest algorithm (1000 trees; scikit-learn library) was trained to estimate the importance of the 3983 V4-ASVs in predicting the mouse genotype (Pax5+/– or WT). Starting with the single most important V4-ASV, we then tested the accuracy of predicting the mouse genotype with a second random forest. Continuing in stages, V4-ASVs were added to the random forest to improve overall accuracy. Saturation was found at 96.8% accuracy by using only the top 40 V4-ASVs. The confusion matrix showed that only 8 samples were predicted to have the wrong genotype. Panel H visualizes results for the same prediction strategy on the full-length PacBio ASVs (60 Pax5+/– and 4 WT mice samples were used for training and 57 Pax5+/– and 8 WT samples were used for testing). Accuracy for predicting a mouse’s genotype based on only the top 4 full-length ASVs was 100%. (I-J) The taxonomic profile of the top 4 full-length ASVs that differentiate between the genotypes is shown. Full-length ASV composition of each sample is visualized as 1 stacked bar. Samples were grouped by housing facility (CF in panel I, SPF facility in panel J) and subgenotypes were grouped by genotype (Pax5+/– on the left and WT on the right). Combined maximal relative abundance of the 4 full-length ASVs was at 2%. A naive Bayesian classifier was applied against the Greengenes 13.8 reference to assign taxonomic labels to the full-length ASVs, which are annotated in the legend. For PacBio full-length 16S rRNA sequencing, all stool samples from mice housed in infectious environments until week 50 were used.
Figure 2.
Figure 2.
ETV6-RUNX1–associated genetic susceptibility to pB-ALL shapes a specific gut microbiota. (A) The EMPeror plot shows a PCoA of the cohousing cohort (see Figure 1), including samples from 15 Sca1-ETV6-RUNX1 mice (represented as rings). Samples of Sca1-ETV6-RUNX1 mice clustered well with samples of the cohousing cohort derived from the same facility (CF or SPF facility, respectively). Microbiome analyses were carried out after 2 months in CFs (mice had been referred to CFs from SPF facilities at age 6 to 8 weeks) and after 10 months in SPF facilities. The analyzed mice did not develop leukemia. (B) The forward step redundancy analysis was used to quantify effect sizes on microbiome differences using all samples from the cohousing cohort and the Sca1-ETV6-RUNX1 mice. Environment (facility) and genotype were identified as the most important factors. (C) WT and Pax5+/– microbial sources were defined to quantify compositions of microbial ETV6-RUNX1 sinks via SourceTracker2. The analysis showed that the microbiome of Sca1-ETV6-RUNX1 mice was more similar to the microbiome of Pax5+/– mice than to that of WT mice. (D) Statistical analyses demonstrated that the mouse genotype shapes 3 statistically significantly different microbiomes (PERMANOVA on unweighted UniFrac beta-diversity distances with 999 permutations). The box shows the quartiles of the dataset, while the whiskers (error bars) show the rest of the distribution, except for points that are determined to be outliers, using 1.5-fold of the interquartile range. The P value is from the PERMANOVA test. (E) Machine learning was able to predict genotypes genetically predisposed to pB-ALL. A confusion matrix for predicting the mouse genotype from the 10 most important V4-ASVs is shown (random forest with 1000 trees).
Figure 3.
Figure 3.
The hematopoietic cells from a genetically predisposed donor shape a distinct microbiome. (A) Overview of the experimental design is illustrated. WT mice were born and kept in SPF facilities. Stool samples were collected before irradiation with 2 doses of 6 Gy to eradicate the BM. Bone marrow transplantation (BMT) was carried out using Pax5+/– and WT mice as donors. Mice were monitored after transplantation, and stool samples were collected at the indicated time points. (B) BM from Pax5+/– mice (blue lines) was transplanted into 12 WT mice housed in 4 cages in SPF facilities. As a control, WT BM (green lines) was transplanted into 8 mice housed in 3 cages in SPF facilities. Samples were collected before BMT and at 2, 4, 6, and 8 weeks after BMT. (C) Pairwise PERMANOVA tests were applied (as described in Figure 1C-F) to test for differences in beta diversity by mouse genotype. Unweighted UniFrac distances between samples of the same donor genotype (ie, intragroup distances [Pax5+/–, blue; WT, green]) and distances across donor genotypes (mustard, intergroup) are shown as box plots. The box shows the quartiles of the dataset, while the whiskers (error bars) show the rest of the distribution, except for points that are determined to be outliers, using 1.5-fold of the interquartile range. Six weeks after transplantation, strong significant differences dependent on the specific donor genotype were detectable. P value is from the PERMANOVA test.
Figure 4.
Figure 4.
Depletion of gut microbiome bacteria after antibiotic treatment promotes pB-ALL development in predisposed mice in the absence of natural infectious stimuli. (A) Untreated Pax5+/– mice housed in SPF facilities did not develop leukemia. Treatment of Pax5+/– mice housed in SPF facilities with antibiotics resulted in pB-ALL development in 47.82% of mice. **P = .0055 using a Fisher’s exact test. (B) pB-ALL–specific survival curves of Pax5+/– mice treated with antibiotics and exposed to common infections (green line; n = 27), Pax5+/– mice treated with antibiotics and housed in SPF facility conditions (blue line; n = 23), and Pax5+/– mice not treated with antibiotics and housed in SPF facility conditions (orange line; n = 12) are shown. Log-rank (Mantel-Cox) test (P = .2629) was used to evaluate survival curves between untreated Pax5+/– mice and Pax5+/– mice treated with antibiotics. (C) Representative fluorescence-activated cell sorting plots of B-cell (CD19+B220+ and B220+IgM+/–) subsets in PB and BM from diseased Pax5+/– mice treated with antibiotics (exposed [CF] and not exposed [SPF facility] to common infections) compared with an age-matched control WT mouse are shown. (D) The Venn diagram illustrates recurrently mutated genes in Pax5+/– leukemic cells identified by whole-exome sequencing. Mutated genes in leukemias arising in Pax5+/– mice treated with antibiotics and housed either in CFs (green circle) or in SPF facilities (blue circle) are compared with leukemias derived from untreated Pax5+/– mice kept in an infectious environment (red circle). ns, not significant.
Figure 5.
Figure 5.
The microbiome between healthy and leukemic Pax5+/−mice is distinct. (A) After antibiotic treatment, the beta diversity of the microbiomes shifted in a genotype-dependent manner and reconstituted over time toward a similar end point (Pax5+/–, yellow; WT, blue). Pairwise unweighted UniFrac distances (beta diversity) were computed for all samples. Distance metric was ordinated into 3D via PCoA and visualized using EMPeror. Axes indicate percentages of explained variance. Cones and spheres were used to visualize microbiomes of Pax5+/– and WT mice, respectively. Icon size indicates disease status, with larger icons for pB-ALL mice and smaller icons for healthy mice. Samples of the initial time point (darkest red), at transfer from SPF facilities to CFs before antibiotics treatment, clustered in the light blue pre-abx region. Samples with sufficient bacterial reads from the group that had 8 weeks of antibiotic treatment clustered in the green abx region. Samples shifted back after antibiotic treatment in a genotype-dependent manner (Pax5+/–, yellow; WT, blue) and reconstituted over time toward a similar end point. Their end point was significantly shifted from pre-abx, which was not the case for samples of mice that were housed in SPF facilities (orange trajectory). (B-C) Microbial V4-16S signatures (V4-ASVs) differentiated between healthy (B) and preleukemic (C) Pax5+/– mice. Shown are mean V4-ASV compositions for the top 13 differentially abundant (discrete FDR) features of all samples stratified by disease status. Samples were grouped by time point (x-axis) and visualized as 1 stacked bar each. A naive Bayesian classifier was applied against the Greengenes 13.8 reference to assign taxonomic labels to the V4-ASVs, which are annotated in the legend.
Figure 6.
Figure 6.
Metabolome analysis reveals systemic differences between WT and Pax5+/–mice predisposed to develop pB-ALL. (A) Overview of the experimental design is shown. Serum samples were collected from untreated WT (n = 10) and Pax5+/– (n = 10) mice born and housed in SPF facilities at 4 months of age. Additional samples were collected from 10 Pax5+/– mice kept in SPF facilities at onset of pB-ALL after treatment with antibiotics (at ∼15 months of age). (B) The relative response values for 52 quality-controlled gas chromatography peaks were used to create a feature table. Using Bray-Curtis, a beta-diversity distance matrix was computed via Qiime2 version 2020.2. The EMPeror plot shows the PCoA of the resulting matrix (blue, samples from WT mice; red, samples from Pax5+/– mice). Open circles represent leukemic mice, and filled circles represent healthy mice. Clustering indicated a difference by genotype based on measurements of 52 metabolites in the blood. (C-D) Statistical tests (PERMANOVA) confirmed strong significant differences depending on genotype (C) and health state (D). (C) The upper panel shows statistically significant (2-sided PERMANOVA tests with 999 permutations) differences in beta-diversity distance between blood samples from WT (blue) and Pax5+/– (red) mice. Gray box summarizes intergroup distances (ie, pairs of samples in which 1 partner belongs to WT and the other to Pax5+/–). The lower panel shows that after applying discrete FDR on the metabolite feature table, 6 of 52 compounds were found to be significantly differentially abundant between WT and Pax5+/– serum samples. (D) Upper panel visualizes the differences between serum samples from healthy Pax5+/– (light blue represents red solid spheres in panel B) and pB-ALL diseased (green represents red rings in panel B) individual mice. Lower panel shows the top 6 of 16 compounds found to be significantly differentially abundant among all 52 compounds in healthy and pB-ALL samples. The boxes show the quartiles of the dataset, while the whiskers (error bars) show the rest of the distribution, except for points that are determined to be outliers, using 1.5-fold of the interquartile range (C,D). P values are from the PERMANOVA test.
Figure 7.
Figure 7.
In the absence of natural infection, pB-ALL development can be triggered by cooperation between a genetic predisposition and microbiome changes. Left panel: in WT mice, a short-term depletion of bacteria in the gut microbiome using antibiotic treatment led to a transient effect on the immune system (including the gut-associated and peripheral lymphoid tissues). In this scenario, mice do not develop pB-ALL. Right panel: the Pax5 mutation altered the microbiome composition and affected B-cell maturation. The dysbiosis translated into an altered plasma metabolome. In the absence of a natural infectious environment, untreated Pax5+/– mice did not develop leukemia. However, in response to a transient depletion of the bacteria in the microbiome at age 8 weeks, pB-ALL was induced in 48% of the mice between age 11 and 21 months. Leukemia development was preceded by more prominent effects on the immune system and was associated with an altered plasma metabolome.

Comment in

References

    1. Parkin DM, Stiller CA, Draper GJ, Bieber CA. The international incidence of childhood cancer. Int J Cancer. 1988;42(4):511-520. - PubMed
    1. Linabery AM, Ross JA. Trends in childhood cancer incidence in the U.S. (1992-2004). Cancer. 2008;112(2):416-432. - PubMed
    1. Pui CH, Yang JJ, Bhakta N, Rodriguez-Galindo C. Global efforts toward the cure of childhood acute lymphoblastic leukaemia. Lancet Child Adolesc Health. 2018;2(6):440-454. - PMC - PubMed
    1. Gu Z, Churchman ML, Roberts KG, et al. . PAX5-driven subtypes of B-progenitor acute lymphoblastic leukemia. Nat Genet. 2019;51(2):296-307. - PMC - PubMed
    1. Mullighan CG. The genomic landscape of acute lymphoblastic leukemia in children and young adults. Hematology Am Soc Hematol Educ Program. 2014;2014(1):174-180. - PubMed

Publication types

MeSH terms

Substances