

Metabonomic Responses of Grazing Yak to Different Concentrate Supplementations in Cold Season
- PMID: 32911680
- PMCID: PMC7552243
- DOI: 10.3390/ani10091595
Metabonomic Responses of Grazing Yak to Different Concentrate Supplementations in Cold Season
Abstract
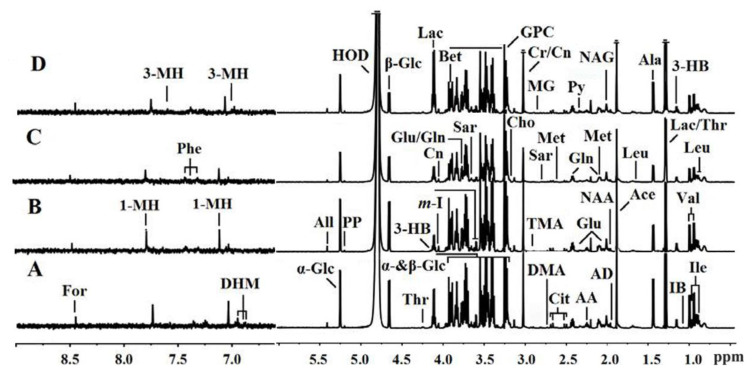
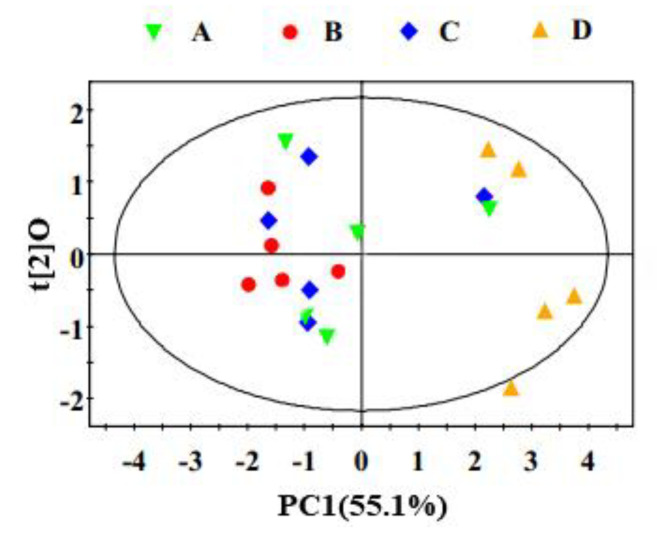
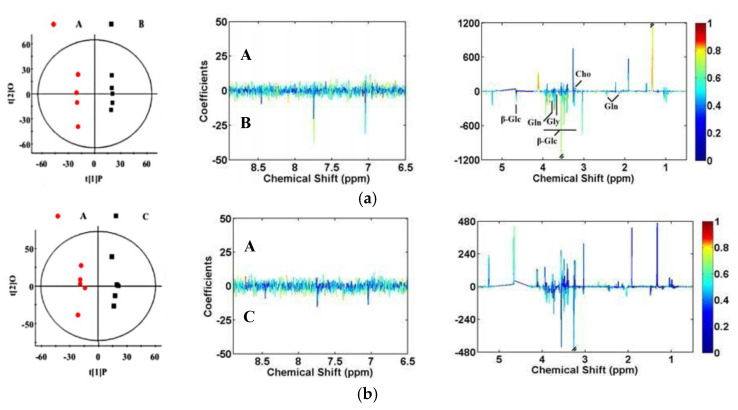
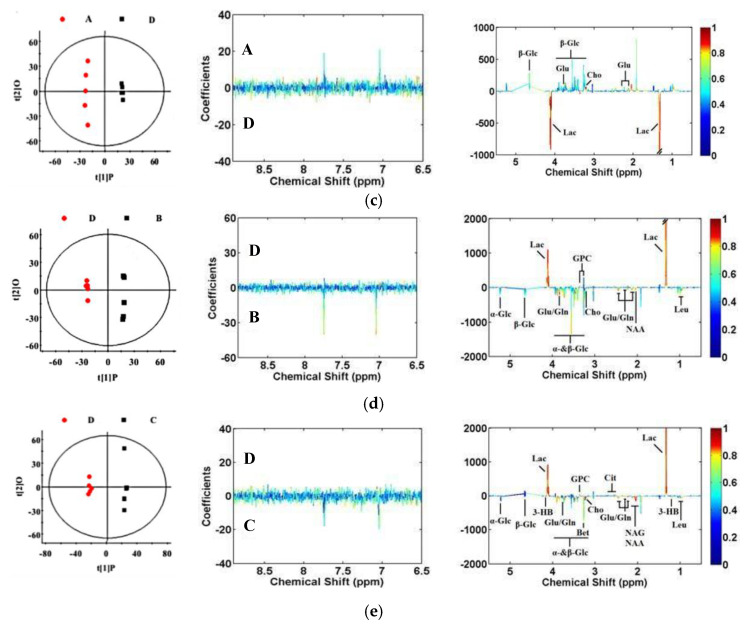
Supplementation plays an important role in reversing the weight loss of grazing yaks during cold season. However, little is known about the effect of supplementation on the serum metabolites of grazing yaks. The objective of this study was to explore the effects of supplementary feeding on average daily gain (ADG) and serum metabolites with nuclear magnetic resonance (NMR)-based metabolomics method in growing yaks during cold season on the Qinghai-Tibetan plateau. Twenty 1.5-year-old female yaks (91.38 ± 10.43 kg LW) were evenly divided into three treatment groups and a control group (CON) (n = 5 per group). All the yaks were released to graze during daytime, whereas the yaks in the treatment groups were supplemented with highland barley (HLB), rapeseed meal (RSM), and highland barley plus rapeseed meal (HLB + RSM) at night. The whole experiment lasted for 120 days. Results indicated that the ADG of growing yak heifers was increased by concentrate supplementations, and ADG under HLB and HLB + RSM group was 37.5% higher (p < 0.05) than that with RSM supplementation. Supplementary feeding increased the plasma concentrations of total protein (TP), albumin (ALB), and blood urea nitrogen (BUN) of those in the CON group, and concentrations of BUN were higher in the RSM group than in the HLB and HLB + RSM group. Compared with the CON group, serum levels of glutamine, glycine, β-glucose were lower and that of choline was higher in the HLB group; serum levels of lactate were lower and that of choline, glutamate were higher in the HLB + RSM group. Compared with the HLB + RSM group, serum levels of glycerophosphoryl choline (GPC) and lactate were higher, and those of choline, glutamine, glutamate, leucine, N-acetyaspartate, α-glucose, and β-glucose were lower in the HLB group; serum levels of citrate, GPC and lactate were higher, and those of 3-Hydroxybutyrate, betaine, choline, glutamate, glutamine, N-acetylglycoprotein, N-acetyaspartate, α-glucose, and β-glucose were lower in the RSM group. It could be concluded that concentrate supplementations significantly improved the growth performance of growing yaks and supplementation with HBL or HLB plus RSM was better than RSM during the cold season. Supplementation with HBL or HLB plus RSM affected the serum metabolites of grazing yaks, and both treatments promoted lipid synthesis. Supplementation of yaks with HBL plus RSM could improve energy-supply efficiency, protein and lipid deposition compared with HLB and RSM.
Keywords: growth performance; serum metabolomics; supplementation; yaks.
Conflict of interest statement
The authors declare no conflict of interest.
Figures
Similar articles
-
"The Yak"-A remarkable animal living in a harsh environment: An overview of its feeding, growth, production performance, and contribution to food security.Front Vet Sci. 2023 Feb 2;10:1086985. doi: 10.3389/fvets.2023.1086985. eCollection 2023. Front Vet Sci. 2023. PMID: 36814466 Free PMC article. Review.
-
Metabolism response of grazing yak to dietary concentrate supplementation in warm season.Animal. 2021 Mar;15(3):100175. doi: 10.1016/j.animal.2021.100175. Epub 2021 Feb 18. Animal. 2021. PMID: 33610519
-
Concentrate supplementation improves cold-season environmental fitness of grazing yaks: responsive changes in the rumen microbiota and metabolome.Front Microbiol. 2023 Aug 28;14:1247251. doi: 10.3389/fmicb.2023.1247251. eCollection 2023. Front Microbiol. 2023. PMID: 37700865 Free PMC article.
-
Seasonal changes in weight and body composition of yak grazing on alpine-meadow grassland in the Qinghai-Tibetan plateau of China.J Anim Sci. 2005 Aug;83(8):1908-13. doi: 10.2527/2005.8381908x. J Anim Sci. 2005. PMID: 16024711
-
Reproduction in female yaks (Bos grunniens) and opportunities for improvement.Theriogenology. 2003 Mar;59(5-6):1303-12. doi: 10.1016/s0093-691x(02)01172-x. Theriogenology. 2003. PMID: 12527077 Review.
Cited by
-
Dietary Concentrate Supplementation Alters Serum Metabolic Profiles Related to Energy and Amino Acid Metabolism in Grazing Simmental Heifers.Front Vet Sci. 2021 Oct 26;8:743410. doi: 10.3389/fvets.2021.743410. eCollection 2021. Front Vet Sci. 2021. PMID: 34765668 Free PMC article.
-
Changes in Blood Metabolic Profiles Reveal the Dietary Deficiencies of Specific Nutrients and Physiological Status of Grazing Yaks during the Cold Season in Qinghai Province of China.Metabolites. 2022 Aug 11;12(8):738. doi: 10.3390/metabo12080738. Metabolites. 2022. PMID: 36005610 Free PMC article.
-
Dietary energy and protein gradients drive metabolic adaptation in growing-finishing yaks on the Qinghai-Tibet plateau.Anim Nutr. 2025 Apr 5;21:351-364. doi: 10.1016/j.aninu.2025.01.009. eCollection 2025 Jun. Anim Nutr. 2025. PMID: 40487107 Free PMC article.
-
"The Yak"-A remarkable animal living in a harsh environment: An overview of its feeding, growth, production performance, and contribution to food security.Front Vet Sci. 2023 Feb 2;10:1086985. doi: 10.3389/fvets.2023.1086985. eCollection 2023. Front Vet Sci. 2023. PMID: 36814466 Free PMC article. Review.
-
Effects of Concentrate Supplementation on Growth Performance, Rumen Fermentation, and Bacterial Community Composition in Grazing Yaks during the Warm Season.Animals (Basel). 2022 May 29;12(11):1398. doi: 10.3390/ani12111398. Animals (Basel). 2022. PMID: 35681862 Free PMC article.
References
-
- Ding X.Z., Guo X., Yan P., Liang C.N., Bao P.J., Chu M. Seasonal and nutrients intake regulation of lipoprotein lipase (LPL) activity in grazing yak (Bos grunniens) in the Alpine Regions around Qinghai Lake. Livest. Sci. 2012;143:29–34. doi: 10.1016/j.livsci.2011.08.004. - DOI
-
- Long R.J., Ding L.M., Shang Z.H., Gao X.H. The yak grazing system on the Qinghai-tibetan plateau and its status. Rangel. J. 2008;30:241–246. doi: 10.1071/RJ08012. - DOI
-
- Long R.J., Dong S.K., Wei X.H., Pu X.P. The effect of supplementary feeds on the body weight of yaks in cold season. Livest. Prod. Sci. 2005;93:197–204. doi: 10.1016/j.livprodsci.2004.08.016. - DOI
LinkOut - more resources
Full Text Sources
Research Materials
Miscellaneous
