

Relationship Between Cardiac Fibroblast Activation Protein Activity by Positron Emission Tomography and Cardiovascular Disease
- PMID: 32912030
- PMCID: PMC7497888
- DOI: 10.1161/CIRCIMAGING.120.010628
Relationship Between Cardiac Fibroblast Activation Protein Activity by Positron Emission Tomography and Cardiovascular Disease
Abstract
Background: FAP (fibroblast activation protein) plays an important role in cardiac wound healing and remodeling. Although initially developed as a theranostic ligand for metastasized cancer, FAPI (FAP inhibitor) tracers have recently been used to study cardiac remodeling following myocardial infarction in small-animal models. The aim of the study was to evaluate the activity of FAP via FAPI-positron emission tomography-computed tomography scans in human hearts.
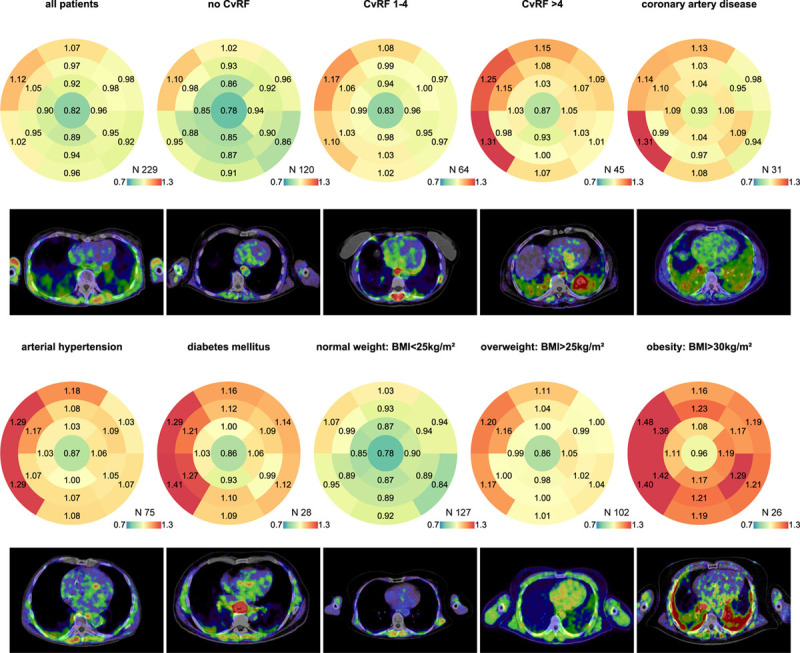
Methods: FAPI-positron emission tomography-computed tomography scans of 229 patients of 2 consecutive cohorts (modeling cohort: n=185; confirmatory cohort: n=44) suffering from metastasized cancer were analyzed applying the American Heart Association 17-segment model of the left ventricle. Logistic regression models were created using data from the modeling cohort. Multivariate regression models were established using Akaike information criterion in a step-down approach.
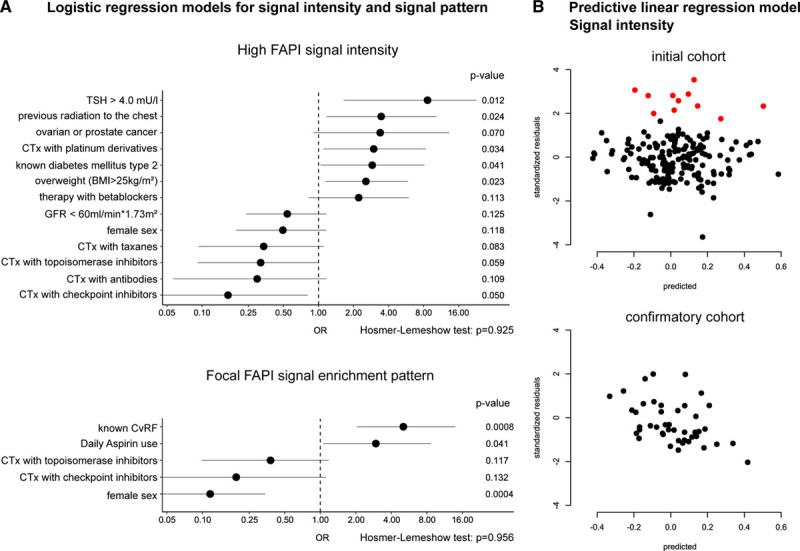
Results: Fourteen percent of patients had preexisting coronary artery disease (n=31), 33% arterial hypertension (n=75), and 12% diabetes mellitus type II (n=28). Forty-three percent had been treated with platin derivatives (n=100), 14% with anthracyclines (n=32), and 10% had a history of prior radiation to the chest (n=23). High left ventricular FAPI signals correlated with the presence of cardiovascular risk factors (odds ratio [OR], 4.3, P=0.0029), a focal myocardial signal pattern (OR, 3.9, P=0.0068), diabetes mellitus type II (OR, 4.1, P=0.046), and beta-blocker use (OR, 3.8, P=0.049) in univariate regression models. In a multivariate analysis, increased signal intensity was significantly higher in patients with cardiovascular risk factors (overweight [OR, 2.6, P=0.023], diabetes mellitus type II [OR, 2.9, P=0.041], certain chemotherapies [platinum derivatives; OR, 3.0, P=0.034], and a history of radiation to the chest [OR, 3.5, P=0.024]). A focal enrichment pattern was more frequently observed in patients with known cardiovascular risk factors (P<0.0001).
Conclusions: FAPI-positron emission tomography-computed tomography scans represent a new imaging modality to investigate cardiac FAP. High signal intensities correlate with cardiovascular risk factors and metabolic disease.
Keywords: diabetes mellitus; fibroblast; myocardial infarction; risk factors; tomography.
Conflict of interest statement
U. Haberkorn has a patent application for quinoline based FAP (fibroblast activation protein)-targeting agents for imaging and therapy in nuclear medicine and has shares of a consultancy-group for iTheranostics. The authors filed a patent application for quinoline based FAP-targeting agents for the diagnosis of cardiovascular disease.
Figures
Comment in
-
Sound and Fibroblast Activation Protein Inhibitor: Imaging Fibroblast Activation in the Heart.Circ Cardiovasc Imaging. 2020 Sep;13(9):e011603. doi: 10.1161/CIRCIMAGING.120.011603. Epub 2020 Sep 11. Circ Cardiovasc Imaging. 2020. PMID: 32912028 No abstract available.
References
-
- Tillmanns J, Hoffmann D, Habbaba Y, Schmitto JD, Sedding D, Fraccarollo D, Galuppo P, Bauersachs J. Fibroblast activation protein alpha expression identifies activated fibroblasts after myocardial infarction. J Mol Cell Cardiol. 2015; 87:194–203. doi: 10.1016/j.yjmcc.2015.08.016 - PubMed
-
- Kaur H, Takefuji M, Ngai CY, Carvalho J, Bayer J, Wietelmann A, Poetsch A, Hoelper S, Conway SJ, Möllmann H, et al. Targeted ablation of periostin-expressing activated fibroblasts prevents adverse cardiac remodeling in mice. Circ Res. 2016; 118:1906–1917. doi: 10.1161/CIRCRESAHA.116.308643 - PubMed
-
- Varasteh Z, Mohanta S, Robu S, Braeuer M, Li Y, Omidvari N, Topping G, Sun T, Nekolla SG, Richter A, et al. Molecular imaging of fibroblast activity after myocardial infarction using a 68Ga-labeled fibroblast activation protein inhibitor, FAPI-04. J Nucl Med. 2019; 60:1743–1749. doi: 10.2967/jnumed.119.226993 - PMC - PubMed
Publication types
MeSH terms
Substances
LinkOut - more resources
Full Text Sources
Medical
Miscellaneous
