

sn-spMF: matrix factorization informs tissue-specific genetic regulation of gene expression
- PMID: 32912314
- PMCID: PMC7488540
- DOI: 10.1186/s13059-020-02129-6
sn-spMF: matrix factorization informs tissue-specific genetic regulation of gene expression
Abstract
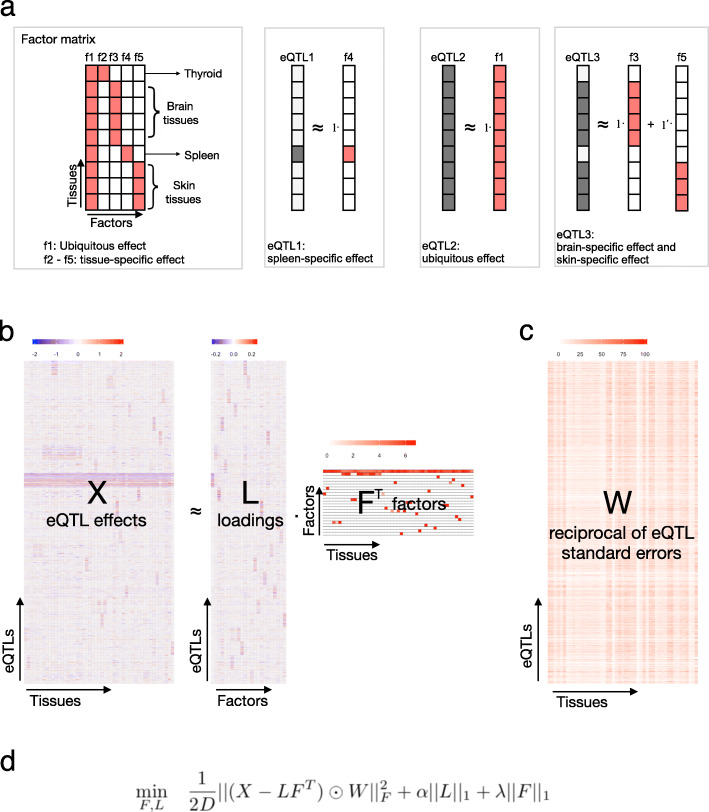
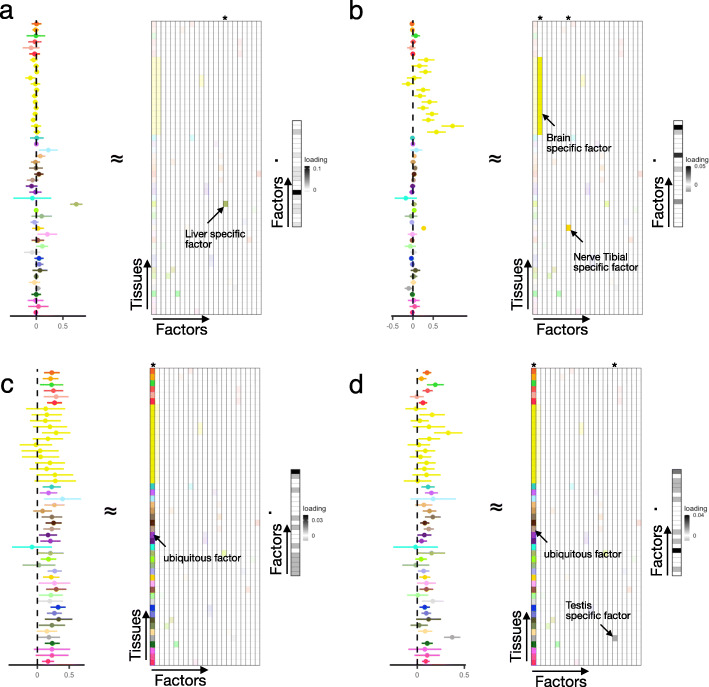
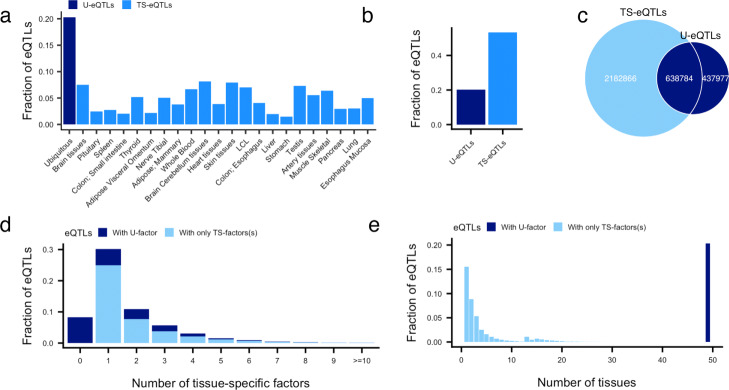
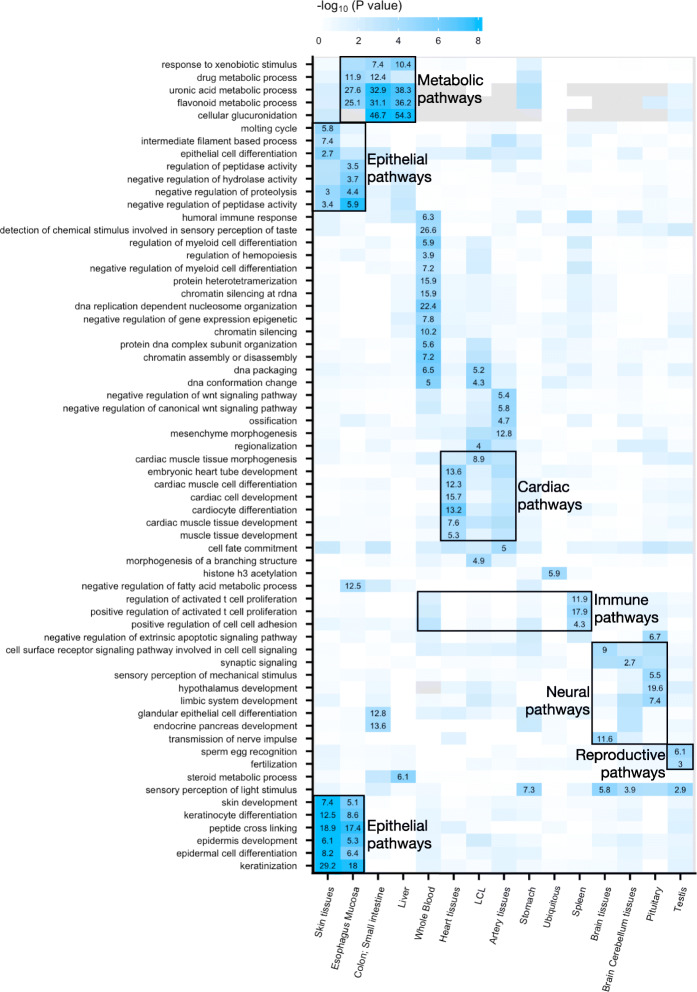
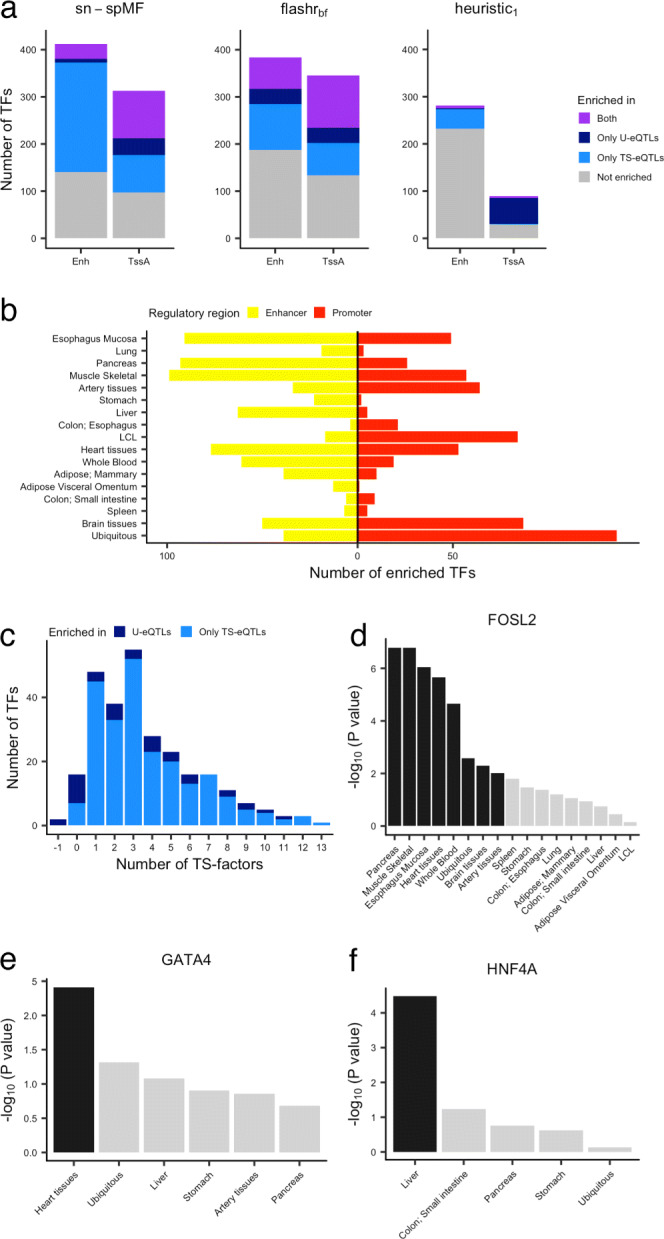
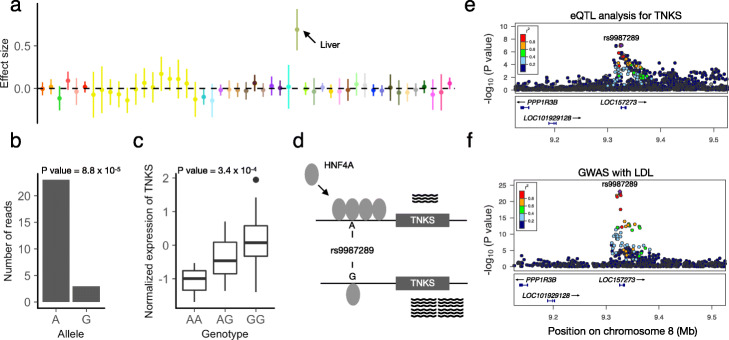
Genetic regulation of gene expression, revealed by expression quantitative trait loci (eQTLs), exhibits complex patterns of tissue-specific effects. Characterization of these patterns may allow us to better understand mechanisms of gene regulation and disease etiology. We develop a constrained matrix factorization model, sn-spMF, to learn patterns of tissue-sharing and apply it to 49 human tissues from the Genotype-Tissue Expression (GTEx) project. The learned factors reflect tissues with known biological similarity and identify transcription factors that may mediate tissue-specific effects. sn-spMF, available at https://github.com/heyuan7676/ts_eQTLs , can be applied to learn biologically interpretable patterns of eQTL tissue-specificity and generate testable mechanistic hypotheses.
Keywords: Matrix factorization; Tissue-specific eQTLs; Transcription factors; Ubiquitous eQTLs.
Conflict of interest statement
FA is an inventor on a patent application related to TensorQTL; HKI has received speaker honoraria from GSK and AbbVie.
Figures
Similar articles
-
Tissue specific regulation of transcription in endometrium and association with disease.Hum Reprod. 2020 Feb 29;35(2):377-393. doi: 10.1093/humrep/dez279. Hum Reprod. 2020. PMID: 32103259 Free PMC article.
-
Characterizing the Relation Between Expression QTLs and Complex Traits: Exploring the Role of Tissue Specificity.Behav Genet. 2018 Sep;48(5):374-385. doi: 10.1007/s10519-018-9914-2. Epub 2018 Jul 20. Behav Genet. 2018. PMID: 30030655 Free PMC article.
-
Biological characterization of expression quantitative trait loci (eQTLs) showing tissue-specific opposite directional effects.Eur J Hum Genet. 2019 Nov;27(11):1745-1756. doi: 10.1038/s41431-019-0468-4. Epub 2019 Jul 11. Eur J Hum Genet. 2019. PMID: 31296926 Free PMC article.
-
Transcription factor regulation of eQTL activity across individuals and tissues.PLoS Genet. 2022 Jan 31;18(1):e1009719. doi: 10.1371/journal.pgen.1009719. eCollection 2022 Jan. PLoS Genet. 2022. PMID: 35100260 Free PMC article.
-
Expression Quantitative Trait Loci Information Improves Predictive Modeling of Disease Relevance of Non-Coding Genetic Variation.PLoS One. 2015 Oct 16;10(10):e0140758. doi: 10.1371/journal.pone.0140758. eCollection 2015. PLoS One. 2015. PMID: 26474488 Free PMC article. Review.
Cited by
-
A scalable approach to characterize pleiotropy across thousands of human diseases and complex traits using GWAS summary statistics.Am J Hum Genet. 2023 Nov 2;110(11):1863-1874. doi: 10.1016/j.ajhg.2023.09.015. Epub 2023 Oct 24. Am J Hum Genet. 2023. PMID: 37879338 Free PMC article.
-
A compendium of uniformly processed human gene expression and splicing quantitative trait loci.Nat Genet. 2021 Sep;53(9):1290-1299. doi: 10.1038/s41588-021-00924-w. Epub 2021 Sep 6. Nat Genet. 2021. PMID: 34493866 Free PMC article.
-
Integrative genomic analyses identify neuroblastoma risk genes involved in neuronal differentiation.Hum Genet. 2024 Nov;143(11):1293-1309. doi: 10.1007/s00439-024-02700-2. Epub 2024 Aug 27. Hum Genet. 2024. PMID: 39192051 Free PMC article.
-
Redefining tissue specificity of genetic regulation of gene expression in the presence of allelic heterogeneity.Am J Hum Genet. 2022 Feb 3;109(2):223-239. doi: 10.1016/j.ajhg.2022.01.002. Epub 2022 Jan 31. Am J Hum Genet. 2022. PMID: 35085493 Free PMC article.
-
Abundant repressor binding sites in human enhancers are associated with the fine-tuning of gene regulation.iScience. 2024 Dec 20;28(1):111658. doi: 10.1016/j.isci.2024.111658. eCollection 2025 Jan 17. iScience. 2024. PMID: 39868043 Free PMC article.
References
-
- C Nica A, Parts L, Glass D, Nisbet J, Barrett A, Sekowska M, Travers M, Potter S, Grundberg E, Small K, K Hedman A, Bataille V, Bell J, Surdulescu G, S Dimas A, Ingle C, O Nestle F, Di Meglio P, Min J, Spector T. The architecture of gene regulatory variation across multiple human tissues: the muther study. PLoS Genet. 2011;7:1002003. - PMC - PubMed
-
- Battle A, Mostafavi S, Zhu X, Potash J, Weissman M, Mccormick C, Haudenschild C, Beckman K, Shi J, Mei R, Urban A, B Montgomery S, F Levinson D, Koller D. Characterizing the genetic basis of transcriptome diversity through rna-sequencing of 922 individuals. Genome Res. 2013; 24. 10.1101/gr.155192.113. - PMC - PubMed
-
- Innocenti F, M Cooper G, Stanaway I, Gamazon E, D Smith J, Mirkov S, Ramirez J, Liu W, S Lin Y, Moloney C, Force Aldred S, D Trinklein N, Schuetz E, A Nickerson D, E Thummel K, J Rieder M, Rettie A, J Ratain M, J Cox N, Brown C. Identification, replication, and functional fine-mapping of expression quantitative trait loci in primary human liver tissue. PLoS Genet. 2011;7:1002078. - PMC - PubMed
-
- Gibbs J, P van der Brug M, Hernandez D, J Traynor B, A Nalls M, Lai S-L, Arepalli S, Dillman A, Rafferty I, Troncoso J, Johnson R, Ronald Zielke H, Ferrucci L, Longo D, Cookson M, B Singleton A. Abundant quantitative trait loci exist for dna methylation and gene expression in human brain. PLoS Genet. 2010;6:1000952. - PMC - PubMed
Publication types
MeSH terms
Substances
Grants and funding
LinkOut - more resources
Full Text Sources
