

A vast resource of allelic expression data spanning human tissues
- PMID: 32912332
- PMCID: PMC7488534
- DOI: 10.1186/s13059-020-02122-z
A vast resource of allelic expression data spanning human tissues
Abstract
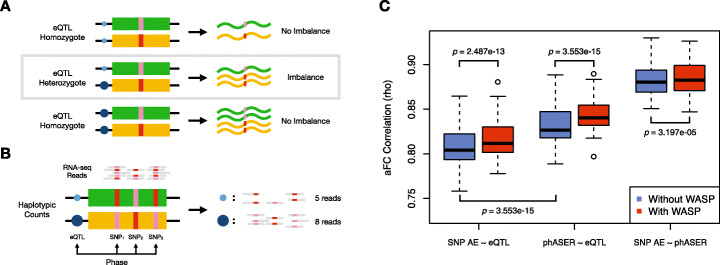
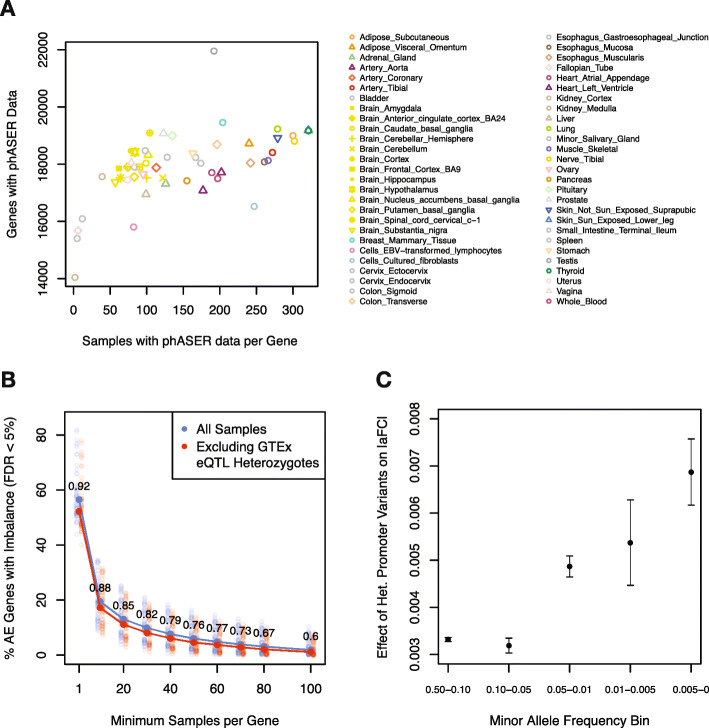
Allele expression (AE) analysis robustly measures cis-regulatory effects. Here, we present and demonstrate the utility of a vast AE resource generated from the GTEx v8 release, containing 15,253 samples spanning 54 human tissues for a total of 431 million measurements of AE at the SNP level and 153 million measurements at the haplotype level. In addition, we develop an extension of our tool phASER that allows effect sizes of cis-regulatory variants to be estimated using haplotype-level AE data. This AE resource is the largest to date, and we are able to make haplotype-level data publicly available. We anticipate that the availability of this resource will enable future studies of regulatory variation across human tissues.
Keywords: ASE; Allelic expression; Functional genomics; GTEx; Genomics; Regulatory variation; eQTL.
Conflict of interest statement
F.A. is an inventor on a patent application related to TensorQTL; S.E.C. is a co-founder, Chief Technology Officer, and stock owner at Variant Bio; T.L. is an advisory board member of Variant Bio with equity and Goldfinch Bio.
Figures
References
-
- Baran, Y., Subramaniam, M., Biton, A., Tukiainen, T., Tsang, E., Rivas, M., Pirinen, M., Gutierrez-Arcelus, M., Smith, K., Kukurba, K., Zhang, R., Eng, C., Torgerson, D., Urbanek, C., Consortium, t., Li, J., Rodriguez-Santana, J., Burchard, E., Seibold, M., MacArthur, D., Montgomery, S., Zaitlen, N., Lappalainen, T. (2015). The landscape of genomic imprinting across diverse adult human tissues. Genome Res 25(7), 927–936. - PMC - PubMed
-
- Rivas M, Pirinen M, Conrad D, Lek M, Tsang E, Karczewski K, Maller J, Kukurba K, DeLuca D, Fromer M, Ferreira P, Smith K, Zhang R, Zhao F, Banks E, Poplin R, Ruderfer D, Purcell S, Tukiainen T, Minikel E, Stenson P, Cooper D, Huang K, Sullivan T, Nedzel J, Consortium T, Consortium T, Bustamante C, Li J, Daly M, Guigo R, Donnelly P, Ardlie K, Sammeth M, Dermitzakis E, McCarthy M, Montgomery S, Lappalainen T, MacArthur D. Effect of predicted protein-truncating genetic variants on the human transcriptome. Science. 2015;348(6235):666–669. doi: 10.1126/science.1261877. - DOI - PMC - PubMed
Publication types
MeSH terms
Grants and funding
- R01MH106842/MH/NIMH NIH HHS/United States
- UL1TR002550-01/NH/NIH HHS/United States
- UL1 TR001114/TR/NCATS NIH HHS/United States
- R01GM122924/GM/NIGMS NIH HHS/United States
- R01 MH106842/MH/NIMH NIH HHS/United States
- UM1 HG008901/HG/NHGRI NIH HHS/United States
- R01 AG057422/AG/NIA NIH HHS/United States
- K99 HG009916/HG/NHGRI NIH HHS/United States
- 1U24DK112331/NH/NIH HHS/United States
- 5UL1 TR001114-05/NH/NIH HHS/United States
- R01 GM122924/GM/NIGMS NIH HHS/United States
- UM1HG008901/NH/NIH HHS/United States
- P30 DK020595/DK/NIDDK NIH HHS/United States
- R01MH101814/MH/NIMH NIH HHS/United States
LinkOut - more resources
Full Text Sources
Other Literature Sources
