

Comparative Effectiveness of the Sodium-Glucose Cotransporter 2 Inhibitor Empagliflozin Versus Other Antihyperglycemics on Risk of Major Adverse Kidney Events
- PMID: 32912850
- PMCID: PMC7576413
- DOI: 10.2337/dc20-1231
Comparative Effectiveness of the Sodium-Glucose Cotransporter 2 Inhibitor Empagliflozin Versus Other Antihyperglycemics on Risk of Major Adverse Kidney Events
Abstract
Objective: To examine the comparative effectiveness of the sodium-glucose cotransporter 2 inhibitor (SGLT2i) empagliflozin and other non-SGLT2i antihyperglycemics on the risk of major adverse kidney events (MAKE) of estimated glomerular filtration rate (eGFR) decline >50%, end-stage kidney disease, or all-cause mortality.
Research design and methods: In a cohort study of 379,033 new users of empagliflozin or other non-SGLT2i antihyperglycemics, predefined variables and covariates identified by a high-dimensional variable selection algorithm were used to build propensity scores. Weighted survival analyses were then applied to estimate the risk of MAKE.
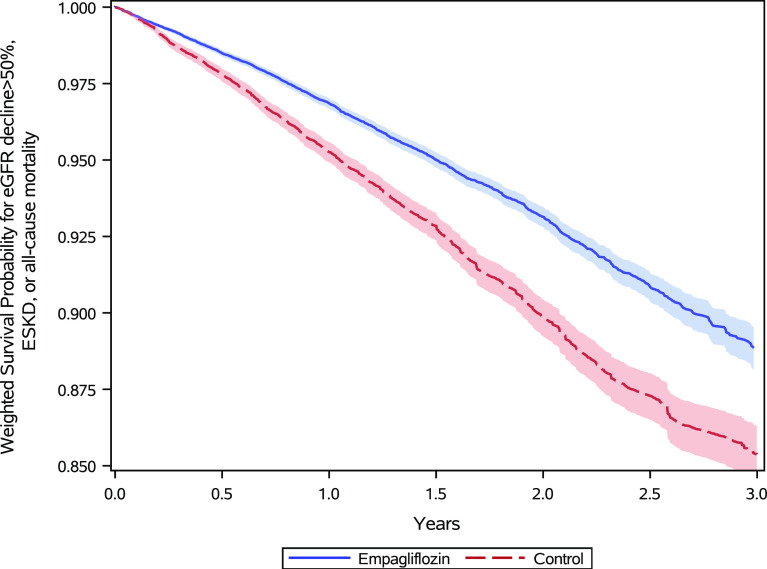
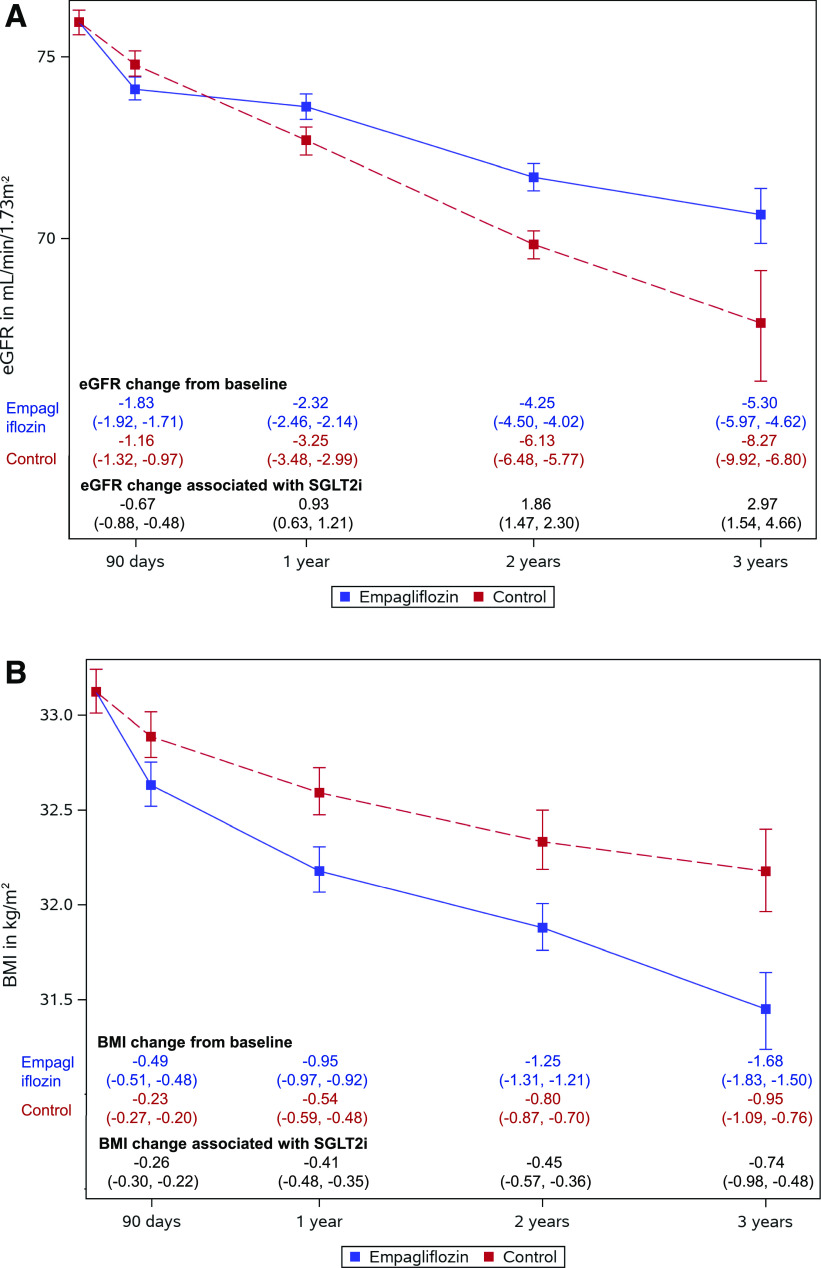
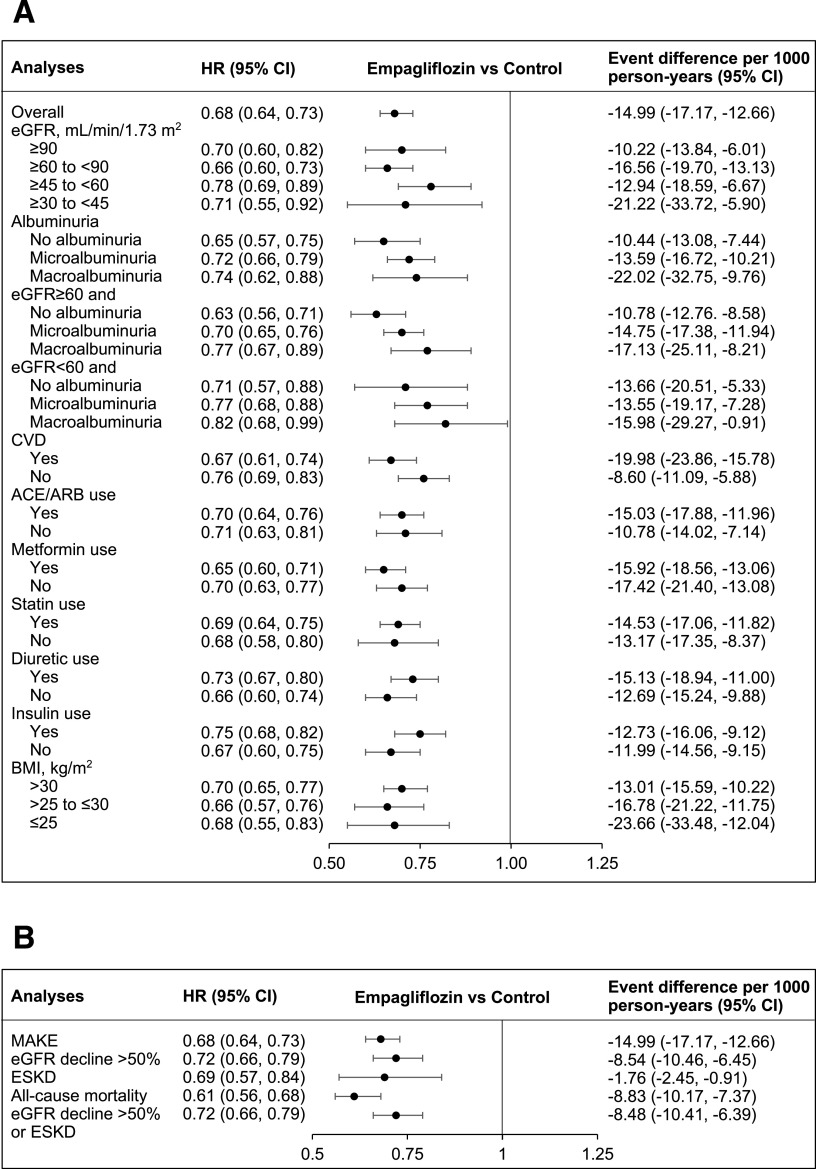
Results: Compared with other antihyperglycemics, empagliflozin use was associated with 0.99 (95% CI 0.51, 1.55) mL/min/1.73 m2 less annual reduction in eGFR, 0.25 (95% CI 0.16, 0.33) kg/m2 more annual decrease in BMI, and reduced risk of MAKE (hazard ratio [HR] 0.68 [95% CI 0.64, 0.73]). Empagliflozin use was associated with reduced risk of MAKE in eGFR ≥90, ≥60 to <90, ≥45 to <60, and ≥30 to <45 mL/min/1.73 m2 (HR 0.70 [95% CI 0.60, 0.82], 0.66 [0.60, 0.73], 0.78 [0.69, 0.89]), and 0.71 [0.55, 0.92], respectively), in participants without albuminuria, with microalbuminuria and macroalbuminuria (HR 0.65 [95% CI 0.57, 0.75], 0.72 [0.66. 0.79], and 0.74 [0.62, 0.88], respectively), and in participants with and without cardiovascular disease (HR 0.67 [95% CI 0.61, 0.74] and 0.76 [0.69, 0.83], respectively). The association was evident in per-protocol analyses, which required continuation of the assigned antihyperglycemic medication (empagliflozin or other antihyperglycemics) during follow-up (HR 0.64 [95% CI 0.60, 0.70]), and in analyses requiring concurrent use of metformin in at least the first 90 days of follow-up (HR 0.63 [0.57-0.69]).
Conclusions: Among people with type 2 diabetes, empagliflozin use was associated with eGFR preservation, a greater decline in BMI, and a reduced risk of MAKE compared with other non-SGLT2i antihyperglycemics.
© 2020 by the American Diabetes Association.
Figures
References
-
- GBD 2017 Disease and Injury Incidence and Prevalence Collaborators Global, regional, and national incidence, prevalence, and years lived with disability for 354 diseases and injuries for 195 countries and territories, 1990-2017: a systematic analysis for the Global Burden of Disease Study 2017 [published correction appears in Lancet 2019;393:e44]. Lancet 2018;392:1789–1858 - PMC - PubMed
-
- Xie Y, Bowe B, Mokdad AH, et al. . Analysis of the Global Burden of Disease study highlights the global, regional, and national trends of chronic kidney disease epidemiology from 1990 to 2016. Kidney Int 2018;94:567–581 - PubMed
-
- GBD 2017 DALYs and HALE Collaborators Global, regional, and national disability-adjusted life-years (DALYs) for 359 diseases and injuries and healthy life expectancy (HALE) for 195 countries and territories, 1990-2017: a systematic analysis for the Global Burden of Disease Study 2017. Lancet 2018;392:1859–1922 - PMC - PubMed
Publication types
MeSH terms
Substances
Associated data
Grants and funding
LinkOut - more resources
Full Text Sources
Medical
Research Materials
Miscellaneous
