. 2020 Sep;8(2):e000473.
doi: 10.1136/jitc-2019-000473.

CyTOF mass cytometry reveals phenotypically distinct human blood neutrophil populations differentially correlated with melanoma stage

Affiliations

CyTOF mass cytometry reveals phenotypically distinct human blood neutrophil populations differentially correlated with melanoma stage

Yanfang Peipei Zhu et al. J Immunother Cancer. 2020 Sep.

Abstract

Background: Understanding neutrophil heterogeneity and its relationship to disease progression has become a recent focus of cancer research. Indeed, several studies have identified neutrophil subpopulations associated with protumoral or antitumoral functions. However, this work has been hindered by a lack of widely accepted markers with which to define neutrophil subpopulations.

Methods: To identify markers of neutrophil heterogeneity in cancer, we used single-cell cytometry by time-of-flight (CyTOF) coupled with high-dimensional analysis on blood samples from treatment-naïve patients with melanoma.

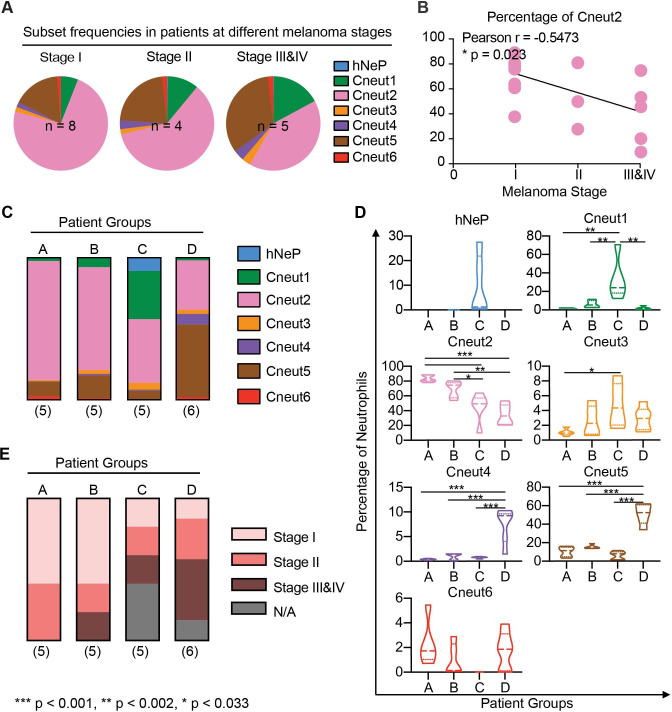
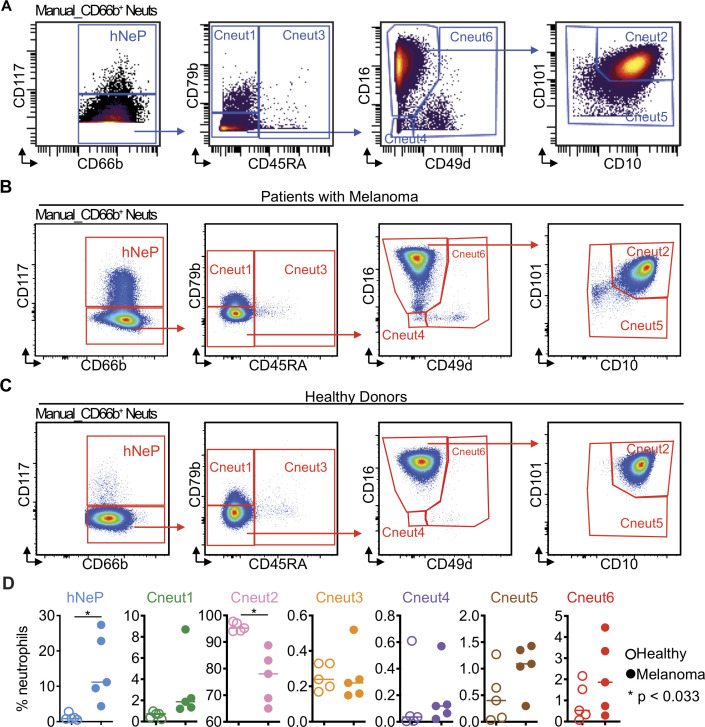
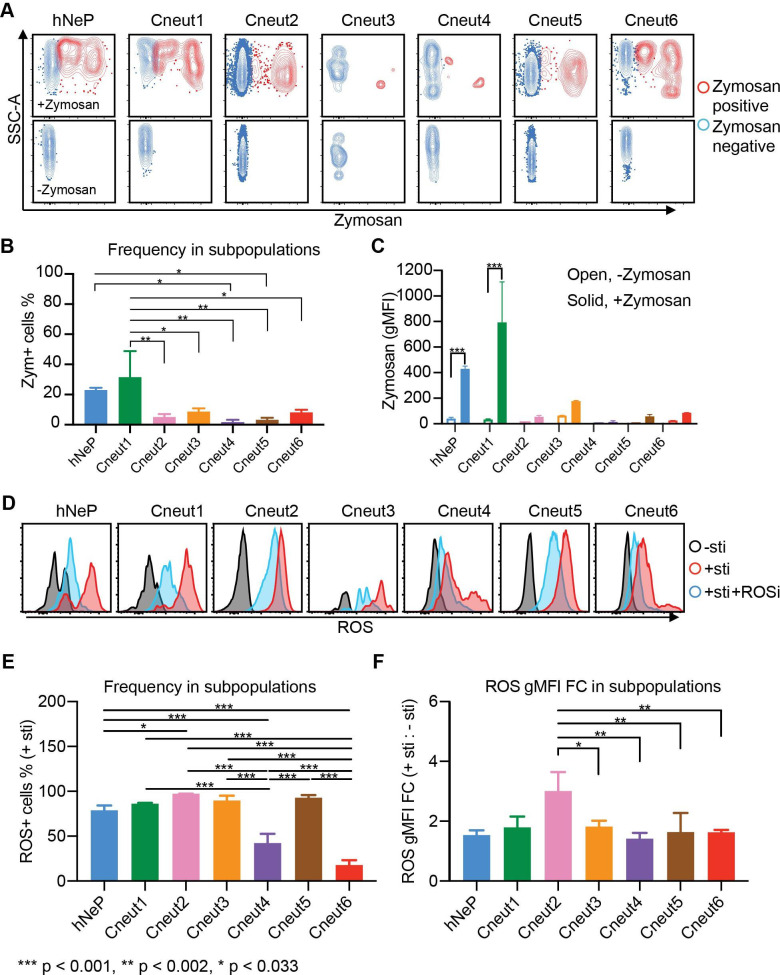
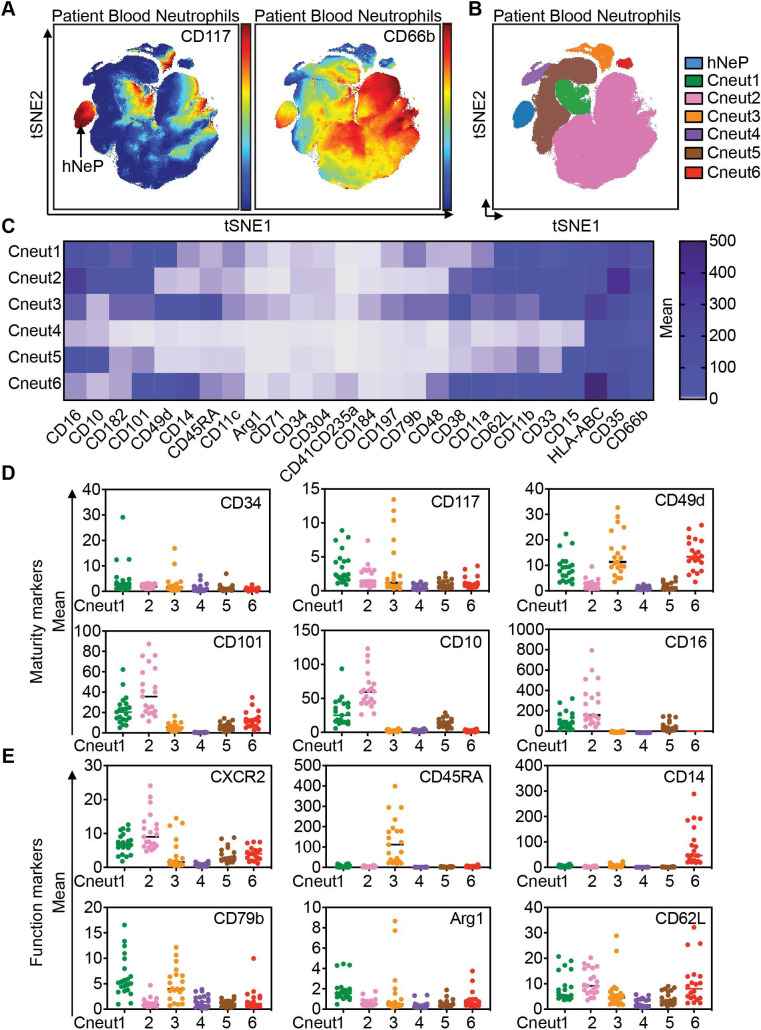
Results: Our efforts allowed us to identify seven blood neutrophil clusters, including two previously identified individual populations. Interrogation of these neutrophil subpopulations revealed a positive trend between specific clusters and disease stage. Finally, we recapitulated these seven blood neutrophil populations via flow cytometry and found that they exhibited diverse capacities for phagocytosis and reactive oxygen species production in vitro.

Conclusions: Our data provide a refined consensus on neutrophil heterogeneity markers, enabling a prospective functional evaluation in patients with solid tumors.

Keywords: haematology; immunology.


Conflict of interest statement

Competing interests: None declared.

Figures

Figure 1
Figure 1
Neutrophil heterogeneity in patients with melanoma correlates with disease stage. (A) Pie charts show mean percentages for each FlowSOM cluster (hNeP and Cneut1–6) in total blood neutrophils of patients grouped by melanoma stage. Only patients with a melanoma stage diagnosis shown in table 2 were used for this analysis. The numbers of subjects in each melanoma stage are indicated on the graph. (B) Line regression analysis shown in dot plot depicting correlations between neutrophil cluster frequency and melanoma stage. Each dot represents one patient. Pearson analysis results are shown for each cluster. P values were calculated based on two-tailed comparisons with 95% CIs and shown in APA style. (C) Bar graph shows the mean percentage of each cluster in patient groups A–D. All patients were used for this analysis, regardless of whether or not they received a melanoma stage diagnosis (table 2). The numbers of subjects in each group are indicated below each column. (D) Violin plots show the neutrophil cluster frequency in patient pools A–D. Quartiles and median values of each patient pool are indicated as dotted lines. All patients were used for this analysis regardless of whether or not they received a melanoma stage diagnosis (table 2). Differences between groups were determined by using ordinary one-way analysis of variance and Tukey’s multiple comparison test with a single pooled variance. Error bars indicate mean±SD. P values were calculated based on two-tailed comparisons with 95% CIs and shown in APA style. (E) Bar graph shows the percentage of patients at different melanoma stages (table 2) in patient groups –D. All the patients were used for this analysis regardless of whether or not they received a melanoma stage diagnosis (table 2). The numbers of patients in each pool are indicated below each column. APA' American Psychological Association; FlowSOM, analysis of mass cytometry data with a self-organizing map; hNeP, human neutrophil progenitor; N/A, missing diagnosis information of patients.
Figure 2
Figure 2
Flow cytometry replicates the seven neutrophil subpopulations. (A) CD66b+ blood neutrophils were manually selected and subjected to sequential gating to identify the neutrophil subpopulations with CyTOF. Scales are shown in arcsinh transformation with cofactor equal to 5. (B) The gating strategy from (A) was validated by flow cytometry in treatment-naïve patients with melanoma. Scales are shown in biexponential scale. (C) Flow cytometry analysis of healthy donor’s blood neutrophils with the gating strategy from (A). Scales are shown in biexponential scale. (D) Flow cytometry analysis of the frequency of each manually gated neutrophil subpopulation in total blood neutrophils. Five healthy donors (age 23–46, two women and three men) and five treatment-naïve patients with melanoma (aged 59–79 years, two women and three men) were analyzed. Each dot represents the result of one patient. Paired t-tests were used to compare the differences between healthy patients and patients with melanoma. Error bars indicate mean±SD. P values were calculated based on two-tailed comparisons with 95% CIs and shown in APA style. CyTOF, cytometry by time-of-flight; hNeP, human neutrophil progenitor.
Figure 3
Figure 3
Seven neutrophil subpopulations harbor diverse phagocytic and ROS-producing capacities. Three randomly selected melanoma-naïve patients (ages 59, 77 and 79; one woman and two men) were analyzed with flow cytometry. (A–C) RBC-lysed blood samples were incubated with prelabeled zymosan particles for 2.5 hours. Afterwards, the cells were harvested and stained with the flow cytometry panels described in figure 2 and online supplementary figure 6C. Each neutrophil subpopulation was gated to evaluate its uptake of zymosan particles. (A) The zymosan-positive cells are shown in red; the zymosan-negative cells are shown in blue. The no-zymosan group (−zymosan) is shown in the bottom panels as the control group. (B) Percentage of the zymosan-positive cells (red dots in A) in each gated neutrophil subpopulation. Error bars indicate mean with SD. (C) gMFI of zymosan in each gated neutrophil subpopulation. Error bars indicate mean with SD. (D) Seven neutrophil subpopulations’ ability to produce ROS is determined by flow cytometry. RBC-lysed blood samples were split into three groups and incubated with −sti, +sti, or sti+ROSi. Afterwards, each neutrophil subpopulation was gated for evaluation of ROS+ cells. Histogram plots show the gated neutrophil subpopulations in each group: −sti is shown in black; +sti is shown in red; +sti+ROSi is shown in blue. (E) Percentage of the ROS+ cells in each gated neutrophil subpopulation from the +sti group. Error bars indicate mean with SD. (F) ROS gMFI FC of each gated neutrophil subpopulation from the +sti group to the −sti group. Statistics: (B, E, F) differences between groups were determined by using ordinary one-way ANOVA and Tukey’s multiple comparison test with a single pooled variance. (C) Ordinary two-way ANOVA and Sidak’s multiple comparison test with individual variances computed for each comparison were performed to compare between +zymosan and −zymosan groups. Error bars indicate mean±SD. P values were calculated based on two-tailed comparisons with 95% CIs and shown in APA style. APA, American Psychological Association; ANOVA, analysis of variance; FC, fold change; gMFI, geometric mean fluorescence intensity; hNeP, human neutrophil progenitor; RBC, red blood cell; ROS, reactive oxygen species; ROSi, reactive oxygen species inhibitor; SSC-A, −sti, no stimulation; +sti, ROS inducer (pyocyanin) alone.
Figure 4
Figure 4
CyTOF-based analysis of blood from patients with melanoma reveals seven automated neutrophil clusters. The blood neutrophils (the CD66b+ automated cluster from online supplementary figure 1B) from treatment-naïve patients with melanoma were subjected to automated analysis. (A) Mean intensities of CD117 and CD66b expression are shown on viSNE map as spectrum colored dots (low in blue, high in red). hNeP was identified on the viSNE map based on the expression of CD117+CD66b+. (B) FlowSOM analysis of the viSNE results revealed seven automated clusters. (C) Heatmap shows the mean intensity of each marker in the six unidentified automated clusters on a global scale. (D) Dot plot shows the mean intensity of each maturity marker in the six unidentified automated clusters. Each dot represents the result of one patient. (E) Dot plot shows the mean intensity of each functional marker in the six unidentified automated clusters. Each dot represents the result of one patient. CyTOF, cytometry by time-of-flight; FlowSOM, analysis of mass cytometry data with a self-organizing map; hNeP, human neutrophil progenitor; viSNE, visualization of t-distributed stochastic neighbor embedding.

References

    1. Ley K, Hoffman HM, Kubes P, et al. . Neutrophils: new insights and open questions. Sci Immunol 2018;3. 10.1126/sciimmunol.aat4579. [Epub ahead of print: 07 Dec 2018]. - DOI - PubMed
    1. Fliedner TM, Cronkite EP, Killmann SA, et al. . Granulocytopoiesis. II. emergence and pattern of labeling of neutrophilic granulocytes in humans. Blood 1964;24:683–700. 10.1182/blood.V24.6.683.683 - DOI - PubMed
    1. Hidalgo A, Chilvers ER, Summers C, et al. . The neutrophil life cycle. Trends Immunol 2019;40:584–97. 10.1016/j.it.2019.04.013 - DOI - PubMed
    1. Pillay J, den Braber I, Vrisekoop N, et al. . In vivo labeling with 2H2O reveals a human neutrophil lifespan of 5.4 days. Blood 2010;116:625–7. 10.1182/blood-2010-01-259028 - DOI - PubMed
    1. Berliner N, Coates TD. Introduction to a review series on human neutrophils. Blood 2019;133:2111–2. 10.1182/blood-2019-01-891770 - DOI - PubMed

Publication types