Comparative Study
. 2020 Dec;184(4):2022-2039.
doi: 10.1104/pp.19.01540. Epub 2020 Sep 10.

SMALL ORGAN4 Is a Ribosome Biogenesis Factor Involved in 5.8S Ribosomal RNA Maturation

Affiliations
Comparative Study

SMALL ORGAN4 Is a Ribosome Biogenesis Factor Involved in 5.8S Ribosomal RNA Maturation

Rosa Micol-Ponce et al. Plant Physiol. 2020 Dec.

Abstract

Ribosome biogenesis is crucial for cellular metabolism and has important implications for disease and aging. Human (Homo sapiens) glioma tumor-suppressor candidate region gene2 (GLTSCR2) and yeast (Saccharomyces cerevisiae) Nucleolar protein53 (Nop53) are orthologous proteins with demonstrated roles as ribosome biogenesis factors; knockdown of GLTSCR2 impairs maturation of 18S and 5.8S ribosomal RNAs (rRNAs), and Nop53 is required for maturation of 5.8S and 25S rRNAs. Here, we characterized SMALL ORGAN4 (SMO4), the most likely ortholog of human GLTSCR2 and yeast Nop53 in Arabidopsis (Arabidopsis thaliana). Loss of function of SMO4 results in a mild morphological phenotype; however, we found that smo4 mutants exhibit strong cytological and molecular phenotypes: nucleolar hypertrophy and disorganization, overaccumulation of 5.8S and 18S rRNA precursors, and an imbalanced 40S:60S ribosome subunit ratio. Like yeast Nop53 and human GLTSCR2, Arabidopsis SMO4 participates in 5.8S rRNA maturation. In yeast, Nop53 cooperates with mRNA transport4 (Mtr4) for 5.8S rRNA maturation. In Arabidopsis, we found that SMO4 plays similar roles in the 5.8S rRNA maturation pathway than those described for MTR4. However, SMO4 seems not to participate in the degradation of by-products derived from the 5'-external transcribed spacer (ETS) of 45S pre-rRNA, as MTR4 does.


Figures

Figure 1.
Figure 1.
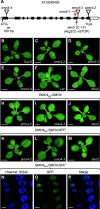
SMO4 gene structure, rosette phenotypes and phenotypic rescue of smo4 mutants, and subnuclear localization of the SMO4 protein. A, Schematic representation of SMO4 gene structure including the molecular nature and positions of the mutations studied in this work. The SMO4.2 (AT2G40430.2) gene model, which corresponds to the splice variant that is predicted to produce the largest SMO4 protein, is shown. The start (ATG) and stop (TGA) codon positions are also indicated. Black and white boxes represent exons and 5′ and 3′ untranslated regions, respectively. Lines between boxes represent introns, and triangles indicate T-DNA insertions. Red arrows indicate the positions of the 14-bp deletion of smo4-1 and the single-base substitution of den2. B to M, Rosette morphological phenotypes of Col-0 (B), smo4-2 (C), smo4-3 (D), smo4-4 (E), Ler (F), den2 (G), smo4-2 SMO4pro:SMO4 (H), smo4-3 SMO4pro:SMO4 (I), den2 SMO4pro:SMO4 (J), smo4-2 SMO4pro:SMO4:GFP (K), smo4-3 SMO4pro:SMO4:GFP (L), and den2 SMO4pro:SMO4:GFP (M) plants. All plants were homozygous for the mutant alleles and the transgenes shown. Photographs were taken 14 das. Bars = 3 mm. N to P, Confocal laser-scanning micrographs of cells from the root elongation zone of plants homozygous for the SMO4pro:SMO4:GFP transgene in the Col-0 background. Fluorescent signals correspond to Hoechst 33342 (N), GFP (O), and their overlay (P). Bars = 5 µm.
Figure 2.
Figure 2.
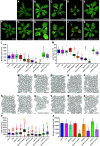
Genetic interactions of smo4-3 with mas2-1, mtr4-2, parl1-2, and nuc2-2. A to K, Rosettes of Ler (A), mas2-1 (B), mtr4-2 (C), parl1-2 (D), nuc2-2 (E), Col-0 (F), smo4-3 (G), smo4-3 mas2-1 (H), smo4-3 mtr4-2 (I), smo4-3 parl1-2 (J), and smo4-3 nuc2-2 (K) plants. Photographs were taken 21 das. Bars = 2 mm. L and M, Box plots showing the distribution of rosette (L) and leaf (M) areas in plants of the genotypes shown. Boxes are delimited by the first (Q1; bottom hinge) and third (Q3; top hinge) quartiles. Whiskers represent Q1 − 1.5 × IQR (bottom) and Q3 + 1.5 × IQR (top), where the interquartile range (IQR) is Q3 − Q1. Black diamonds = means; black lines = medians; red crosses = outliers; and red circles = extreme minimum (less than Q1 − 3 × IQR) or maximum (greater than Q3 + 3 × IQR) outliers. Asterisks indicate values significantly different from the corresponding wild-type or parental line (indicated by color) by Student’s t test (*P < 0.05; **P < 0.01; and ****P < 0.0001). More than 20 rosettes and 10 first-node leaves collected 21 das were analyzed per genotype. N to X, Diagrams of the subepidermal layer of palisade mesophyll cells from first-node leaves collected 21 das. Bars = 40 µm. Y, Box plot showing the distribution of cell sizes in the subepidermal layer of palisade mesophyll cells from first‐node leaves. Z, Number of palisade mesophyll cells of the subepidermal layer per leaf. Ten leaves collected 21 das were studied per genotype in Y and Z, and more than 230 cells were analyzed per genotype in Y. Error bars indicate sd. Asterisks indicate values significantly different from the corresponding wild-type or single-mutant parental line (indicated by color) by Student’s t test (*P < 0.05; **P < 0.01; ***P < 0.001; and ****P < 0.0001).
Figure 3.
Figure 3.
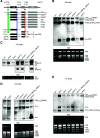
Visualization by RNA gel blots of 45S pre-rRNA processing in the smo4-2, smo4-3, den2, and mtr4-2 single mutants. A, Diagram (modified from Hang et al. [2014]) illustrating the pre-rRNA processing intermediates that can be detected in RNA gel blots using the S2, S7, or S9 probes. The precursor regions hybridizing with the probes are highlighted in green (S2 probe), blue (S7), and red (S9). Vertical bars indicate the endonucleolytic cleavage sites relevant to this study (P, P′, A2, A3, E′, and C2). B to E, Visualization of the processing of 5.8S (B and C) and 18S (D and E) rRNA precursors using RNA gel blots. Total RNA was separated on formaldehyde-agarose (B, D, and E) or polyacrylamide-urea (C) gels, transferred to a nylon membrane, and hybridized with the S9 (B and C), S2 (D), or S7 (E) probe. Two views of the bands visualized from smo4-3, smo4-2, and mtr4-2 RNA with the S9 probe are provided in C, one of which corresponds to a very short exposure time, which allowed 7S and 5.8S+70 pre-rRNAs to be distinguished. EtBr, Ethidium bromide-stained gels, visualized before blotting, which served as loading controls. Similar results were obtained in at least two independent experiments. Relative quantification of the bands visualized with the S9, S7, and S2 probes is shown in Supplemental Table S5.
Figure 4.
Figure 4.
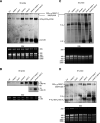
Visualization by RNA gel blots of 45S pre-rRNA processing in the smo4-3 mas2-1 and smo4-3 mtr4-2 double mutants. RNA gel blots using the S9 (A and B), S2 (C), and S7 (D) probes are shown. Total RNA was separated on formaldehyde-agarose (A, C, and D) and polyacrylamide-urea (B) gels, transferred to a nylon membrane, and hybridized with the corresponding probe. Two views of the bands visualized from smo4-3 mtr4-2 RNA with the S9 probe are provided in B, one of which corresponds to a very short exposure time, which allowed 7S and 5.8S+70 pre-rRNAs to be distinguished. EtBr, Ethidium bromide-stained gels, visualized before blotting, which served as loading controls. Similar results to those shown here were obtained in at least two independent experiments. Relative quantification of the bands visualized with the S9, S7, and S2 probes from smo4-3 mtr4-2 RNA is shown in Supplemental Table S6.
Figure 5.
Figure 5.
Visualization by circular RT-PCR amplification of 45S pre-rRNA processing in the smo4-2, smo4-3, den2, and mtr4-2 mutants. Ethidium bromide-stained agarose gels visualizing products from the circular RT-PCR amplifications performed are shown. RNA was extracted and circularized with T4 RNA ligase and reverse transcribed using the rt1 (A–D) or rt2 (E) primer, and the resulting cDNA was PCR amplified with the r5 + r6 (A), r5 + r7 (B), r5 + r8 (C), r5 + r2 (D), and r1 + r2 (E) primer pairs. The full names of the rt1 and rt2 primers were 18c and 5.8SrRNA_R, respectively. Diagrams illustrate all (D) or part (A–C and E) of the 45S pre-rRNA, represented in black and gray (see Fig. 3A), with indication of the positions of the primers used for circular RT-PCR amplifications. Circular RT-PCR products are shown in red. Given that the primers used are divergent, part of the cDNA obtained from each circularized rRNA precursor (dotted red lines) is absent from the final circular RT-PCR products.
Figure 6.
Figure 6.
Subcellular localization of 5.8S and 18S rRNA precursors in the smo4-3, den2, and mtr4-2 mutants. A to D1, RNA-FISH assays in palisade mesophyll cells from first-node leaves of Col-0 (A–F), smo4-3 (G–L), mtr4-2 (M–R), Ler (S–X), and den2 (Y–D1). Fluorescent signals correspond to 4′,6-diamidino-2-phenylindole (DAPI; A, D, G, J, M, P, S, V, Y, and B1), which was used as a nuclear marker (in blue); S9 probe labeled with Cy3 (in red; B, H, N, T, and Z); S2 probe labeled with FAM (in green; E, K, Q, W, and C1); and the overlay of the previous signals (C, F, I, L, O, R, U, X, A1, and D1). Photographs were taken from plants collected 14 das. Bars = 25 µm. E1 and F1, Relative fluorescence intensity from the S9 (E1) and S2 (F1) probes, measured in 10 nuclei per leaf from six leaves per genotype. Error bars indicate sd. Asterisks indicate values significantly different from the corresponding wild type (indicated by color) by Student’s t test (***P < 0.001 and ****P < 0.0001).
Figure 7.
Figure 7.
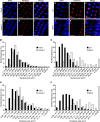
Quantification of nucleolar size in root cells of smo4-3 and den2 mutants. A to L, Visualization by immunolocalization of the fibrillarin nucleolar marker in Col-0 (A–C), Ler (D–F), smo4-3 (G–I), and den2 (J–L) plants. Fluorescent signals correspond to DAPI (A, D, G, and J), the secondary antibody for fibrillarin detection (B, E, H, and K), and their overlay (C, F, I, and L). Bars = 10 µm. M to P, Distribution of the sizes of nuclei (M and N) and nucleoli (O and P) of the smo4-3 and den2 mutants and their corresponding wild types. Between 287 and 554 cells were studied per genotype, from the roots of five seedlings of each genotype, collected 5 das. Nuclei and nucleoli size distributions of smo4-3 and den2 were significantly different from the corresponding wild type in a Kolmogorov-Smirnov test (P < 0.0001).
Figure 8.
Figure 8.
Ribosome profiles of the smo4 mutants. Extracts from the aerial organs of wild-type (A), smo4-2 (B), smo4-3 (C), and smo4-3 SMO4pro:SMO4 (D) plants were collected 18 das and then lysed and fractionated through 15% to 60% sucrose gradients by ultracentrifugation. The percentage of the full scale of absorbance was monitored at 254 nm. Peaks corresponding to 40S and 60S ribosomal subunits, 80S monosomes, 90S preribosome, and polysomes are indicated. The asterisks indicate an unknown particle.

Comment in

References

    1. Arnon DI.(1949) Copper enzymes in isolated chloroplasts: Polyphenoloxidase in Beta vulgaris. Plant Physiol 24: 1–15 - PMC - PubMed
    1. Baumberger N, Baulcombe DC(2005) Arabidopsis ARGONAUTE1 is an RNA Slicer that selectively recruits microRNAs and short interfering RNAs. Proc Natl Acad Sci USA 102: 11928–11933 - PMC - PubMed
    1. Berná G, Robles P, Micol JL(1999) A mutational analysis of leaf morphogenesis in Arabidopsis thaliana. Genetics 152: 729–742 - PMC - PubMed
    1. Bernstein KA, Gallagher JE, Mitchell BM, Granneman S, Baserga SJ(2004) The small-subunit processome is a ribosome assembly intermediate. Eukaryot Cell 3: 1619–1626 - PMC - PubMed
    1. Burgute BD, Peche VS, Müller R, Matthias J, Gaßen B, Eichinger L, Glöckner G, Noegel AA(2016) The C-terminal SynMuv/DdDUF926 domain regulates the function of the N-terminal domain of DdNKAP. PLoS ONE 11: e0168617. - PMC - PubMed

Publication types

Substances