. 2020 Sep 29;117(39):24384-24391.
doi: 10.1073/pnas.2015486117. Epub 2020 Sep 10.

Suboptimal SARS-CoV-2-specific CD8+ T cell response associated with the prominent HLA-A*02:01 phenotype

Affiliations

Suboptimal SARS-CoV-2-specific CD8+ T cell response associated with the prominent HLA-A*02:01 phenotype

Jennifer R Habel et al. Proc Natl Acad Sci U S A. .

Abstract

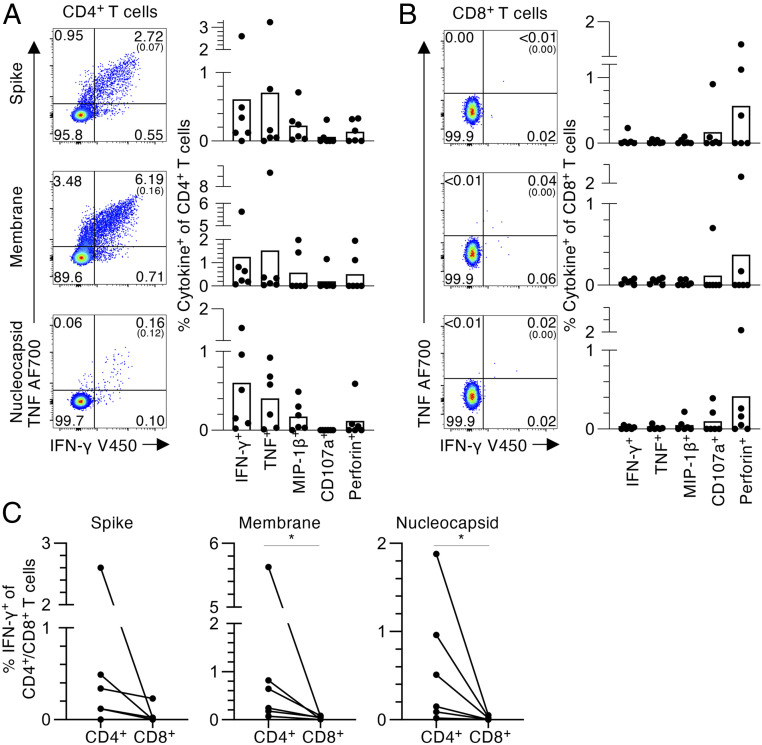
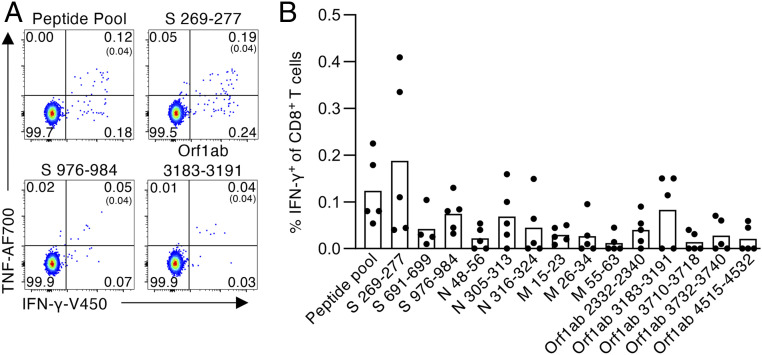
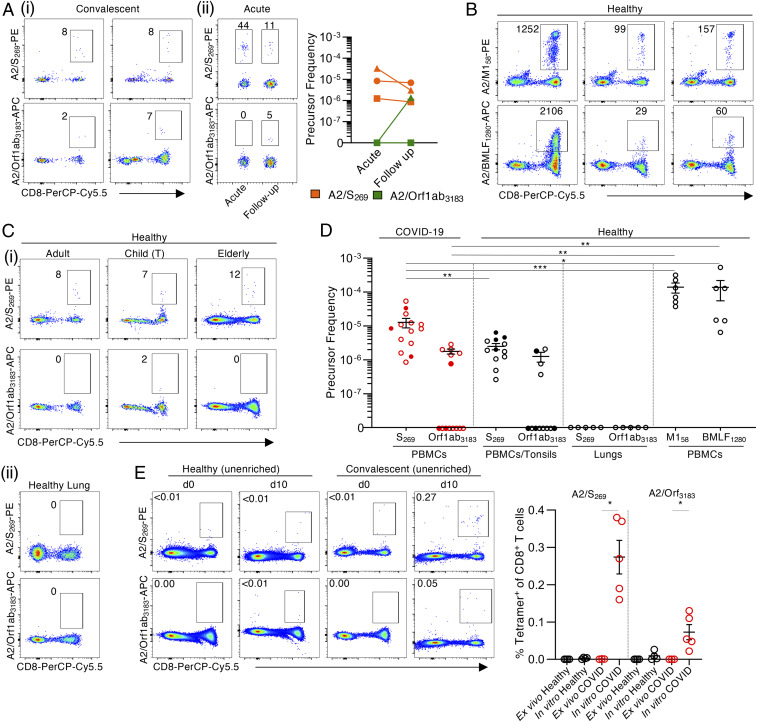
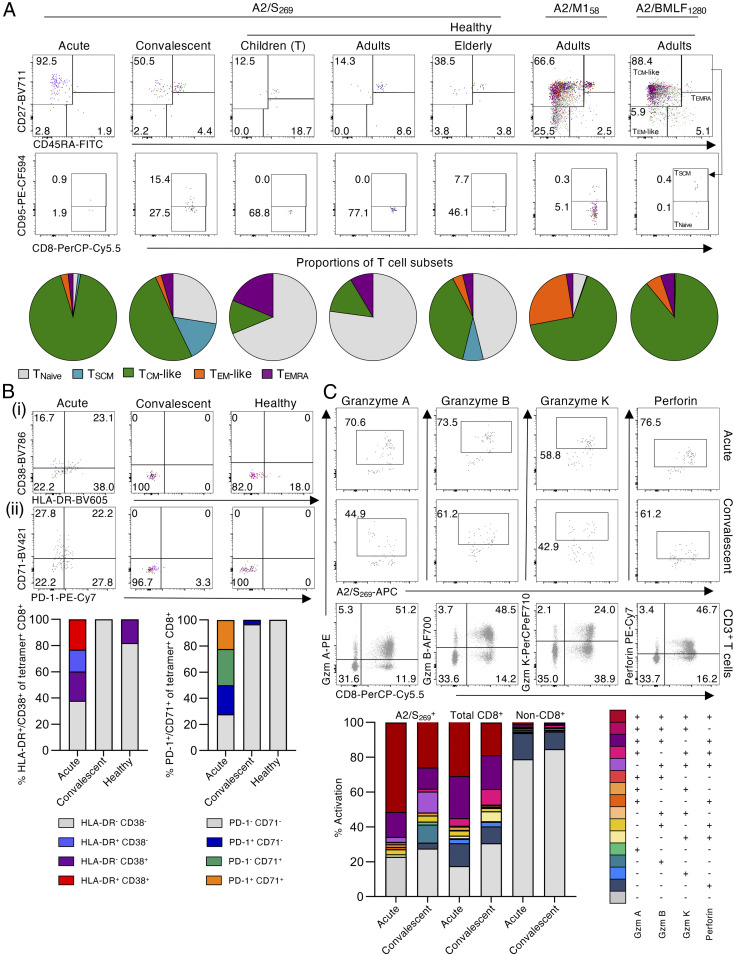
An improved understanding of human T cell-mediated immunity in COVID-19 is important for optimizing therapeutic and vaccine strategies. Experience with influenza shows that infection primes CD8+ T cell memory to peptides presented by common HLA types like HLA-A2, which enhances recovery and diminishes clinical severity upon reinfection. Stimulating peripheral blood mononuclear cells from COVID-19 convalescent patients with overlapping peptides from severe acute respiratory syndrome coronavirus 2 (SARS-CoV-2) led to the clonal expansion of SARS-CoV-2-specific CD8+ and CD4+ T cells in vitro, with CD4+ T cells being robust. We identified two HLA-A*02:01-restricted SARS-CoV-2-specfic CD8+ T cell epitopes, A2/S269-277 and A2/Orf1ab3183-3191 Using peptide-HLA tetramer enrichment, direct ex vivo assessment of A2/S269+CD8+ and A2/Orf1ab3183+CD8+ populations indicated that A2/S269+CD8+ T cells were detected at comparable frequencies (∼1.3 × 10⁻⁵) in acute and convalescent HLA-A*02:01+ patients. These frequencies were higher than those found in uninfected HLA-A*02:01+ donors (∼2.5 × 10⁻⁶), but low when compared to frequencies for influenza-specific (A2/M158) and Epstein-Barr virus (EBV)-specific (A2/BMLF1280) (∼1.38 × 10⁻⁴) populations. Phenotyping A2/S269+CD8+ T cells from COVID-19 convalescents ex vivo showed that A2/S269+CD8+ T cells were predominantly negative for CD38, HLA-DR, PD-1, and CD71 activation markers, although the majority of total CD8+ T cells expressed granzymes and/or perforin. Furthermore, the bias toward naïve, stem cell memory and central memory A2/S269+CD8+ T cells rather than effector memory populations suggests that SARS-CoV-2 infection may be compromising CD8+ T cell activation. Priming with appropriate vaccines may thus be beneficial for optimizing CD8+ T cell immunity in COVID-19.

Keywords: CD8+ T cells; COVID-19; HLA-A*02:01; SARS-CoV-2 epitopes.


Conflict of interest statement

The authors declare no competing interest.

Figures

Fig. 1.
Fig. 1.
CD4+ and CD8+ T cell responses to SARS-CoV-2 overlapping peptide pools. (A) CD4+ and (B) CD8+ T cell responses to SARS-CoV2 S, M, and N peptide pools in convalescent COVID-19 individuals. (i) Representative fluorescence-activated cell sorter (FACS) plots showing IFN-γ and TNF staining of (A) CD4+ or (B) CD8+ T cell populations. (ii) Frequencies of IFN-γ+, TNF+, MIP-1β+, CD107a+ or perforin+ within the (A) CD4+ or (B) CD8+ T cells, with background staining subtracted (n = 6, mean). Background staining values are shown in brackets. Data points show individual COVID-19 convalescent subjects. (C) Paired frequencies of IFN-γ+ CD4+ and CD8+ T cells for S, N, and M peptide pools. Statistical significance was determined with Wilcoxon matched-pairs signed rank test, *P < 0.05.
Fig. 2.
Fig. 2.
Identification of SARS-CoV-2−specific HLA-A*02:01−restricted CD8+ T cell epitopes. (A) Representative FACS plots of CD8+ IFN-γ/TNF staining after stimulation with the SARS-CoV-2 predicted peptide pool and individual S269–277, S976–984, and Orf1ab3183–3191 peptides. (B) Frequency of IFN-γ+ of CD8+ T cells for each SARS-CoV-2 peptide within the predicted peptide pool, with background staining subtracted (n = 5, mean). Peptide screen was performed in convalescent COVID-19 PBMCs after 10-d expansion in vitro.
Fig. 3.
Fig. 3.
Low ex vivo frequency of SARS-CoV-2−specific A2/CD8+ T cell specificities in acute and convalescent COVID-19 patients. A2/S269+CD8+ and A2/Orf1ab3183+CD8+ T cells were identified directly ex vivo from healthy (pre−COVID-19) PBMCs, tonsils, and lungs, as well as acute and convalescent COVID-19 PBMCs by tetramer magnetic enrichment. (A) Representative FACS plots of A2/S269+CD8+ and A2/Orf1ab3183+CD8+ T cells from enriched samples of (i) convalescent and (ii) acute COVID-19 PBMCs. (B) Representative FACS plots of A2/M158+CD8+ and A2/BMLF1280+CD8+ T cells from enriched healthy PBMCs. (C) Representative FACS plots of A2/S269+CD8+ and A2/Orf1ab3183+CD8+ T cells from (i) enriched adult and elderly PBMCs, and child tonsils (T) and (ii) tetramer staining of human lung tissue. (D) A2/CD8+ T cells precursor frequencies were calculated for A2/S269+CD8+, A2/Orf1ab3183+CD8+, A2/M158+CD8+, and A2/BMLF1280+CD8+ T cells enriched from either PBMCs or tonsils, or stained in lungs. Dots represent individual donors. Means ± SEM are shown. Red dots are COVID-19 acute (closed circle) and convalescent (open circle) donors. Black dots are healthy adult or elderly PBMCs (open circle), or MNCs from child tonsils (closed circle). Donors with undetectable precursor frequencies of 0 are included on the graph to show the number of donors tested. These donors were not included in statistical analyses. Statistical significance was determined with two-tailed Mann−Whitney U test, *P < 0.05, **P < 0.01, ***P < 0.001. (E) Representative FACS plots and frequencies of A2/SARS-CoV-2+CD8+ T cells in the CD8+ population in healthy and convalescent donors on d0 and d10 of expansion. Dots represent individual donors. Statistical significance was determined using a two-tailed Mann−Whitney U test, *P < 0.05.
Fig. 4.
Fig. 4.
Ex vivo activation profiles of SARS-CoV-2−specific A2/CD8+ T cells in COVID-19 subjects. (A) Overlaid FACS plots of A2/S269+CD8+ T cells from acute COVID-19 (n = 3), convalescent COVID-19 (n = 11), healthy children (tonsils) (n = 4), healthy adults (n = 4), or healthy elderly donors (n = 4) show TNaïve (CD27+CD45RA+CD95), TSCM (CD27+CD45RA+CD95+), TCM-like (CD27+CD45RA), TEM-like (CD27CD45RA), and TEMRA (CD27CD45RA+) subsets. Pie charts display the proportion of each phenotype subset based on the combined data per each COVID-19 or healthy donor group. Overlaid FACS plots of A2/M158+CD8+ and A2/BMLF1280+CD8+ T cell memory phenotypes from healthy adults are also shown. (B) Overlaid FACS plots and combined frequencies of A2/S269+CD8+ T cells showing (i) HLA-DR and CD38 or (ii) PD-1 and CD71 activation markers for acute (n = 3), convalescent (n = 11) and healthy donors (n = 12). (C) Overlaid FACS plots and combined frequencies of A2/S269+CD8+ T cells showing granzyme A, B, and K, and perforin staining for acute (n = 2) and convalescent (n = 3) donors. Representative FACS plots from one donor showing granzymes A, B, and K, and perforin of the total CD3+ T cell population. Combination gating was used to determine the frequency of cells with one to four functions for A2/S269+CD8+, total CD8+, or non-CD8+ T cells. Graphed data across multiple COVID-19 acute, COVID-19 convalescent, or naïve subjects were combined for the activation and phenotypic analyses of A2/S269 CD8+ T cells.

References

    1. Dong E., Du H., Gardner L., An interactive web-based dashboard to track COVID-19 in real time. Lancet Infect. Dis. 20, 533–534 (2020). - PMC - PubMed
    1. Wu Z., McGoogan J. M., Characteristics of and important lessons from the coronavirus disease 2019 (COVID-19) outbreak in China: Summary of a report of 72 314 cases from the Chinese center for disease control and prevention. JAMA 323, 1239–1242 (2020). - PubMed
    1. Hu Y. et al., Prevalence and severity of corona virus disease 2019 (COVID-19): A systematic review and meta-analysis. J. Clin. Virol. 127, 104371 (2020). - PMC - PubMed
    1. Stokes E. K. et al., Coronavirus disease 2019 case surveillance — United States, January 22–May 30, 2020. Morb. Mortal Wkly. Rep. 69, 759–765 (2020). - PMC - PubMed
    1. Meng H. et al., CT imaging and clinical course of asymptomatic cases with COVID-19 pneumonia at admission in Wuhan, China. J. Infect. 81, e33–e39 (2020). - PMC - PubMed

Publication types

MeSH terms